Epidemiological Surveillance Strategies for Covid-19 of Interest to the General Practitioner: The "Swiss Cheese Model"
There is a great need for better estimates of the COVID-19 burden to guide decision making. This includes the local level of general practitioner (GP) practice, which plays a vital role in all epidemiological research; the recognition of cases and their notification depends on the GP. There is a whole set of different ways to approach the knowledge of the epidemiological data of morbidity of COVID-19 in the community, some of which are of interest to the GP, such as: • Official case data, number of new infections and positivity rates; • Hospital admissions, admissions to intensive care units, and deaths; • Epidemiological mathematical modelling studies; • Serological test/seroprevalence; • Prevalence of asymptomatic disease; • Assessment of the number of secondary cases of an index case and the basic reproductive number; • Incidence rate of acute respiratory infections; • Syndromic surveillance tools and mobile phone tracking of symptoms and personal health trackers; and • Cohort studies. A single figure cannot provide a complete picture of the status of a pandemic. Conclusions about epidemiological surveillance for COVID-19 using only one type of data are likely to result in poor performance models and inaccurate forecasts. Estimates at the national level can hide local heterogeneity and seasonal differences. Furthermore, data delays, probabilistic effects, superspreading, and infections caused by asymptomatic patients create biases in the data. Consequently, it is required several alternative options, to combine disparate sources of data or lines of evidence at the general and local level, to evaluate the real incidence, and performance of infection control strategies at the level of the GP office. Each epidemiological surveillance strategy has deficiencies and weaknesses; it has holes like Swiss cheese. A hole in one layer of knowledge is not necessarily a disaster if there are many other layers to fall back on. This model underscores the importance of the general medical system that can adapt to changing situations.
Introduction
COVID-19 pandemic, triggered by the severe acute respiratory syndrome coronavirus 2 (SARS-CoV-2), is the most serious global health crisis humanity has faced since the global flu epidemic of 1918. There is a great unmet need for better estimates of the burden of COVID-19 in communities, including the local level of general practitioner (GP) practice to guide decision-making [1]. The exponentially growing number of infections by SARS-CoV-2 has led to an urgent need to expand public health activities to elucidate the epidemiology of the new virus and characterize its potential impact. However, the speed at which the pandemic is developing poses an unprecedented challenge for collecting exposure data to characterize the full breadth of severity of the disease.
From the epidemiological point of view, when making decisions about immediate control measures, should be taken into account the mortality associated with the epidemic, the importance for public health, the size of the epidemic, and the characteristics of the pathogen involved. In the COVID-19 pandemic, many urgent questions persist both of a clinical and epidemiological nature. The answers to these questions affect public health planning and clinical management: How is it distributed according to age, sex, race, Ethnicity and underlying health status? Who is most at risk or likely to suffer the most severe sequelae? How quickly will it spread? How many hospital beds and ventilators will be needed? When can the blockades be lifted? Are we in a second wave of the virus? Will it be worse than the first wave? [2, 3, 4, 5].
Classically, the GP plays a vital role in all epidemiological research; the recognition of cases and their notification depends on the GP. Currently, a confirmed case of COVID-19 requires a positive reverse transcription polymerase chain reaction (PCR) test for SARS-CoV-2, based on a pharyngeal or nasopharyngeal swab. WHO is urging governments to conduct more tests for COVID-19. Lack of data on how many people have the disease could undermine containment and mitigation efforts in many countries [6, 7, 8].
Most COVID-19 burden projections have been based on incidence calculated from CRP tests, hospitalizations, and deaths. However, such estimates are severely limited [9]. These data is not collected uniformly at the national level, there are substantial delays in reporting and data aggregation, and there are stark discrepancies in how cases and deaths are counted. Furthermore, despite advances in diagnosis, the availability of tests for infection remains limited. Moreover, hospitalizations and death rates largely capture the most severe cases of COVID-19. However, the importance of identifying asymptomatic people or with minimal symptoms who may not seek medical attention, or who are cared for at the GP level, is highlighted, since they can represent a significant proportion of community spread [10].
Lacking many diagnostic test results from the first major outbreak, researchers have had to look to other sources for clues about what happened in the early days of the pandemic and to aid future decision making. So, there is a whole set of different ways to approach the knowledge of the epidemiological data of morbidity of COVID-19 in the community [11], some of which are of interest to the GP.
For most illnesses the GP is the first point of contact in the health care system. He/she looks after a population whose age and sex composition is known. The GP play a key role in controlling outbreaks of the COVID-19 pandemic: detecting suspected cases as early as possible and conducting tests to confirm new infections so that transmission chains can be shortened (realization of PCR, contact tracing). But also, GP must be prepared to attend to the patients of the outbreaks and needs to have epidemiological information at the local and general level and disaggregated by the main variables of influence on COVID-19. The GP has to plan its work based on these data: the maintenance of the telecare in the consultations, use of Personal Protective and Safety Equipment’s, etc., until the existence and availability of vaccines, in addition to maintaining care for new health problems and continued care for chronic non-COVID-19 problems. In this scenario, this article, which is a personal view, based on an unsystematic or opportunistic search for information and the author’s experience is intended to underline the strategies to learn, at the GP level, the epidemiology of COVID-19.
Methods
For the literature review, a pragmatic approach was used that was based on a non-systematic or opportunistic narrative review considered the bibliographic references of selected articles and opportunistic searches on the Internet, since January 2020, in English and Spanish.
Discussion
The investigation of an epidemic requires the search of epidemiological, clinical and laboratory data. If the study of an epidemic is conducted properly, modes of transmission will be identified that can be used to modify practice or the development of infection control strategies [4]. Incidence
and Prevalence are two ways of expressing the morbidity rate. The Incidence rate can be useful to intuitively measure the weight of a disease outbreak and can be used to monitor the effects of preventive interventions [12, 13].
In the months of February-May 2020, around half of the world’s population was under regimes of almost total social isolation to prevent the spread of SARS-CoV-2. So, the peak of infections and deaths caused by the first outbreak was exceeded. But, the uncertainty about the evolution of the virus is very high. And the current scenario in many western countries is of a re-outbreak or second wave of the epidemic once the first peak has been overcome [14, 15, 16].
The reasonable public policy objective for COVID-19 is to maximize the degree of knowledge, to know what is not known, and to decide based on both [17]. COVID-19 cases tend to be in clusters which arrive in waves, and develop into larger outbreaks all over the world. There are evidence suggest that transmission mode is human to human. The major route of transmission of COVID-19 is droplet and close contact. The mean incubation period is about 5 days, ranging from 1 to 14 days and 95% of patients are likely to experience symptoms within 12-13 days of contact. These data suggest a 14-day medical observation period or quarantine for exposed and close contact persons. However, asymptomatic carrier has been reported and the incubation period can be 19 days, suggesting the complicated challenge to contain the outbreak. On the basis of clinical data of patients in the COVID-19 early outbreak, the mean The basic reproductive number (R0) was ranging from 2.20 to 3.58, meaning that each patient can be spreading infection to two or three other people [18, 19].
There are different ways to approach the knowledge of the morbidity data of COVID-19 in the community, each of them with strengths and weaknesses. Among them we can mention: obviously the official statistics of records of new infected cases and positivity rate, hospital admissions, admissions to intensive care units, and deaths, seroprevalence surveys, epidemiological mathematical modeling studies, the basic reproductive number, the use of proximate indicators (such as the incidence rate of acute respiratory infections or influenza), clinic and contact data collected from cell phones, data on mobility of people, information on crematoria, analysis of biological samples collected in hospitals, study of sewage, etc [11]. Some of these strategies may be of interest to the GP for the purpose of their usefulness for decision- making at the local level, in the practice of general medicine and at the community level (Table 1).
| Epidemiological Surveillance Strategies | |
|---|---|
| 1 | Official case data. Number of new infections. Positivity rates |
| 2 | Hospital admissions, admissions to intensive care units, and deaths |
| 3 | Epidemiological mathematical modeling studies |
| 4 | Serological test-Seroprevalence |
| 5 | Prevalence of asymptomatic disease |
| 6 | Assessment of the number of secondary cases of an index case. The basic reproductive number |
| 7 | Incidence rate of acute respiratory infections |
| 8 | Syndromic surveillance tools and mobile phone tracking of symptoms and personal health trackers |
| 9 | Cohort studies |
Table 1: Covid-19 Epidemiological Surveillance Strategies of Interest To The General Practitioner For Decision-Making At The Loca
Official New Cases of Infections Data; Positivity Rates
All countries are struggling to increase testing. One reason for the limited number of tests is that PCR requires trained personnel, specific chemical supplies, and expensive instruments that take hours to provide results and are often available only in laboratories that provide routine centralized services [20]. Research groups around the world are now devising tests that go beyond PCR [20].
Tests for the COVID-19 are divided into two broad categories: those that detect genetic material of the virus or the molecules on its surface, which are used to diagnose whether a person has an active infection, and those that detect the presence of antibodies, revealing whether someone has been infected and has developed an immune response to the virus. Because people with SARS-CoV-2 are most infectious at the onset of symptoms, testing of viral material is crucial in identifying who should be isolated. Of course, it is suspected that the official data on those infected is low; it is also known that some SARS-CoV-2 infections are asymptomatic. All of this means that confirmed case counts are low, but we don’t know exactly how low; perhaps, one could speak of “minimal incidence” [21]. Unfortunately, it is not easy to know the quality of data during public health emergencies of international concern such as the COVID-19 pandemic [22, 23].
The figures of new cases with positive tests in people with symptoms who come to the health services can be known, but sometimes the total number of tests carried out is not known. The test is our window to the pandemic and how it is spreading. Without evidence we have no way of understanding the pandemic. The tests allow us to identify infected people, guiding the medical treatment they receive. It allows the isolation of the infected and the tracking and quarantine of their contacts. And it can help allocate medical and staff resources more efficiently. At the GP level, it is interesting to know the local positivity rates collected in the GP practice itself. The “positivity rate” is the percentage of tests that are positive. A high percentage (“warning flag”>10%) usually reveals that the tests are not widespread enough and / or there is a massive outbreak of COVID-19 [24].
Rapid antigenic tests, which detect specific SARS- CoV-2 proteins in less than 30 minutes and do not require instruments and highly trained personnel, may be an option to identify and isolate infected people early and slow the spread of the pandemic in the region, especially in remote areas and vulnerable communities [25]. Regarding the Innova SARS-CoV-2 rapid qualitative antigen test, which has been used in the Liverpool mass tests to detect infections, a report reviewed 8774 tests and found an overall sensitivity of 76.8%, but increased to more than 95% in people with high viral loads. The overall specificity of the test was reported as 99.68%, which means a false positive rate of 0.32% (22/6967 tests). Thus it has been proposed that these tests could offer some use in terms of community policing. Although it will not detect as many infected individuals as the PCR test, it will identify those with the highest viral loads, and it is those people who are most likely to infect others. It will not replace other tests such as PCR, but it is a useful additional tool for coronavirus control [26].
Hospital Admissions, Admissions to Intensive Care Units, and Deaths
Patients in whom the disease is complicated generally require admission to hospital. In the most serious cases, said admission must be made in an Intensive Care Unit (ICU), to the point that the health authorities are determining the severity of the pandemic in the territories of their competence based on the ICU occupancy rate. Approximately
80% of cases present mild or moderate forms, 15% require hospital admission and 5% intensive care. The case fatality rate (CFR) of COVID-19 is the number of confirmed deaths due to COVID-19 divided by the total number of confirmed cases of infections with the coronavirus SARS-CoV-2. CFR should not be confused with the mortality rate or death rate which is simply the total number of deaths that occur during a specific time frame divided by the number of the total population at approximately the same time. Currently, the GP will be more interested in the CFR because he/she could want to know how many of diagnosed cases will result in the death of the patients. The CFR, as of October 27, 2020, is approximately 2.7%. But, based on information from seroprevalence studies, it appears that the fatality rate of infection is much lower, approximately 0.15-0.2%. The CFR at a general level, based on official data, does not represent the true mortality rate since mild asymptomatic or with few symptoms may not be counted, nor unreported cases- for example, deaths of people in nursing homes- ni los muertos extrahospitalarios, undiagnosed, as they have not previously had a PCR test. On the contrary, data at the local level based on GP practice can be more accurate and reliable [27, 28, 29, 30].
Epidemiological Mathematical Modelling Studies
Epidemiological models seek to describe the behavior of a disease in a population through mathematical equations or other abstraction elements, and serve as tools to make decisions that allow evaluating and defining the best control strategy to limit the economic or health impact generated by a disease, or as an analytical instrument that allows improving the perception of the dynamics that diseases present [31, 32].
Within the most used epidemiological mathematical models, there are several differences that allow them to be classified into three types [33, 34, 35]:
- Compartmental models: they are usually deterministic models in which the individuals belonging to a compartment of the model are considered as a set, instead of being considered individually.
- Focused on individuals: they are usually stochastic models in which the behavior of each individual is studied. They can be used in populations of any size and are usually studied using numerical simulations.
- Hybrids: are those that combine a deterministic part with another stochastic part COVID-19 modelling studies can also be analyzed according to their general approach as forecasting models or mechanistic models. Although there are hybrid approaches, these two types of models tend to address different questions on different time scales, and they address uncertainty differently. Forecasting models are often statistical in nature, fitting a line or curve to the data and extrapolating from there, such as looking at a pattern in a sequence of numbers and guessing the next number, without incorporating the process that produces the pattern. Well-constructed statistical frameworks can be used for short-term forecasting, using machine learning or regression, for example, to analyze epidemiological data from the past or a different location and to project SARS-CoV-2 cases into the future. These models produce quantitative projections that policymakers may need in the short term to allocate resources or plan interventions. Mechanistic models, such as the “Susceptible- Exposed-Infectious-Recovered”, mimic the way SARS-CoV-2 spreads and unlike purely statistical models, mechanistic approaches include important non-linear feedback: the more people are infect, the faster the disease spreads. However, the accuracy of the model is limited by our knowledge of the virus. Since purely statistical approaches do not explain how transmission occurs, they are generally not suitable for long- term predictions about epidemiological dynamics (when the spike will occur and whether resurgence will occur) or for inferring the efficacy of the intervention. Therefore, forecasting models limit their projections to a week or a few weeks later [36].
Serological Test-Seroprevalence
The importance of antibody testing lies in providing information to help track the spread of the virus at the community level, and assess the impact of public health efforts. Knowing how widespread the infection has been in a population could guide research and possibly public health decisions [37]. Immunological studies could give us an idea of the true infection rates in the community. However, these studies sometimes use convenience samples; Due to sampling bias and doubts about the precision of the test, these studies produce very different and almost uninterpretable results [5, 9, 38]. On the other hand, the use of serology tests for population surveys in low prevalence settings is not recommended, as this approach will likely generate more false positives than true positives, even if a test with high specificity is used. For example, if the prevalence of infection is 1% in the general population, a test with a specificity of 98% will identify two false positive results for each true positive result.
These results could lead to a false sense of security regarding the degree of immunity in the population and premature relief of public health measures based on misleading disease estimates. Furthermore, patients early in the course of the disease, or asymptomatic or paucisymptomatic patients, may have low antibody concentrations that could give false negative results [39]. Consequently, the results of the distribution of seroprevalence are very uneven geographically. Although it seems evident that in general seroprevalence is not high (from 5% or less to a maximum that could be around 20%). But, there are reservations about the precision and validity of these studies [9, 40, 41].
Prevalence of Asymptomatic Disease
It is estimated that 40-45% of people who test positive for SARS-CoV-2 have no symptoms at the time of testing. Few of the asymptomatic patients (0-10%) develop symptoms. Up to 44% of COVID-19 transmission occurs before index cases become symptomatic [34]. These facts suggest that this is a significant factor in the rapid progression of the COVID-19 pandemic [42, 43]. Asymptomatic or subclinical SARS-CoV-2 infections are often underreported, meaning that confirmed case counts may not accurately reflect the underlying epidemic dynamics. Understanding the extent of unreported infections in a given place is crucial for situational awareness. If the true size of the epidemic can be estimated, this enables a more reliable assessment of how and when non-pharmaceutical interventions should be both introduced, as infections rise, or relaxed as infections fall [44].
Assessment of the Number of Secondary Cases of An Index Case; The Basic Reproductive Number (R0)
R, the reproduction number, was first used almost a century ago in demographics. R originally measured the reproduction of people, regardless of whether a population was growing or not. In epidemiology, the same principle applies, but it measures the spread of infection in a population. A variant of R is R0. R0 is the mean number of infections produced by a single infectious person in a population without immunity; assumes that everyone in a population is susceptible to infection. That is generally not true, but it could occur when a new virus, such as SARS- CoV-2, emerges at the beginning of the epidemic. R0 has a close relative called the effective reproduction number, which is the average number of infections produced by a single infected person in a population with partial immunity.
R0 is the ability of a single infected person to spread the virus before being cured. In other words: how many susceptible people end up infected by a single infected person in a more or less short time. R0 is calculated by modeling from preliminary data. Interpretation is generally presented as direct; an outbreak is expected to continue if R0 has a value>1 and to end if R0 is<1. The potential size of an outbreak or epidemic is often based on the magnitude of the R 0 value for that event and R 0 can be used to estimate the proportion of the population that must be vaccinated to eliminate an infection from that population. Although the concept of R0 is very intuitive, its calculation is based on complex models and can lead to misinterpretations, especially regarding the real weight that R0 has on the spread of an infectious disease and the feasibility of controlling an epidemic [45, 46, 47, 48, 49, 50]. Furthermore, R0 is constantly modified during an epidemic through the control measures adopted, namely: the duration of infection; the probability of infection by contact; and the contact speed [49, 51, 52].
Incidence Rate of Acute Respiratory Infections As a Tool to Correcting Official Data of COVID-19
Common acute respiratory infections (ARI) -such as the flu, other viruses that cause the common cold, etc. - share similar routes of transmission (mainly through droplets and fomites) with COVID-19. Therefore, examination of reliable surveillance data for ARI offers a simple approach to indirectly assess the COVID-19 burden and the overall effectiveness of a population’s infection control strategies [53]. COVID-19 disease is frequently presented to the GP as an ARI. So, at present, the SARS-CoV-2 virus is one more aetiological agent of ARI [53]. So, incidence rates of ARI in GP practice during the COVID-19 outbreak represent “maximum” rates of COVID-19, and these figures allow estimating the true incidence of COVID-19 [54, 55, 56].
Syndromic Surveillance Tools and Mobile Phone Tracking of Symptoms and Personal Health Trackers
These tools work by capturing data on reported symptoms using mobile technology such as telephone applications or Internet-based questionnaires, facilitating self-guided data collection at the population level [14]. The results can be returned to inform participants of urgent medical data. Some examples are in the COVID Symptom Study [57, 58, 59]. Other tools collect Syndromic data with the use of physical activity trackers, continuous wearable devices, and smart thermometers, to provide early insight into respiratory illnesses in the community. This may include Personal Health Trackers: data from smart watches and personal health tracking devices [60]. However, public data from mobile apps has limitations. The population providing the information will not perfectly reflect the general population. Furthermore, as with any study that relies on the voluntary contribution of data, people’s differential willingness to participate may reflect differences in underlying health-seeking behavior and anxiety regarding symptoms. Additionally, several surveillance platforms for the syndrome are already in use, which can lead to consumer confusion. On the other hand, it must balance concerns related to privacy and data sharing [10, 61].
Cohort Studies
Population cohorts collect genetic, health, and lifestyle information from thousands of people over years or even decades to discover what genetic and environmental factors combine to increase disease risk. Some of these long-term cohort studies that originally focused on other diseases have been repurposed to study the COVID-19. These types of studies will create rich data sets that, in the short term, could help policy makers decide how to better control the disease and ease the roadblocks in place to stop the spread of the virus. In the long term, they will be able to track the physical, mental, and socioeconomic consequences of the pandemic, and allow scientists to address questions such as whether exposure to the virus increases health risks later in life. All of these large-scale studies have faced the logistical and technical challenges in the midst of a pandemic [62]. This design allows the identification of early predictors of long-term morbidity and allows the evaluation of hypotheses about the moment of onset of diseases from a life perspective. Continuity of care in general medicine -the relationship that is established in the long term between the GP and the patients in his / her office- allows to the GP to see repeated patterns of events and trends or regularities. Continuity of care in general medicine has practical applications for conducting cohort studies on COVID-19 in relation to patients treated in his/her practice [63].
The “Swiss Cheese Model”
The Swiss cheese model has been around since at least the 1990s [64] when it was proposed as a way of thinking about how accidents happen. During the COVID-19 pandemic, it has been transformed to visualize disease prevention. The strategy to flatten the COVID-19 cases curve can be seen as the sum of a series of measures with strengths and weaknesses. Each intervention (use of masks, tests, contact tracing, school closings, quarantine, isolation, etc.) can be view as a series of slices of Swiss cheese: imperfect barriers to virus transmission represented by holes in the cheese. Ut, when multiple partially effective interventions are combined at the beginning of an outbreak, such as stacked Swiss cheese slices, the gaps are bridged and virus transmission is slowed or even stopped [65].
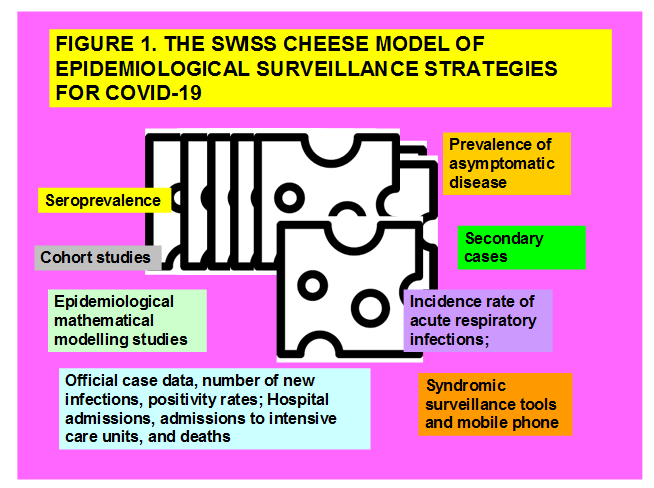
Similarly, it is proposed that for the GP the effort to understand epidemiological surveillance for COVID-19 is based on many layers of strategies and data at the community and local level (Official case data, number of new infections, positivity rates; Hospital admissions, admissions to intensive care units, and deaths; Epidemiological mathematical modelling studies; Serological test-seroprevalence; Prevalence of asymptomatic disease; Assessment of the number of secondary cases of an index case, the basic reproductive number; Incidence rate of acute respiratory infections; Syndromic surveillance tools and mobile phone tracking of symptoms and personal health trackers; and cohort studies) (Figure 1). Each epidemiological surveillance strategy has deficiencies and weaknesses; it has holes like Swiss cheese. A hole in one layer of knowledge is not necessarily a disaster if there are many other layers to fall back on. This model underscores the importance of the general medical system that can adapt to changing situations.
Conclusion
A single number cannot provide a complete picture of the status of a pandemic. Conclusions about epidemiological surveillance for COVID-19 using only one type of data are likely to result in poor performance models and inaccurate forecasts. Estimates at the national level can hide local heterogeneity. Seasonal differences in contact patterns from spring to fall are not reflected in the short time windows used in many epidemiological studies. Furthermore, delays, stochastic or probabilistic effects (effects that may appear, but do not necessarily do so), over-propagation, and infections caused by asymptomatic patients, create biases in the data at the national or regional level. Consequently, it is required several alternative options, and combining, comparing and using these disparate data sources or lines of evidence at the general and local level, to evaluate the real incidence, and performance of infection control strategies. Each epidemiological surveillance strategy has deficiencies and weaknesses; it has holes like Swiss cheese. A hole in one layer of knowledge is not necessarily a disaster if there are many other layers to fall back on. This model underscores the importance of the general medical system that can adapt to changing situations.
References
-
Stawicki SP, Jeanmonod R, Miller AC, Paladino L, Gaieskiet DF, et al. (2020) The 2019-2020 Novel Coronavirus (Severe Acute Respiratory Syndrome Coronavirus 2) Pandemic: A Joint American College of Academic International Medicine-World Academic Council of Emergency Medicine Multidisciplinary COVID-19 Working Group Consensus Paper. J Glob Infect Dis 12(2): 47-93.
-
Lipsitch M, Swerdlow DL, Finelli L (2020) Defining the Epidemiology of Covid-19-Studies Needed. N Engl J Med 382(13): 1194-1196.
-
Drew DA, Nguyen LH, Steves CJ, Menni C, Freydin M, et al. (2020) Rapid implementation of mobile technology for real-time epidemiology of COVID-19. Science 368(6497): 1362-1367.
-
Maimone S (2014) The Practical Doctor.
-
Schneider EC (2020) Failing the Test—The Tragic Data Gap Undermining the U.S. Pandemic Response. N Engl J Med 383: 299-302.
-
Offord C (2020) Governments Must Ramp Up COVID-19 Testing, Says WHO. The Scientist.
-
Gandhi RT, Lynch JB, del Rio C (2020) Mild or moderate Covid-19. N Engl J Med 383(18): 1757-1766.
-
Berlin DA, Gulick RM, Martinez FJ (2020) Severe Covid-19. N Engl J Med 383: 2451-2460.
-
Turabian JL (2020) Uncertainties in Preliminary Seroprevalence Estimation of Sars-Cov-2. Looking at the Whole Covid-19 Iceberg. Implications for General Medicine. Epidemol Int J 4(2): 1-11.
-
Chan AT, Brownstein JS (2020) Putting the Public Back in Public Health-Surveying Symptoms of Covid-19. N Engl J Med 383(7): 45.
-
Baraniuk C (2020) Estimates Vary Widely for Number of Wuhan COVID-19 Cases in January. The Scientist.
-
Armijo Rojas R (1994) Basic epidemiology in primary health care. Madrid: Díaz de Santos S.A.
-
Mantha S (2020) Ratio, rate, or risk? Lancet Infect Dis 21(2): 165-166.
-
Pollet M (2020) Coronavirus second wave: Which countries in Europe are experiencing a fresh spike in COVID-19 cases?. Euronews.
-
WHO (2020) Africa records over 200 000 COVID-19 cases. World Health Organization.
-
Dyer O (2020) Covid-19 hot spots appear across Latin America. BMJ 369: 2182.
-
Galindo J (2020) Measure, track, distance and support: a toolbox for the race to the emergence of a coronavirus vaccine. Do Better by Esade
-
He F, Deng Y, Li W (2020) Coronavirus disease 2019: What we know? J Med Virol 92(7): 719-725.
-
Binns C, Low WY, Kyung LM (2020) The COVID-19 Pandemic: Public Health and Epidemiology. Asia Pac J Public Health 32(4): 140-144.
-
Guglielmi G (2020) The explosion of new coronavirus tests that could help to end the pandemic. Researchers are scrambling to find other ways to diagnose the coronavirus and churn out millions of tests a week-a key step in returning to normality. Nature 583: 506-509.
-
Shear MD, Goodnough A, Kaplan S, Fink S, Thomas K, et al. (2020) The Lost Month: How a Failure to Test Blinded the US to Covid-19. The New York Times.
-
Idrovo AJ, Fernández Niño JA, Bojórquez Chapela I, Moreno-Montoya J (2011) Performance of public health surveillance systems during the influenza A (H1N1) pandemic in the Americas: testing a new method based on Benford’s law. Epidemiol Infect 139(12): 1827-1834.
-
Idrovo AJ, Manrique Hernández EF (2020) Data Quality of Chinese Surveillance of COVID-19: Objective Analysis Based on WHO’s Situation Reports. Asia Pac J Public Health 32(4): 165-167.
-
Turabian JL (2020) Polymerase Chain Reaction Positivity Rate for Covid-19 in General Medicine in Toledo (Spain) from May 19 to September 30, 2020. Is it Re-Outbreak, Second Wave of Virus or Lack of Testing?. Epidemol Int J 4(2): 1-11.
-
Loewy MA (2020) Rapid antigen tests: the key to curbing the pandemic in Latin America?. Medscape.
-
Mahase E (2020) Covid-19: Innova lateral flow test is not fit for “test and release” strategy, say experts. BMJ 371: 4469.
-
(2020) Information on COVID-19: Prognosis. Murciasalud.
-
Backhaus A (2020) Coronavirus: Why it’s so deadly in Italy. Demographics and why they are a warning to other countries.
-
Turabian JL (2020) Micro-Impact of the Pandemic by Covid-19 in the General Medicine: Clinical and Epidemiological Reflections from the Situation in Spain March 2020. Epidemol Int J 4(2): 1-11.
-
Beeching NJ, Fletcher TE, Fowler R (2020) Coronavirus disease 2019 (COVID-19). BMJ Best Practice 371: 3513.
-
Rincón Tobo FS, Ballesteros Ricaurte JA, Castro Romero A (2017) Tools for epidemiological modeling of animal diseases, study case: Bovine Brucellosis. Rev Cien Agri 14(2): 77-87.
-
Kucharski AJ, Klepac P, Conlan AJK, Kissler SM, Tang ML, et al. (2020) Effectiveness of isolation, testing, contact tracing, and physical distancing on reducing transmission of SARS-CoV-2 in different settings: a mathematical modelling study. Lancet Infect Dis 20(10): 1151-1160.
-
Arroyo MG (2017) Modeling and simulation in epidemiology.
-
Alvarez Esteban PC, del Barrio E, Rueda C (2020) Compartmental models: a comparative study of the evolution of the COVID19 pandemic in China and Castilla y León. (IMUVA).
-
Davies NG, Kucharski AJ, Eggo RM, Gimma A, Edmunds WJ (2020) Effects of non-pharmaceutical interventions on COVID-19 cases, deaths, and demand for hospital services in the UK: a modelling study. Lancet Public Health 5(7): 375-385.
-
Holmdahl I, Buckee C (2020) Wrong but Useful-What Covid-19 Epidemiologic Models Can and Cannot Tell Us. N Engl J Med 383: 303-305.
-
Johnson K (2020) COVID-19 antibody tests proliferate: what do they show?. Medscape.
-
(2020) EUA authorized serology test performance. FDA.
-
Peeling RW, Wedderburn CJ, Garcia PJ, Boeras D, Fongwen N, et al. (2020) Serology testing in the COVID-19 pandemic response. Lancet Infect Dis 20(9): 245-249.
-
Lopatto E (2020) The disappointing truth about antibody testing. There’s still a lot we don’t know about COVID-19. The Verge.
-
Turabian JL (2020) Covid-19 Serosurveillance. The map and the territory. Rea Int J of Community med and Pub Health 1(1): 029-033.
-
Oran DP, Topol EJ (2020) Prevalence of Asymptomatic SARS-CoV-2 Infection. Ann Intern Med.
-
Baraniuk C (2020) What the Diamond Princess taught the world about covid-19. BMJ 369: 1632.
-
Russell TW, Golding N, Hellewell J, Abbott S, Wright L, et al. (2020) Reconstructing the early global dynamics of under-ascertained COVID-19 cases and infections. BMC Med 18(332).
-
Delamater PL, Street EJ, Leslie TF, Yang YT, Jacobsen KH (2019) Complexity of the Basic Reproduction Number (R0). Emerg Infect Dis 25(1): 1‐4.
-
Bauch CT (2020) Estimating the COVID-19 R number: a bargain with the devil?. Lancet Infect Dis 21(2): 151-153.
-
Wang Y, You XY, Wang YJ, Peng LP, Du ZC, et al. (2020) Chinese Journal of Epidemiology 41(4): 476‐479.
-
Bulut C, Kato Y (2020) Epidemiology of COVID-19. Turk J Med Sci 50(1): 563‐570.
-
Viceconte G, Petrosillo N (2020) COVID-19 R0: Magic number or conundrum?. Infect Dis Rep 12(1): 8516.
-
Najafimehr H, Ali KM, Safari S, Yousefifard M, Hosseini M (2020) Estimation of basic reproduction number for COVID-19 and the reasons for its differences. Int J Clin Pract 74(8): 13518.
-
Adam D (2020) A guide to R-the pandemic’s misunderstood metric. What the reproduction number can and can’t tell us about managing COVID-19. Nature.
-
Abbott S, Hellewell J, Munday JD, Chun JY, Thompson RN, et al. (2020) Temporal variation in transmission during the COVID-19 outbreak. Centre for Mathematical Modelling of Infectious Diseases.
-
Hung CK, Wing LP, Ying CC, Hubert LKB, Leung HP (2020) Monitoring respiratory infections in covid-19 epidemics. BMJ 369: 1628.
-
Turabian JL (2020) Incidence Rate of Acute Respiratory Infections in General Medicine as a Tool to Correcting Official Data of Covid-19 in Places where the Tests of Polymerase Chain Reaction are not. Epidemol Int J 4(1): 1-11.
-
Silverman JD, Hupert N, Washburne AD (2020) Using influenza surveillance networks to estimate state- specific prevalence of SARS-CoV-2 in the United States. Sci Transl Med 12(554).
-
Zimmer K (2020) Study Identifies Abnormal Surge of Flu-like Illnesses in March. The Scientist.
-
(2020) Andalusian Agency for Healthcare Quality.
-
COVID Symptom Study & NHS COVID-19 apps compared.
-
Quer G, Radin JM, Gadaleta M, Motes KB, Ariniello L, et al. (2020) Wearable sensor data and self-reported symptoms for COVID-19 detection. Nat Med 27: 73-77.
-
Drew DA, Nguyen LH, Steves CJ, Menni C, Freydin M, et al. (2020) Rapid implementation of mobile technology for real-time epidemiology of COVID-19. Science 368(6497): 1362-1367.
-
Abbott A (2020) Thousands of people will help scientists to track the long-term health effects of the coronavirus crisis. Cohort studies that follow populations over years have quickly pivoted to trace the pandemic’s physical, mental and social consequences. Nature.
-
Turabian JL (2020) Epidemiological Value of Continuity of Care in General Medicine (Part Two). Epidemol Int J 4(1): 1-7.
-
Larouzee J, Le Coze JC (2020) Good and bad reasons: The Swiss cheese model and its critics. Safety Science 126: 104660.
-
Venkayya R (2020) A Swiss cheese approach can give us a second chance to contain Covid-19. STAT.
-
Wiles S (2020) COVID-19 and the swiss cheese system. Coronavirus, Faculty of Medical and Health Sciences. The University of Auckland.
- Epidemiological Surveillance and Rumors on Social Media
- Awareness and Treatment of Uncontrolled Hypertension in US Overweight/Obese Youths Aged 16–24 Years, NHANES 2021–2023
- Strengthening EPI Through Parental Engagement: Lessons from Dhaka Slums for IA-2030
- Mothers Knowledge of the Prevalence, Causes, Effects, Prevention and Control of Diarrhoea among Children in Ife East Local Government Area, Ile Ife, Osun State, Nigeria
- Covid-19 Reinfections Case Series from October 2023 to October 2024 in A General Medicine Office in Toledo (Spain)
- Water Contact! One Risk Too Many: Risk Factors Associated with Schistosoma haematobium infection in Osun State, Nigeria