Impact of COVID-19 on Food Security Status of College Students in West Texas
Food insecurity is a serious issue among college students in West Texas and may be exacerbated by COVID-19. No knowledge is available about the impact of COVID-19 on the food security level among college students in West Texas. Thus, the purpose of this study was to investigate the impact of the COVID-19 pandemic on students' food security. A cross-sectional study has been conducted by using an online Qualtrics survey prepared from validated questionnaires. The sample consisted of 280 college students that enrolled in this study in fall 2020. SPSS Software Program, version 28, and R version 3.6.1. were used for data analyses. In this study, 43% of college students were food insecure. Significant differences were observed in household size; however, no differences were found in education levels, race distribution, or gender among the food-secure and low and very low food-secure groups. Additionally, a higher proportion of food-insecure students reported losing their jobs during COVID-19 than their food-secure counterparts. Food-insecure students also consumed significantly less fruit and vegetables than their food-secure counterparts. Food insecurity is a critical issue among college students in West Texas. Sustainable solutions, such as food and nutrition assistance programs, should be prioritized by college management.
Introduction
The coronavirus virus 2019 (COVID-19) pandemic has negatively affected the nutrition and food security of people in the United States (US) [1, 2]. Studies show that households’ and individuals’ food insecurity levels have increased in the US during the COVID- 19 pandemic [3, 4, 5, 6]. As a result, 44.0% of low-income households [3] and 17.5% of households with children became food insecure. The main factors associated with low food security were job losses/unemployment, low income [3, 4], low education levels, households with children, and ethnicity, especially communities of color [5]. Various studies across the US have demonstrated a high level of food insecurity among college students in the pre-pandemic period. A review of 51 studies on food insecurity among US college students by Nikolaus CJ, et al. [7] observed that food insecurity prevalence ranged from 10% to 75%. Moreover, a multi-institutional cross-sectional study in various states across the US showed that 19.0% of freshmen and 25.4% of sophomores were reported to be food insecure even before the pandemic began [8, 9].
Food insecurity among college students in the US has been exacerbated by the COVID-19 pandemic [10, 11, 12]. During the pandemic, 33.0% of students in a public university in south eastern US and 34.5% of students across three universities in Texas were considered food insecure. The underlying factors for the high prevalence of food insecurity among students are multi-factorial. Some of the factors associated with the rise in food insecurity among college students during the COVID-19 pandemic include a high rate of unemployment, changes in housing, living alone, lack of cooking skills [13], being international students [12], and not being eligible for the Supplemental Nutrition Assistance Program (SNAP) [14]. The consequences of low food security among students can be short- and long-term. The short-term impact on health can result in wasting, underweight and micronutrient deficiencies [15, 16], whereas one of the long-term impacts is poor educational performance due to reported coping strategies such as longer working hours and engaging in different income seeking activities [17]. Food insecurity can also lead to hunger from skipping meals. This may result in failure to concentrate in class. Low food security among college students has also been associated with mental health problems [8, 18], which may further exacerbate challenges related to academic performance.
A cross-sectional study among 22 higher education institutions across the US has demonstrated that food insecurity has also been associated with poor sleep quality among students [18]. In addition, a systematic review of 16 studies observed that food-insecure students have a lower intake of healthy foods and higher intakes of unhealthy foods than their food-secure counterparts [19]. College students have an increased need to be food secure in order to make adequate healthy food choices and follow good nutrition practices [17]. Also, poor dietary intakes among food-insecure students could lead to obesity [9], which can compromise students’ health. With 13.3% food insecurity, Texas is one of the nine states with the highest food insecurity levels compared to the US national food insecurity level of 10.5% [20]. The COVID-19 pandemic increased the overall prevalence of food insecurity in Texas [21, 22].
Previous studies conducted among college students in Texas during the COVID-19 pandemic have demonstrated an increase in food insecurity rate [11]. Students with low and very low food security tend to have a low Healthy Eating Index (HEI) [23]. A previous cross-sectional study in 2019 was conducted in West Texas, showing that 34.3% of students presented with food insecurity in the pre pandemic era [17]. However, to date, no known studies have examined the effect of the COVID-19 pandemic on the food security level among college students in West Texas. Thus, this study aimed to investigate the impact of the COVID-19 pandemic on students’ food security status in West Texas.
Materials and Methods
Study Design and Participants
This cross-sectional study was conducted via an online survey using Qualtrics. Undergraduate and graduate students, enrolled at a large Hispanic-serving institution in West Texas, were eligible to complete the survey. The university’s enrolment for fall 2020 was 40,322 students, with approximately 83% undergraduates and 17% graduate and law students. The study inclusion criteria included currently enrolled domestic and international undergraduate and graduate students, age 18 years and older, fluent in English, and access to the internet. The survey could be completed on smartphones, IPads, tablets, laptops, or computer systems with internet access. Survey respondents were sought via the official email communication platform of the university to faculty, staff, and students. A link to the survey was provided in the email. Upon clicking the link, interested students could read a brief description of the study’s purpose, indicate their willingness to participate, and sign the informed consent forms. The online survey was announced weekly, being available for students to complete the survey between November 2020 and March 2021. The study received approval from the university’s Institutional Review Board (IRB) Human Research Protection Program in November 2020 (IRB2020-871). The survey was designed to be completed within 10 minutes, and all survey participants who indicated interest entered a $20 Amazon gift card draw.
Data Collection
The survey was adapted from the 18-item United States Department of Agriculture (USDA) Household Food Security Survey Module (HFSSM) and previously used questionnaires to assess food security status and changes to eating habits due to the COVID-19 pandemic [11, 24]. The 18-item HFSSM has a three-stage design with the added advantage of providing reliable information about the food security status of children in a household [24, 25]. Thus, collecting reliable information from students who had to go back home and stay with family or close relatives after campus and dormitory closures. The last eight items of the USDA 18-item survey included questions for students living with children in their households. The questions were adapted for contextual equivalence in times of COVID-19 to reflect changes related to COVID-19. For instance, survey respondents were asked: Since the onset of the coronavirus pandemic, (I/ We) worried whether (my/our) food would run out before (I/we) got money to buy more food.” Follow-up questions asked the frequency of the event, whether always, often, sometimes, or never. For this study’s purposes, the start of the coronavirus was set as March 12, 2020, which was the day the University President announced changes to campus events and cancelled classes for a week after spring break. The affirmative responses were coded to assess food security status based on the USDA coding structure. For households with children, 0= High food security, 1-2= Marginal food security, 3-7= Low food security, and 8-18= Very low food security, whereas, for households without children, 0= High food security, 1-2= Marginal food security, 3-5= Low food security, and 6-10= Very low food security [25].
Respondents completed socio-demographic questions such as age, race/ethnicity, year of study, marital status, educational status whether undergraduate or graduate students, visa status whether domestic or international students, and living conditions. Additional questions were included on changes made to the spending or shopping behaviors and a question was asked to assess if the consumption of fruits and vegetables, snacks and desserts, home-prepared meals, and fast food consumption stayed the same, increased, or reduced due to the pandemic. Similarly, the effect of the pandemic on employment status was measured by four questions framed to assess changes in work hours, income, or employment. For instance, one of the questions asked included-“Since the pandemic, how has your income and employment been affected?”.
The participants were divided into food security groups according to the HFSSM classification [11, 24]. Descriptive analyses on SPSS included means and standard deviations (SDs) for continuous data and frequencies for categorical data. Fisher’s exact tests in R were used to determine significant (p<0.05) differences among the food security groups.
Results
A total of 280 students participated in the study. The majority of the participants were women (69.3%) and the mean±SD age of the participants was 25±7 years. The majority were from the non-Hispanic white (49.6%), followed by the Hispanic (19.3%), Asian (16.1%), and African American/ Black (8.2%) population groups. The education levels indicated 62.1% undergraduate and 37.9% graduate level participants that were mostly single (80.7%) whereas 13.9% and 5.4% were married or living with a partner respectively. Most of the participants lived alone (47.9%) whereas 21.4% shared the house with another person and the rest with two to six roommates or family members. Children were present in 65.0% of the participants’ households. The results showed that 35.1% and 22.1% of the participants had high and marginal food security respectively, while 24.6% had low food security and 18.2% had very low food security. No significant (p≥0.05) differences were observed in respondents’ education levels, race/ethnicity, and gender, among the different food security classifications. However, there was a significant difference (p=0.040) in food security status based on household size, with a higher proportion of food-secure households having smaller household size than the low and very low food-secure groups (Table 1).
- Data Analyses
- All the data were captured in Microsoft Office ExcelTM and transported to IBM SPSS software program, version 28 and R version 3.6.1. SPSS was used for descriptive statistics.
- Food Secure
- Food Insecure
- Total group
- High food security n=98
- (35.0%) n (%)
- Marginal food security n=62
- (22.1%) n (%)
- Low food security n=69
- (24.6%) n (%)
- Variable
- Live alone
- 43 (43.9)
- 33 (53.2)
- 39 (56.5)
- 19 (37.3)
- 134 (47.9)
- 2
- 25 (25.6)
- 14 (22.6)
- 8 (11.6)
- 13 (25.5)
- 60 (21.4)
- 3
- 11 (11.2)
- 5 (8.1)
- 7 (10.1)
- 11 (21.6)
- 34 (12.1)
- 4
- 12 (12.2)
- 8 (12.9)
- 9 (13.1)
- 2 (3.9)
- 31 (11.1)
- 5
- 7 (7.1)
- 2 (3.2)
- 3 (4.3)
- 5 (9.8)
- 17 (6.1)
- 6
- 0 (0)
- 0 (0)
- 3 (4.3)
- 0 (0)
- 3 (1.0)
- 7
- 0 (0)
- 0 (0)
- 0 (0)
- 1 (1.9)
- 1 (0.4)
Table 1: Household size of participants.
The majority of the participants’ main source of income was from earning a salary. Of the total participants, 16.8% worked fulltime and 41.4% part-time, whereas the main source of income for the rest were from their parents (20.4%), scholarships (10.7%), loans (7.1%) and other forms of income (3.6%). Although 48.6% of the participants indicated no change in their household income, employment status was affected, with 13.5% and 20.5% of the respondents indicating that they lost their jobs or that their employers closed temporarily during the COVID-19 pandemic. Only 1.5% of respondents reported longer work hours during the pandemic, while 6.6% lost their jobs due to being sick, and 13.7% had to care for other household members being sick. A significant (p=0.002) difference was observed in the employment status among the food security classifications: 28.0% and 34.0% of the very low food-secure group lost their job permanently or temporarily respectively, compared to 12.3% and 24.6% in the low food-secure group, 12.0% and 13.8% in the marginally food-secure group and 6.9% and 14.0% in the food-secure groups respectively (p=0.002). In addition, 65.1% of the food-secure groups reported no change in households’ income, compared to 58.6%, 41.2% and 18.0% amongst the marginal, low, and very low food-secure groups respectively (p=0.002). No significant difference was observed in the hours worked before (p=0.196) and after (p=0.944) among the different food security categories (Table 2). There was no significant difference in food security status of students when compared based on the number of hours worked per week.
| Variable | Food secure | Food insecure | Total group n=280 (100.0%) n (%) | Significant difference between groups p | ||
|---|---|---|---|---|---|---|
| High food security n=98 (35.0%) n (%) | Marginal food security n=62 (22.1%) n (%) | Low food security n=69 (24.6%) n (%) | Very low food security n=51 (18.2%) n (%) | |||
| Hours worked pre-COVID: | 0.2014 | |||||
| No work | 29 (29.6) | 15 (24.2) | 17 (24.6) | 11 (21.6) | 72 (25.7) | |
| 1-10 hours/week | 7 (7.1) | 5 (8.1) | 2 (2.9) | 0 (0) | 14 (5.0) | |
| 11-20 hours/week | 23 (23.5) | 16 (25.8) | 16 (23.2) | 11 (21.6) | 66 (23.6) | |
| 21-30 hours/week | 12 (12.2) | 8 (12.9) | 18 (26.1) | 9 (17.6) | 47 (16.8) | |
| 31-40 hours/week | 14 (14.3) | 9 (14.5) | 9 (13.1) | 12 (23.5) | 44 (15.7) | |
| ≥41 hours/week | 13 (13.3) | 9 (14.5) | 7 (10.1) | 8 (15.7) | 37 (13.2) | |
| Hours worked post-COVID: | 0.949 | |||||
| No work | 27 (27.6) | 17 (27.4) | 19 (27.5) | 13 (25.5) | 76 (27.1) | |
| 1-10 hours/week | 9 (9.2) | 6 (9.7) | 7 (10.1) | 8 (15.6) | 30 (10.7) | |
| 11-20 hours/week | 23 (23.5) | 23 (37.1) | 19 (27.5) | 13 (25.5) | 78 (27.9) | |
| 21-30 hours/week | 15 (15.3) | 4 (6.4) | 9 (13.1) | 6 (11.8) | 34 (12.1) | |
| 31-40 hours/week | 11 (11.2) | 6 (9.7) | 10 (14.5) | 6 (11.8) | 33 (11.8) | |
| ≥41 hours/week | 13 (13.2) | 6 (9.7) | 5 (7.3) | 5 (9.8) | 29 (10.4) |
Table 2: Working conditions before and after COVID-19.
A significant difference (p<0.001) was observed in the difficulty to pay for household expenses among the food security groups since the onset of COVID-19 (Table 3). Low and very low food-secure students found it significantly (p<0.001) more difficult to pay for household expenses than the marginally and food-secure students after the onset of COVID-19. A significantly (p<0.001) larger proportion of the marginally food-secure (30.6%; 45.2%), low (55.1%; 40.6%) and very low food-insecure (38.9%; 58.1%) students had to use their savings or credit card respectively when compared to the food-secure students (16.3%; 15.3% respectively). The same trend was observed for having to borrow money for household expenses. On the other hand, a significantly (p=0.007) larger proportion of food-secure (15.3%) and marginally food-secure (8.1%) students did not have any change in their household spending compared to their low (1.4%) and very low (3.9%) food-secure counterparts (Table 3).
- Food secure
- Food insecure
- Total group
- High food security n=98
- (35.0%) n (%)
- Marginal food security n=62
- (22.1%) n (%)
- Low food security n=69
- (24.6%) n (%)
- Variable
- Difficulty paying for household expenses since COVID:
- No difficulty
- 52(60.5)
- 21 (36.2)
- 4 (6.1)
- 1 (2.0)
- 30
- A little difficult
- 29(33.7)
- 25 (43.1)
- 36(54.5)
- 18(36.0)
- 41.5
- Somewhat difficult
- 2 (2.3)
- 12 (20.7)
- 20(30.3)
- 15(30.0)
- 18.8
- Very difficult
- 3 (3.5)
- 0 (0.0)
- 6 (9.1)
- 16(32.0)
- 9.6
- Total
- 86 (100)
- 58 (100)
- 66 (100)
- 50 (100)
- No changes in spending
- 15(15.3)
- 5 (8.1)
- 1 (1.4)
- 2 (3.9)
- 23 (8.2)
- 0.003935
- 0
- Less spending
- 0 (0)
- 1 (1.6)
- 1 (1.4)
- 0 (0)
- 2 (0.7)
- 0.4215
- 0
- More grocery deliveries
- 26(26.5)
- 25 (40.3)
- 16(23.1)
- 8 (15.7)
- 75 (26.8)
- 0.02648
- 0
- More meal deliveries
- 24(24.5)
- 14 (22.6)
- 15(21.7)
- 8 (15.7)
- 61 (21.1)
- 0.7805
- 0
- More curbside pickup
- 3 (3.1)
- 1 (1.6)
- 2 (3.2)
- 1 (2.0)
- 7 (2.5)
- 1
- 0
- More bulk shopping
- 1 (1.0)
- 0 (0)
- 0 (0)
- 0 (0)
- 1 (0.4)
- 1
- 0
- More credit card purchases
- 15(15.3)
- 28 (45.2)
- 28(40.6)
- 30(58.1)
- 101(36.1)
- <0.001
- 0
- Avoiding restaurants
- 61(62.2)
- 46 (74.2)
- 55(79.7)
- 42(72.5)
- 204(72.9)
- 0.03
- 0
- Using savings
- 16(16.3)
- 19 (30.6)
- 38(55.1)
- 36(38.9)
- 109(38.9)
- <0.001
- 0
- Borrowed money
- 6 (6.1)
- 5 (8.1)
- 19(27.5)
- 22(43.1)
- 52 (18.6)
- <0.001
- 0
- Used unemployment insurance
- 22(22.4)
- 8 (12.9)
- 19(27.5)
- 17(23.6)
- 66 (23.6)
- 0.05819
- 0
- Used more food assistance programs
- 0 (0)
- 0 (0)
- 1 (1.4)
- 0 (0)
- 1 (0.4)
- 0.6503
- 0
Table 3: Changes in household spending since the onset of COVID-19.
The results in Table 4 indicate that a significantly (p<0.001) larger proportion of food-insecure participants worried about not having enough food and not having enough money for food since the onset of the COVID- pandemic compared to the food-secure participants. The same trend was observed for not being able to afford diverse and nutritious meals (p<0.001).
- Food Secure
- Food Insecure
- Total group
- High food security n=98
- (35.0%) n (%)
- Marginal food security n=62
- (22.1%) n (%)
- Low food security n=69
- (24.6%) n (%)
- Variable
- Worry about not having enough food
- No worries
- 11(11.2)
- 0 (0)
- 0 (0)
- 0 (0)
- 11 (3.9)
- Often
- 0 (0)
- 4 (6.5)
- 12(17.4)
- 26(51.0)
- 42 (15.0)
- Sometimes
- 1 (1.1)
- 35 (56.5)
- 46(66.7)
- 25(49.0)
- 107 (38.2)
- Never
- 84(96.6)
- 23 (37.1)
- 11(15.9)
- 0 (0)
- 118 (42.1)
- Not sure
- 2 (2.3)
- 0 (0)
- 0 (0)
- 0 (0)
- 2 (0.7)
- Food did not last/Not enough money for more food n=86
- (100%) n=62
- (100%) n=69
- (100%) n=51
- (100%) n=268
- (100%)
- <0.001
- 12 (4.3)
- Often
- 0 (0)
- 0 (0)
- 1 (1.4)
- 14(27.5)
- 15 (5.6)
- Sometimes
- 0 (0)
- 8 (12.9)
- 32(46.4)
- 31(60.8)
- 71 (26.5)
- Never
- 84(97.7)
- 53 (85.5)
- 32(46.4)
- 6 (11.8)
- 175 (65.3)
- Not sure
- 2 (2.3)
- 1 (1.6)
- 6 (5.8)
- 0 (0)
- 7 (2.6)
- Not afford diverse nutritious meals n=87
- (100%) n=62
- (100%) n=69
- (100%) n=51
- (100%) n=269
- (100%)
- <0.001
- 11 (3.9)
- Often
- 0 (0)
- 2 (3.2)
- 13(18.8)
- 30(58.8)
- 45 (16.7)
- Sometimes
- 0 (0)
- 22 (35.5)
- 41(59.4)
- 17(33.3)
- 80 (29.7)
- Never
- 85(97.7)
- 37 (59.7)
- 15(21.7)
- 3 (5.9)
- 140 (52.0)
- Not sure
- 2 (2.3)
- 1 (1.6)
- 0 (0)
- 1 (2.0)
- 4 (1.5)
Table 4: Anxiety about food expenditure since COVID-19.
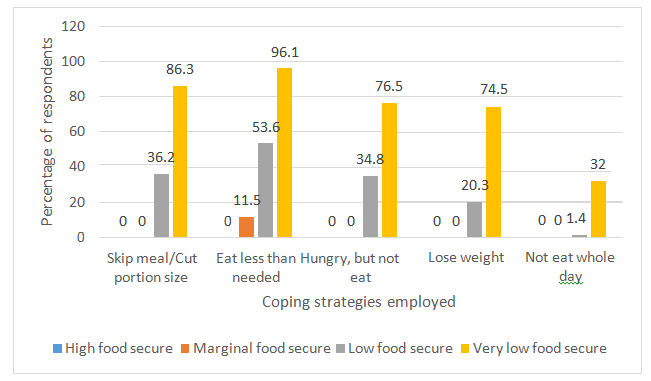
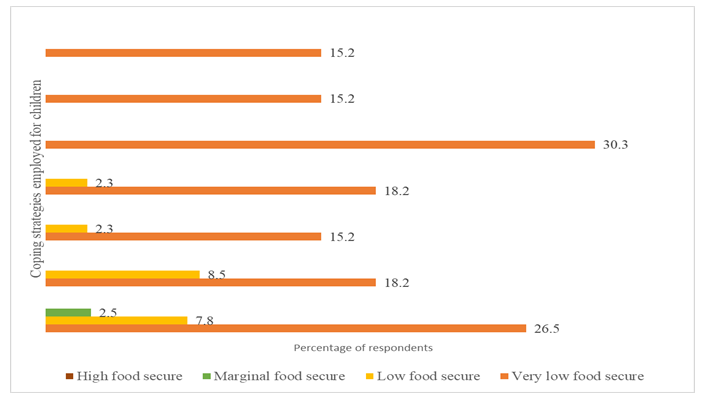
Significant (p<0.001) differences were observed for all the coping strategies employed by the participants-a significantly higher proportion of the low and very low food-secure groups employed various poor dietary coping strategies compared to the marginally and food-secure counterparts (Figure 1). Similar results were observed for the participants with children (Figure 2).
The results in Table 5 show that a significantly higher proportion of the food-secure participants made no changes to fruit and vegetable (p<0.001), snacks and dessert (p=0.000239), or home prepared meals (p=0.003732) consumption when compared to the food-insecure participants. A larger proportion of respondents who were classified as having low (52.3%) and very low (57.1%) food security consumed less fruit and vegetables than those with Food Secure Food Insecure High food security n=98 (35.0%) n (%) Marginal food security n=62 (22.1%) n (%) Low food security n=69 (24.6%) n (%) Variable Fruit and vegetable consumption n=84 (100%) n=58 (100%) n=65 (100%) n=49 (100%) n=256 (100%) <0.001 24 (8.6) Less 8 (9.5) 16 (27.6) 34(523.) 28(57.1) 86 (33.6) More 24(28.6) 14 (24.1) 14(21.5) 9 (18.4) 61 (23.8) No change 52(61.9) 28 (48.3) 17(26.2) 12(24.5) 109(42.6) Snacks and dessert consumption n=84 (100%) n=58 (100%) n=65 (100%) n=48 (100%) n=255 (100%) <0.000239 25 (8.9) Less 23 (27.4) 22 (37.9) 38(58.5) 25 (52.1) 108(42.4) More 30 (35.7) 27 (46.6) 19(29.2) 17 (35.4) 93 (36.5) No change 31 (36.9) 9 (15.5) 8 (12.3) 6 (12.5) 54 (21.2) marginal (27.6%) and high (9.5%) food security. With regards to home prepared meals, a larger proportion of marginally (74.2%), low (75.0%) and very low (58.3%) food-secure participants reported consuming more home prepared meals than the high (52.4%) food-secure participants since the onset of COVID-19 pandemic. Although the majority of the food-insecure participants consumed less fast foods than the food-secure participants, this was not significant (p=0.076).
Very low food security n=51 (18.2%) n (%)
Total group
p-value between groups Missing data
n=280 (100.0%) n (%) n (%)
| Home prepared meals | n=84 (100%) | n=58 (100%) | n=64 (100%) | n=48 (100%) | n=254 (100%) | 0.003732 | 26 (9.3) |
|---|---|---|---|---|---|---|---|
| Less | 6 (7.1) | 2 (3.4) | 5 (7.8) | 9 (18.8) | 22 (8.7) | ||
| More | 44(52.4) | 43 (74.2) | 48(75.0) | 28(58.3) | 163(64.2) | ||
| No change | 34(40.5) | 13 (22.4) | 11(17.2) | 11(22.9) | 69 (27.2) | ||
| Fast food consumption | n=83 (100%) | n=58 (100%) | n=64 (100%) | n=48 (100%) | n=253 (100%) | 0.08878 | 27 (9.6) |
| Less | 41(49.4) | 41 (70.7) | 37(57.8) | 34(70.8) | 153(60.5) | ||
| More | 19(22.9) | 9 (15.5) | 16(25.0) | 9 (18.8) | 53 (20.9) | ||
| No change | 23(27.7) | 8 (13.8) | 11(17.2.) | 5 (10.4) | 47 (18.6) |
Table 5: Food consumption since the onset of the COVID-19 pandemic.
Discussion
Food insecurity on college campuses is a growing problem that may be exacerbated by the recent COVID-19 pandemic. Food insecurity is characterized by an inability to access food of adequate quality and quantity in a socially acceptable manner and may negatively affect nutrition and health of people [16]. Results of this study, which focused on college students from a university in West Texas, revealed that the prevalence of food insecurity, including low and very low food security, was 42.8% in 2020-2021, higher than a previously observed prevalence of 34.3% in a 2017-2018 study conducted within the same institution [17]. The overall prevalence of food insecurity in this study is thus similar to the national rate of 45% for college students [26] while being higher than non-student households with children under the age of 18 (8.0%) [27].
The prevalence of food insecurity in the current study was much higher than the prevalence found (7.1%-25.0%) in the pre-pandemic period among other universities in a multi- institutional study in the US [8]. Furthermore, the present study had a markedly higher prevalence of food insecurity than observed at a state-funded university in Texas during COVID-19 (34.5%) [11]. On the other hand, our results are consistent with a review of 51 studies that concluded that food insecurity ranged from 10.0% to 75.0% among students in the US [7]. However, this study refers to the pre- pandemic prevalence. Food insecurity is multifaceted, and many socio-economic factors have been associated with it [17]. Our study did not focus on the factors contributing to food insecurity, but more on how working conditions, household spending, and food consumption patterns had changed in college students among the four levels of food security since the onset of COVID-19. This current study found that there were no significant differences in education levels, race distribution, or gender among the food security classifications, despite education and ethnicity being identified as factors influencing food insecurity among college students in the 2017-2018 study [17].
In the current study, a large family size has also been identified as a risk factor for food insecurity among college students. Our study found a significantly larger household size among the low and very low food- secure students compared to those in the marginally and food-secure groups. Similarly, Ihabi AN, et al. [28] found that an increase in household size by one member could increase the odds of household food insecurity by 77.0% [28]. A recent study conducted in New Mexico also found that an additional member in a household could increase the odds of food insecurity during COVID-19 by 40% [29]. Regardless of race/ethnicity, gender, age, income, or educational level, the current and previous studies have shown that people from larger household sizes may be more susceptible to food insecurity. Similarly, households with children are also more susceptible to food insecurity [29]. In our study, children were present in 65.0% of the students’ households. The association between food insecurity and unemployment is well known [30]. Employment status and number of hours worked per week were associated with food insecurity among college students from a previous study within the same university between 2017-2018 [17].
The majority (58.2%) of the students in this study reported that they were employed fulltime or part-time and their main source of income was from earning a salary. During 2017-2018, a higher proportion of students (62.4%) also reported being employed [17]. Our current study showed that 13.5% and 20.5% of the student participants reported losing their jobs permanently or temporarily during the COVID-19 pandemic, respectively. Significantly higher proportions (28.0%) of very low food-secure students reported losing their jobs during COVID-19 than their food- secure counterparts (6.9%). Unemployment status among college students may affect food insecurity, well beyond the effects on economic instability. Consistent results were shown in the national data that concludes that households with a fulltime employed adult were associated with 4.1 lower odds of being food insecure [31]. Similarly, a recent cross- sectional online survey among 250,701 individuals in the US found that adults who were not working or unemployed had 1.8 higher odds of being food insecure than those who were employed [4]. Interestingly, no significant differences were observed in the hours worked per week before and since the COVID-19 pandemic among the different food security categories in this study.
Previous studies have identified housing utilities and food expenditure as significant risk factors of food insecurity in the US, Canada, and South Korea [32, 33, 34]. It has also been established that food access is directly affected by household income and food budget [35]. The findings of the current study show that a significantly higher proportion of food-insecure students had difficulty affording household expenses when compared to the food-secure students since the onset of the COVID-19 pandemic. Interestingly, a relatively small proportion of students reported that they had no changes in their spending, however, a significantly larger proportion of the food-secure students reported no changes compared to the food-insecure students. This may be explained by a significantly higher proportion of food-insecure students that used their credit cards, savings and borrowing money for household expenses since the onset of COVID-19. The same trend was observed for unemployment insurance, but this was not significant. Although other studies have found working longer hours to provide sufficient income for household expenses [17], only 1.5% of the students in this study reported working longer hours during the COVID-19 pandemic.
The findings of our study showed that food-insecure students reported adopting poor food-choice coping strategies that may affect their dietary quality. Food-insecure students were more likely to skip a meal or cut portion sizes, eat less than needed, and not being able to afford diverse and nutritious meals. These findings are consistent with other studies, in which food-insecure people tend to adopt poor dietary coping mechanisms to reduce their food expenditure and afford other expenses such as housing [17]. In addition to the coping strategies employed, the current study observed different food consumption patterns between the food- secure and food-insecure students since the onset of the COVID-19 pandemic. Generally, the majority of the students avoided restaurants since the onset of the pandemic. In addition, food-insecure students reported eating less fruit and vegetables and more fast foods, snacks, and desserts than their food-secure counterparts. This finding is consistent with a study at Midwestern US universities, showing that food-insecure students reported lower consumption of fruit and vegetables than their food-secure peers [13, 36].
To the best of our knowledge, this is the first university- level study in West Texas to examine the impact of COVID-19 on food insecurity among college students. Previous studies have identified food insecurity during college as one of the main barriers to graduating [37]. With already high food insecurity prevalence across this and other US university campuses before the outbreak of COVID-19, it is of utmost importance to identify how COVID-19 impacted the food security status among college students. In this study, poor coping strategies such as diminished diet quality were observed among food-insecure students. This finding presents important policy implications to improve access to federal nutrition assistance programs among college students, such as SNAP. Before the pandemic, students were able to access SNAP if they were enrolled as fulltime students. Due to an increase in food insecurity during COVID-19, students who were enrolled at least part-time were granted expanded eligibility for the SNAP [38, 39]. However, this change in eligibility is temporary and may hinder students to access and utilize such programs because of stigma and confusion over eligibility guidelines. With college students being identified as emerging at-risk populations for food insecurity, permanent expansion or updated qualifying exemptions for college students are needed [40]. In addition, universities should make it a priority to utilize SNAP outreach activities on campus [40].
This study has several strengths. We used a valid and reliable questionnaire to assess the prevalence of food insecurity [11, 24]. The study had a large sample size that reflects current national racial/ethnicity demographic profiles compared to similar studies. In addition, the gender and ethnicity distribution of our sample was consistent with the gender (50.1% women and 49.9% men) and ethnicity distribution of the institution, namely majority non-Hispanic white (53.2%) followed by Hispanic (27.2%) and Black or African American (5.9%) students during fall 2021. However, a higher proportion of graduate students participated (37.9%) in our study compared to the student body consisting of 18.1% graduate students during fall 2021. This is reflected in the mean±SD age of the participants of 25±7 years. The majority (81.3%) of students at the institution are younger than 25 years.
Despite the strengths, there are some limitations of the study to be considered. Due to the nature of a cross-sectional design, it is impossible to establish the causal relationship of food insecurity with underlying risk factors. Participants were recruited using a convenience sampling method; therefore, results may not be able to be generalized to other populations. Information was gathered from self- reported data which may have caused recall bias among participants. Additionally, while the 18-item HFSSM by USDA
is the gold standard for assessing food insecurity among US households, this current measure has not been validated for use in a college population. The present study also has made adaptions to the HFSSM in order to reflect changes related to COVID-19, which may affect internal consistency.
Conclusion
This study found a high prevalence of food insecurity among college students in West Texas at 42.8%. Food insecurity prevalence was especially high in large households and those students that were unemployed. In addition, food- insecure students tend to have more difficulty in affording both household and food expenditures than their food-secure counterparts. The COVID-19 pandemic contributed to coping mechanisms being employed by food-insecure students such as reducing meal size or variability of diet. While food-secure students did not have any dietary changes since the onset of COVID-19, food-insecure students showed poorer dietary quality, consuming more fast foods, snacks, and desserts, and lesser fruit and vegetables. Our findings have important health implications for holistic approaches to improve housing, employment, and food insecurity among college students. Although a food pantry is available on campus and useful to provide a short-term solution, it may not reduce food insecurity and hunger among college students over the long term due to social stigma, lack of knowledge about such campus program, and transportation. Raising student awareness and normalization of such a campus program should be prioritized. Technology-based food insecurity reduction efforts may be able to reach all students, regardless of their access to campus. Future research is also needed to investigate the impact of a campus food pantry on reducing the prevalence and severity of food insecurity among college students. Finally, new evidence suggests that the most at- risk populations for food insecurity include college students across the world. To fully understand the combined impact of COVID-19 on food insecurity and nutrition among the college population, international research is essential to monitor and ultimately combat emerging changes in food insecurity.
Author Contributions: The project was conceptualized by G.M., T.I., H.L. and L.L.P. Data were collected and managed by T.I. and G.M. Institutional Review Board approval was obtained by L.L.P., G.M, and W.O.T. The abstract was written by L.L.P. The introduction was written by W.N., methods by T.I., data analyses and results by W.O.T., and discussion and conclusions by H.L. The finalized manuscript was reviewed by L.L.P. and W.O.T. All authors edited the manuscript before finalization by H.L., G.M., L.L.P. and W.O.T.
Funding: This research received no external funding. Incentives were funded by the senior author research funding received from the institution.
Institutional Review Board Statement: The Texas Tech University Institutional Review Board approved the study (IRB2020-871).
Informed Consent Statement: Informed consent was obtained from all subjects involved in the study. The informed consent statement was: “by agreeing to complete the online questionnaire, we will assume that you have provided your consent to participate in the study.” Data Availability Statement: Data is available from the senior author (W.O.T.).
Acknowledgments: We thank the students for their participation in the study. We also acknowledge Carolina Garcia, our Research Assistant, for her assistance in data collection and literature searches.
Conflicts of Interest: The authors declare no conflict of interest.
References
-
Dunn CG, Kenney E, Fleischhacker SE, Bleich SN (2020) Feeding low-income children during the Covid-19 pandemic. New Eng J Med 382(18): e40.
-
Bauer L (2020) The COVID-19 crisis has already left too many children hungry in America. Brookings.
-
Wolfson JA, Leung CW (2020) Food insecurity and COVID-19: Disparities in early effects for US Adults. Nutrients 12(6): 1648.
-
Parekh N, Ali SH, O’Connor J, Tozan Y, Jones AM, et al. (2021) Food insecurity among households with children during the COVID-19 pandemic: Results from a study among social media users across the United States. Nutr J 20(1): 73.
-
Niles MT, Beavers AW, Clay LA, Dougan MM, Pignotti GA , et al. (2021) A multi-site analysis of the prevalence of food insecurity in the United States, before and during the COVID-19 pandemic. Curr Dev Nutr 5(12): nzab135.
-
Niles MT, Bertmann F, Belarmino EH, Wentworth T, Biehl E, et al. (2020) The early food insecurity impacts of COVID-19. Nutrients 12(7): 2096
-
Nikolaus CJ, An R, Ellison B, Nickols-Richardson SM (2020) Food insecurity among college students in the United States: Ascoping review. Adv Nutr 11(2): 327- 348.
-
El Zein A, Shelnutt KP, Colby S, Vilaro MJ, Zhou W, et al. (2019) Prevalence and correlates of food insecurity among U.S. college students: A multi-institutional study. BMC Pub Health 19(1): 660.
-
El Zein A, Colby SE, Zhou W, Shelnutt KP, Greene GW, et al. (2020) Food insecurity is associated with increased risk of obesity in US college students. Curr Dev Nutr 4(8): nzaa120.
-
Mialki K, House LA, Mathews AE, Shelnutt KP (2021) Covid-19 and college students: Food security status before and after the onset of a pandemic. Nutrients 13(2): 628.
-
Owens MR, Brito-Silva F, Kirkland T, Moore CE, Davis KE, et al. (2020) Prevalence and social determinants of food insecurity among college students during the COVID-19 Pandemic. Nutrients 12(9): 2515.
-
Soldavini J, Andrew H, Berner M (2021) Characteristics associated with changes in food security status among college students during the COVID-19 pandemic. Translat Behav Med 11(2): 295-304.
-
Davitt ED, Heer MM, Winham DM, Knoblauch ST, Shelley MC (2021) Effects of COVID-19 on university student food security. Nutrients 13(6): 1932.
-
United States Department of Agriculture (2021). Food and Nutrition Service. SNAP Eligibility; USDA Food and Nutrition Service, Washington DC, USA.
-
Meade B, Thome K (2017) International Food Security Assessment, 2017-2027, GFA-28; USDA Economic Research Service, Washington DC, USA.
-
United States Department of Agriculture (2017) Official USDA food plans: cost of food at home at four levels, US average; USDA, Washington DC, USA.
-
Abu B, Oldewage-Theron W (2019) Food insecurity among college students in West Texas. Br Food J 121(3): 738-754.
-
Hagedorn RL, Olfert MD, MacNell L, Houghtaling B, Hood LB, et al. (2021) Fontenot, M. C. College student sleep quality and mental and physical health are associated with food insecurity in a multi-campus study. Public Health Nutr 24(13): 4305-4312.
-
Shi Y, Davies A, Farinelli MA (2021) The association between food insecurity and dietary outcomes in university students: A systematic review. J Acad Nutr Diet 121(12): 2475-2500.
-
Jensen AC, Rabbitt MP, Gregory CA, Singh A (2021) Household Food Security in the United States in 2020. USDA Economic Research Service, Washington DC, USA.
-
Higashi RT, Sood A, Conrado AB, Shahan KL, Leonard T, et al. (2022) Experiences of increased food insecurity, economic and psychological distress during the COVID-19 pandemic among Supplemental Nutrition Assistance Program-en- rolled food pantry clients 25(4): 1027-1037.
-
Schanzenbach D, Tomeh N (2020) State Levels of Food Insecurity During COVID-19. Institute for Policy Research. Northwestern University, South Africa.
-
Silva FB, Osborn DE, Owens MR, Kirkland T, Moore CE, et al. (2021) Influence of COVID-19 pandemic restrictions on college students’ dietary quality and experience of the food environment. Nutrients 13(8): 2790.
-
Nord M, Coleman Jensen A (2014) Improving food security classification of households with children. J Hunger Env Nutr 9(3): 318-333.
-
(2021) United States Department of Agriculture (USDA) Economic Research Service (ERS). Food security in the US: Survey tool. USDA- ERS. USDA, Washington DC.
-
Goldrick Rab S, Baker Smith C, Coca V, Looker E, Williams T (2020) College and university basic needs insecurity: A national real college survey report.
-
Vanderbilt University Medical Center (2020) new findings reported from Vanderbilt University Medical Center describe advances in COVID-19 (well-being of parents and children during the COVID-19 pandemic: a national survey). Mental Health Weekly Di- gest, News RX LLC.
-
Ihabi AN, Rohana AJ, Wan Manan WM, Wan Suriati WN, Zalilah MS, et al. (2013) Nutritional outcomes related to household food insecurity among mothers in rural Malaysia. J health pop nutr 31(4): 480-489.
-
Rogus S, Coakley KE, Martin S, Gonzales Pacheco D, Sroka CJ (2022) Food Security, Access, and Challenges in New Mexico during COVID-19. Curr Dev Nutr 6(1): nzab139.
-
Huang J, Kim Y, Birkenmaier J (2016) Unemployment and household food hardship in the economic recession. PHN 19(3): 511-519.
-
Nord M, Coleman Jensen A, Gregory C (2014) Prevalence of US food insecurity is related to changes in unemployment, inflation, and the price of food, ERR-167. USDA Economic Research Services, Washington DC, pp: 1-36.
-
Coleman Jensen A, Helms VE, Mentzer Morrison R (2020) Food insecurity rates are relatively high for participants in housing and urban development (HUD) assistance programs. Amber Waves, pp: 1-16.
-
Fafard St Germain AA, Tarasuk V (2020) Homeownership status and risk of food insecurity: examining the role of housing debt, housing expenditure and housing asset using a cross sectional population-based survey of Canadian households. Int J Equity Health 19(1): 5.
-
Seo BK, Park GR (2021) Food insecurity and housing affordability among low-income families: does housing assistance reduce food insecurity?. PHN 24(13): 4339- 4345.
-
United States Government Accountability Office (GAO) (2018) Food insecurity: better information could help eligible college stu- dents access federal food assistance benefits. Report to Congressional requesters. GAO, Washington DC.
-
Leung CW, Wolfson JA, Lahne J, Barry MR, Kasper N, et al. (2019) Associations between food security status and diet-related outcomes among students at a large, public Midwestern university. JAND 119(10): 1623-1631.
-
Wolfson JA, Insolera N, Cohen A, Leung CW (2022) the effect of food insecurity during college on graduation and type of degree attained: evidence from a nationally representative longitudinal survey. PHN 25(2): 389-397.
-
Hanson M (2022) College Enrollment & Student Demographic Statistics.
-
Snelling A, Hagedorn R (2021) 1 in 3 college students face food insecurity expanding SNAP benefits on campus will help stave off hunger. The Conversation.
-
Hagedorn Hatfield RL, Hood LB, Hege A (2022) A Decade of College Student Hunger: What We Know and Where We Need to Go. Frontiers in public health.
- Epidemiological Surveillance and Rumors on Social Media
- Awareness and Treatment of Uncontrolled Hypertension in US Overweight/Obese Youths Aged 16–24 Years, NHANES 2021–2023
- Strengthening EPI Through Parental Engagement: Lessons from Dhaka Slums for IA-2030
- Mothers Knowledge of the Prevalence, Causes, Effects, Prevention and Control of Diarrhoea among Children in Ife East Local Government Area, Ile Ife, Osun State, Nigeria
- Covid-19 Reinfections Case Series from October 2023 to October 2024 in A General Medicine Office in Toledo (Spain)
- Water Contact! One Risk Too Many: Risk Factors Associated with Schistosoma haematobium infection in Osun State, Nigeria