Evaluation of Soluble Intercellular Adhesion Molecule-1 and Soluble P Selection in Sickle Cell Disease
Sickle cell is a point mutation, individual homozygous Sickle disease (HbSS) shows the same genetic mutation but the severity and manifestation of this disease are extremely heterogeneous .The major pathology of sickle cell diseases is haemolysis and vaso-occlusion. This study aimed to measure plasma level of sICAM-1, P selection in steady and crisis state in sickle cell disease. 40 HbSS patients were enrolled, 20 at steady state and 20 at crisis state, then 20 AA controls and 20 AS controls. The plasma concentration of sICAM-1 of HbSS at crisis and steady state were 129.80±13.68pg/ml and 122.9± 21.65pg/ml respectively, the plasma concentration of sICAM-1 of HbAA was 118.10 ± 31.29 pg/ml while that of sICAM-1 of HbAS was 122.00 ± 27.87 pg/ml. The mean value of P selection in HbSS at crisis state was 12.50±3.42 ng/ml while the steady state was 13.35 ± 3.50 ng/ml. the mean value of p selection of HbAA was 14.36±3.83ng/ml while the mean value of p selection of HbAS was 14.49 ± 2.40ng/ml. There was no statistically significant difference (P > 0.05) in the mean value of both sICAM-1 and P selection of HbSS at crisis state and HbSS at steady state. In conclusion there is no statistical significant difference in sICAM-1 and P selection in crisis and steady state.
Introduction
Sickle Cell Diseases (SCD) affects millions of people throughout the world and particularly common among those whose ancestors came from Sub-Saharan Africa, Spanish – Speaking regions in the western Hemisphere (South America, The Caribbean and central Africa) Saudi Arabia, India and Mediterranean countries such as Turkey, Greece and Italy [1]. Sickle Cell disease is of major public health concern. From 1989 through 1993, an average of 75,000, hospitalisation due to the sickle cell disease occurred in the United States, costing approximately and 475 million dollars [2]. Sickle cell related death among black African-American children younger than 4years of age fell by 42% from 1999 through 2002. This drop coincided with the introduction in 2000 of a vaccine that protects against invasive pneumococcal disease [3].
In 2006 the World Health Organisation (WHO) pronounced Nigeria as the country with the highest number of sufferer of sickle cell anaemia in the world .The global health watch dog put the annual number of sickle cell anaemia suffers in African at about 200,000noting that Nigerian accounts for 150,000 sickle cell anaemia every year [4]. In most countries, where sickle cell anaemia is a major public health concern, its management has remained inadequate, national control programmes do not exist. The basic facilities to manage the patients are usually absent. Systematic screening is not a common practice and the diagnoses is usually made when a patient present with a severe complication .Simple cheap and very cost effective procedure such as the use of penicillin to prevent infections are not widely available in many countries. The governing bodies of WHO have adopted two resolutions on haemoglobin disorder. The resolution on sickle cell disease from the 59th world health assembly in May 2006 and the resolution on thalassemia from the 118th meeting of the WHO executive board call upon affected countries and the secretariat of WHO to strengthen their response to these conditions. In addition a resolution on the prevention and management of birth defects, including sickle cell disease and thalassemia were adopted by the 63th world health assembly in May 2010 [5].
In a resolution of World Health Assembly (WHA) 57. 13 the Health Assembly urged member states to mobilizes resources for action on genomics and in May 2005 the executive Board took note of the secretariat’s report on control of genetics disease subsequently, the Assembly of the African Union at its fifth ordinary session supported the inclusion of sickle cell anaemia in the list of public health priorities [6].
The major pathology of sickle cell diseases is haemolysis and vaso occlusion, endothelial activation has a major role in the pathophysiology of sickle cell diseases Hoover, et al. [7], it is now proved that deformed sickle red cells and reticulocytes adhere abnormally to the vascular endothelium [8]. Leucocytes also adhere to the endothelial forming heterocellular aggregates which further contribute to the occlusion of small and large blood vessels [9]. The binding of sickle cells, reticulocytes and leucocytes to the endothelial membrane was mediated by endothelial adhesion molecules, which are expressed after cytokine stimulation during endothelial activation [10, 11].
Endothelial adhesion molecules such as soluble Intercellular adhesion molecules 1(sICAM-1), soluble Vascular cell Adhesion Molecule(sVCAM-1), P Selection etc, have shown increased levels in the blood of sickle cell patients Conran, et al. [12]. In this regard d Soluble P Selection, Soluble ICAM has been proposed to be useful maker in accessing sickle cell patients.
The aim of the study is to investigate the link between steady and crisis state in sickle cell disease and some adhesion molecules.
Materials and Methods
Sampling Techniques
Ethical Approval: Favourable ethical approval was obtained from the UNTH Health Research Ethics Committee.
Sample size: Sample size was calculated using StatMate version 2.0(www.graphpad.com). A sample size of 80 has a 99% power to detect a difference of 0.006 the means, soluble p-selection and ICAM-1 in steady state compared with crises with a significance level (alpha) of 0.05 (two-tailed).
Inclusion and Exclusion Criteria Inclusion Criteria a) SCD patients confirmed by HB electrophoresis b) Willingness to give 5ml of blood c) For Steady group, participants has no crises d) Patients age 2-45 years.
Exclusion criteria a) Paediatric and elderly patients b) SCD subjects with renal and neurological complications were excluded.
Sampling About 4 ml of whole Blood was collected into commercial EDTA tubes at a concentration of 1.5mg of K3EDTA per ml of blood for the following analysis. a) Soluble intercellular adhesion molecule 1(ICAM-1) b) Soluble p selection Laboratory Procedures Soluble Intercellular Adhesion Molecules One (Sicam-1) Using Elisa on Dar 800 Microwell Plate Reader Procedure 1. 0.1ml of the standard was pipetted into each well of the pre-coated plate, 0.1ml of the sample diluent buffer was added into the control well (zero well), 0.1ml of each properly diluted sample of plasma was added into each empty.
2. The plate was sealed with paraffin and incubates the plate at 40Covernight.Note: we recommended users leave the plate on a shaker if possible.
3. The cover was removed, the plate contents was discarded and blotted the plate onto paper towel. The wells were not completely allowed to dry at any time. The plate was washed 5times using wash buffer.
4. 0.1ml of biotinylated antibody working solution was added into each well. Cover and incubated the plate at room temperature on a plate shaker for 2-3 hours.
5. 0.1ml of prepared ABC working solution was added into each well. Covered and incubated at room temperature on a plate shaker for 1 hour. It was washed, allowing the wash buffer to remain in the well for 1-2 minutes
6. TMB was warmed to room temperature. 90μl of prepared TMB colour developing agent was added into each well and incubate plate at room temperature for 5-20 minutes (shades of blue were seen in the wells with the four most concentrated standard solution; the other wells show no obvious colour)
7. The reaction was stopped by adding 0.1ml of prepared TMB stop solution into each well. The colour changed into yellow.
8. The plate was immediately read at 450nm with a micro plate reader. Note: colour will fade over time; hence, we recommended plate to be read within 30 min after adding the stop solution.
Caution: Bubble in the wells will cause inaccurate readings. We ensure that all bubble were removed prior to taking the absorbance reading. VIII. Calculation of Result (a) Manual plate reading: (the relative O.D.450)=(the O.D.450 of each well)- (the O.D.450 of Zero well).
The standard curve can be plotted as relative O.D.450 of each standard solution(Y) vs the respective concentration of the standard (X).Known concentrations of the target proteins are plotted on the X-axis and the corresponding O.D.450 on the Y-axis. The standard curve should be in a graph that shows a direct relationship between target protein concentration and the corresponding O.D.450the greater the concentration of target protein in the sample, the higher the O.D.450 Note: if the sample measured were diluted, multiply the dilution factor to the concentrations from interpolation to obtain the concentration before dilution Determine concentration of target protein in unknown samples.
The target protein concentration of the sample was interpolated from the standard curve. Draw a horizontal line to intersect with the standard curve. A vertical line dropped from this point intersects the X-axis at the concentration of the antibody in the unknown sample.
Human Elisa Kit Forp-Selection (CD62P) Determination(Abcam)
Assay Procedure All material and prepared reagent were equilibrated at room temperature (18-25°C) 1. Add 100μL of each standard and samples were added into appropriate wells were covered and incubated for 2.5hours at room temperature or overnight at 4oC.s
2. The solutions were discarded and wash 4 times with 1X wash solution. It was Washed by filling each well with 1x wash solution (300μL) using a multi-channel pipette. Complete removal of liquid at each step is essential to good performance .after the last wash, the plate inverted and blotted against clean paper towels.
3. 100μL of 1x Biotinylated CD62P Detection Antibody was added to each well. Incubate for 1 hour at room temperature with gentle shaking.
4. The solution was discarded, and the wash was repeated.
5. 100μL of 1x HRP-Sterptavidin solution was added to each well, it was incubated for 45 minutes at room temperature with gently shaking.
6. The solution was discarded, the wash was repeated as in step (VII)
7. 100μL of TMB One-Step substrate Reagent was added to each well; it was incubated for 30 minutes at room temperature in the dark with gentle shaking.
8. 50μL of stop solution was added to each well and read at 450 nm immediately.
Calculation The mean absorbance for each set of duplicate standards, control and samples were calculated, and subtract the average zero standard optical density. The standard curve on log- log graph paper was plotted, with standard concentration on the X-axis and absorbance on the y-axis , the best-fit straight line through the standard points was drawn.
Statistical Methods Most data from the study were numerical; therefore following normality test by using D’Agostino and Omnibus test, appropriate post hoc ANOVA tests were used to test for significant difference and correlation. The Graph Padprism software version 5.02 was used.
Results
Eighty (80) subjects were used for this research, 48 were Female while 32 were males. 40 SS patients were attending UNTH Ituku- Ozzala Enugu, they were divided into 20 at crisis state and 20 at steady state. AA and AS control subjects, 20 each were used. They have average age between 2- 45 years. Soluble P Selection and soluble ICAM-1 was assayed using ELISA on DAR 800 Microwell plate Reader. The statistical variables obtained for the research is as follow:
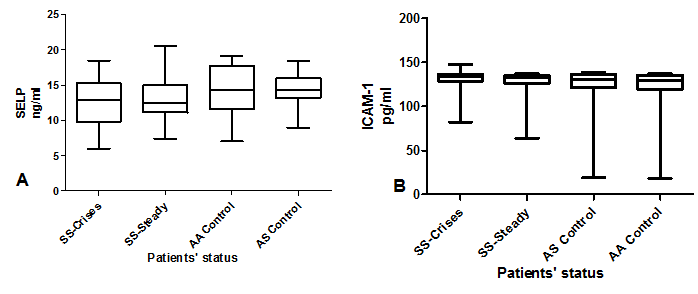
Table 1 the mean plasma level of P selection in SS at crisis state were (12.51±3.42ng/ml), SS at steady state (13.33±3.52ng/ml), AS control (14.49±2.43ng/ml) AA control (14.36±3.83ng/ml). Table 2 the mean plasma level of P selection of SS at Crisis state, SS at steady state, AS controls and AA controls were compared with each other using Dunns multiple comparison test but there was no statistical significant difference (P>0.05). Table 3 the mean Plasma level of sICAM-1 of SS at crisis state was 129.8±13.6Pg/ml, SS at steady state 122.9±21.6Pg/ml while that of the AS control and AA controls were 122.0±27.9pg/ml and 118.1±31.3pg/ ml respectively. While in table 4.5b The mean plasma level of sICAM-1of SS at Crisis state, SS at steady state, AS controls and AA controls were compared with each other using Dunns multiple comparison test but there was no statistical significant difference (P>0.05). Figure 1 Graphical representation of Adhesion molecules which include soluble P selection and soluble ICAM-1using box and whiskers plots on HbSS at crisis, HbSS at Steady, HbAS control and HbAA control.
| P Selection (ng/ml) | ||||
|---|---|---|---|---|
| Parameter | SS Crises | SS Steady | AA Control | AS Control |
| Mean2±SD | 12.51±3.42 | 13.35±3.52 | 14.36±3.83 | 14.49±2.40 |
| Median | 12.95 | 12.46 | 14.57 | 14.35 |
| Confidence interval of mean | 10.91-14.12 | 11.69-14.98 | 12.57-16.16 | 13.23-15.7 |
| Passed D’ Agostino Normality Test (α=0.05)? | Yes | Yes | Yes | Yes |
Table 1: P Selection of HbSS at Crisis, HbSS Steady, HbAS and HbAA.
| Difference in rank sum | P Value<0.05? | Summary | |
|---|---|---|---|
| SS-Crises vs SS-Steady | -1.225 | No | NS |
| SS-Crises vs AS Control | -10.2 | No | NS |
| SS-Crises vs AA control | -11.79 | No | NS |
| SS-Steady vs AS Control | -8.975 | No | NS |
| SS-Steady vs AA Control | -10.56 | No | NS |
| AS Control vs AAControl | -1.589 | No | NS |
Table 2: P value for P Selection using Dunns multiple comparison test.
| Soluble ICAM-1 (Pg/ml) | ||||
|---|---|---|---|---|
| Parameter | SS Crisis | SS Steady | AA Control | AS control |
| Mean2±SD | 129.8±13.68 | 122.9±21.65 | 118.1±31.29 | 122.0±27.87 |
| Median | 134.2 | 132.8 | 129.9 | 131.2 |
| Confidence Interval of mean. | 123.4-136.2 | 112.7-133.0 | 103.5-132.9 | 108.9-135.0 |
| Passed D’ Agostino Normality Test (α=0.05)? | NO | NO | NO | NO |
Table 3: Soluble ICAM-1 of HbSS at Crisis, HbSS Steady, HbAS and HbAA.
| Dunns multiple comparison Test for Soluble ICAM-1 | Difference in rank sum | P Value<0.05? | Summary |
|---|---|---|---|
| SS-Crises vs SS-Steady | 7.75 | No | NS |
| SS-Crises vs AS Control | 4.8 | No | NS |
| SS-Crises vs AA control | 9.75 | No | NS |
| SS-Steady vs AS Control | -2.95 | No | NS |
| SS-Steady vs AA Control | 2 | No | NS |
| AS Control vs AA Control | 4.95 | No | NS |
Table 4: P Value for Soluble Icam-1 Using Dunns Multiple Comparison Test.
Discussion
The morbidity of Sickle cell diseases varies with genotype as well as within the same genotype, some of the established predictors of this phenotypic heterogeneity are the levels of HbF present, presence of α-thalassaemia and the β-haplotype associated with the Hbs gene [11].
In 2006, the world Health organisation pronounced Nigeria as the country with the highest number of sufferer of sickle cell anaemia in the world. In a resolution, world Health Assembly urge member states to mobilizes resources for action on genomics, the executive board took note of the secretariat report on control of genetics disease and subsequently supported the inclusion of sickle cell anaemia in the list of public health properties (WHA 57.13) Our data indicate a novel mechanism for sickle cell adherence to endothelial cell causing vaso occlusion, the soluble ICAM-1 plasma level at crisis and steady state were (123.4±13.68ng/ml) and (122.9±21.65ng/ml) respectively, and when compared there was no significant difference (p>0.05).also with both AA and AS, there were no statistical significant difference at (p>0.05). Equally there was no statistical significant difference (P>0.05) in the mean value of P selection of HbSS at crisis state and HbSS at steady state and also in HbAA and HbAS. This work goes contrary with the work of Conran et al which stated that ‘’Plasma sICAM-1 levels were significantly increased in steady sickle cell disease patients compared to normal individual (285±20ng/ml vs 202±16ng/ml respectively ( p<0.002) [12]. Kato, et al. [13] showed increased plasma levels of sVCAM-1, E-selection and P-selection in the patients compared with African American healthy individuals, while no difference was found regarding the sICAM-1 level, our plasma soluble ICAM-1 in this work also agree with Kato et al work.
The work of Kanavaki, et al. [14] also goes contrally with this work hence there was significant increase in both sICAM-1 and P selection. The decrease in sICAM-1 and P selection in this work might be as a results of some of the patients being on hydroxyurea which is one of the most successfully used therapy for SCD that function primarily by elevating foetal haemoglobin levels in patients, one of the theory gaining increasing support postulate that, hydroxyurea may produce nitric oxide in the plasma of SCD following oxidation by haem groups. Nitric oxide has been shown to inhibit both sICAM-1 and VCAM-1 adhesion molecules on the surface of the endothelial cells [12].
Conclusion
In conclusion, this study shows that, there was no statistical significant difference in sICAM-1, P selection at steady and crisis state.
References
-
CDC (2011) World Sickle Cell Awareness Day.
-
Ashley Koch A, Yang Q, Olney RS (2000) Sickle Haemoglobin (Hbs) Allele and sickle cell disease: a HUGE review. Am J Epidemiol 151(9): 839-845.
-
Yanni E, Gross S, Yang Q, Olney RS (2009) Trends in pediatric Sickle Cell Disease related mortality in the United States, 1983-2002. J Paediatr 154(4): 541-545.
-
WHO (2006) Sickle cell Anaemia. 59th World Health Assembly Provisional agenda item 11.4.
-
WHO (2011) Sickle Cell disease and other haemoglobin disorders. Fact Sheet No. 308.
-
WHA (2005) 57.13, EB 116 Control of Genetic Diseases: Genomics and Human Health.
-
Hoover R, Rubin R, Wise G, Warren R (1979) Adhesion of normal and sickle erythrocytes to endothelial monolayer cultures. Blood 54(4): 872-876.
-
Hebbel R, Boogaerts M, Eaton J, Steinberg MH (1980) Erythrocyte adherence to endothelium in Sickle-Cell Anemia-A possible determinant of disease severity. N Engl J Med 302(18): 992-995.
-
Mack AK, Kato GJ (2006) Sickle cell disease and nitric oxide: a paradigm shift? Int J Biochem Cell Biol 38(8): 1237-1243.
-
Makis AC, Hatzimichael EC, Bourantas KL (2000) The role of cytokines in sickle cell disease. Ann Hematol 79(8): 407-413.
-
Steinberg MH (2005) Predicting clinical severity in Sickle cell anaemia. Br J Haematol 129(4): 465-481.
-
Conran N, Fattori A, Saad ST, Costa FF (2004) Increased levels of soluble ICAM-1 in the plasma of sickle cell patients are reversed by hydroxyurea. Am J Hematol 76(4): 343-347.
-
Kato GJ, Matyr S, Blackwelder WSC, Nichols JS, Coles WA, et al. (2005) Level of soluble endothelium derived adhesion Molecules in patient with Sickle Cell disease are associated with pulmonary hypertension, organ dysfunction and Mortality. Br J Haematol 130(6): 943- 953.
-
Kanavaki I, Makrythanasis P, Lazaiopoulou C, Kattamis A, Tzanetea R, et al. (2011) Adhesion molecules and high sensitivity C- reactive protein levels in patients with sickle cell. Eur J Clin Invest 42(1): 27-33.
- How to Identify and Overcome Barriers in Developing Blood Systems?
- Why Was Transfusion Medicine Not Recognized as a Clinical Discipline?
- Outcomes of Lenalidomide Relapsed/Refractory Patients
- Is Transfusion Always Necessary?
- The Logistics of Production and Use of Blood and Blood Components
- The Challenge for Component Therapies