Assessing the Effectiveness of STP on Knowledge & Attitude Regarding Blood Donation among Relatives of the Patients Who Requires Blood Transfusion Admitted At the Selected Hospitals of Bhopal
India with a population of about one hundred crores is naturally the country which requires lot of blood to save lives of its citizens. It has been quoted that there is a need of about 8 million units of blood every year in our country. In India 60% of population are eligible to donate blood, yet less than 5% do. Blood donation must be increased in almost every country of the world so that reliable supply of safe blood shall be available to dependent patients as per study conducted by WHO. The objective of the study is to study and compare the pre-test and post-test on effectiveness of STP on knowledge & attitude regarding blood donation among relatives of the patients who require Blood Transfusion. The data was collected from 60 relatives of the patient by using Self Structured Knowledge questionnaire and Modified Attitude scale using by before and after STP. Non-probability convenient sampling was used to select the sample. The study reveals that before administration of the STP in pre-test patient relatives had low level of knowledge & attitude regarding blood donation. The overall mean score of Knowledge & Attitude were increased after administration of STP regarding Blood Donation.
Introduction
India with a population of about one hundred crores is naturally the country which requires lot of blood to save lives of its citizens. It has been quoted that there is a need of about 8 million units of blood every year in our country [1]. The blood is needed every minute to replace blood lost because of accident, to treat shock, for minor and major surgeries, for burn victims. Patient suffering from anemia, during childbirth for the mothers, for children suffering from aliments like thalassamia, hemophilia, leukemia & blood cancer. In India 60% of population are eligible to donate blood, yet less than 5% do. Unfortunately, 83% of global populations living in developing countries have access to only 40% of blood supplied rather than voluntary non-remunerated low risk donors & this blood in 60% of cases is collected from paid & replace donors [2].
Blood donation must be increased in almost every country of the world so that reliable supply of safe blood shall be available to dependent patients as per study conducted by WHO (world health organization) in 2016. Dr Margaret Chan, WHO Director- general stated that “Although we must have many differences the same vital blood pumps through all our veins” [3]. Voluntary blood donation is the greatest gift of life any person can give or get. To evaluate awareness, knowledge and practice of blood donation between donors, department of transfusion medicine (Institute of Neurosciences & Hospital at Dhaka, Bangladesh) conducted a study in 2015. It was observed that out of 150 total donors more than 80% were males. The primary responsibility of a blood transfusion service is to provide a safe, sufficient and timely supply of blood and blood products. In fulfilling this responsibility, the BTS (Blood transfusion services) should ensure that the act of blood donation is safe and causes no harm to the donor. It should build and maintain a pool of safe, voluntary non-remunerated blood donors and take all necessary steps to ensure that the products derived from donated blood are efficacious for the recipient, with a minimal risk of any infection that could be transmitted through transfusion [4].
A blood transfusion saves millions of lives each year, but adequate and safe blood supply is becoming a demanding challenge in developing countries like India. Hence World Health Organization (WHO) has adopted a policy aimed at 100% voluntary donor blood procurement by the year 2022. Worldwide the total blood donations have been 92 million units including all types of blood groups and of them 45 percent donors were under 25 years and 40 per cent or more of the blood had come from women in 25 countries. In India, however, only six per cent women donated blood in 2011 and this is all because of unawareness. Every year, our nation requires about four Crore units of blood, out of which only a meager 40 Lakh units of blood are available which actually calls for immediate action [5]. A nation can very easily meet its need for blood if only one to three percent of its eligible population start donating blood. Data shows that India on an average has 50% of eligible donors. The need for blood is growing day by day as a result of advancement in the clinical medicine as in most developing countries like India family donors and paid donors are still main source of blood donation [6].
In this study, we implement the Structured Teaching Programme (STP) and compare the pre-test and post-test on effectiveness of STP on Knowledge & Attitude regarding Blood Donation among relatives of the patients who require Blood Transfusion.
Review of Literature
Vasanthi D. (2019) conducted a study to assess the effectiveness of STP on knowledge of blood donation among arts and science students in selected college at Vadalur. One group pre-test and post-test design was used in this study. Pre-test assessment was done through structured knowledge questionnaire, after that STP was administered. Result showed that there was improvement in level of knowledge in post-test when it was compared with pre-test. The study reveals that the subjects had inadequate knowledge of blood donation before pre-test, after administration of STP, there was a significant improvement on knowledge of the subjects regarding blood donation. The study concluded that the STP was effective in improving knowledge regarding blood donation [7].
Melku M (2018) conducted a cross sectional study to assess the knowledge and attitude and practice regarding blood donation among graduating, undergraduate health science students at the university of Gondar, Northwest Ethiopia. A pre tested administered questionnaire was used to collect the data. Stratified sampling technique was employed to select 225 science graduate study participants. The study showed that among total 255 participants 123 (48.2%) had positive attitude regarding blood donation whereas about 12.5% of them had not ever donated blood. Demographic variable age was significantly associated with practice of blood donation. Although the majority of the students had positive attitude regarding blood donation. Blood donation practice was low [8].
Jasim N. Al-Asadi. (2017) a descriptive cross-sectional study was conducted to evaluate the knowledge and attitude of Basrah University students about blood donation this involved students of two colleges in Basrah University. A total of 422 students were targeted, of these 393 (93.1%) completed the questionnaire. Only 51 (13%) of total respondents had a history of blood donation, of those 64.7% donated only once. The findings showed that most mentioned reasons behind not donating were; not being asked to donate (24.6%), inconsideration of donation (11.1%), and fear of drawing blood (8.8%). Adequate knowledge was detected in 66.7% and positive attitude in 68.7%. The study concluded that students of College of Medicine were younger, more knowledgeable, and donate more than those of College of Administration and Economics and that a substantial number of the university students had inadequate blood donation knowledge [9].
Prashant Verma (2016) conducted a descriptive cross-sectional study to assess the knowledge, attitude and practice towards blood donation and its association factors among undergraduate medical students. 322 under graduate medical students of different professional years during September to December 2016 at Neta Ji Subhash Chandra Bose Medical College Jabalpur (M.P.). A pre tested self-structured questionnaire was used to collect data on knowledge, attitude and practice regarding voluntary blood donation. Subjects belonging to more than 20 years of age group has significantly more knowledge and good attitude regarding blood donation. Female students when compared with male have more knowledge and good attitude regarding blood donation. But in case of practice of blood donation female significantly lag behind the male students. Opportunities for the blood donation should be created regularly by conducting blood donation camps this will not only increase the sense of social responsibility among the medical students through positive attitude but will also narrowed down the gap between the demand and the supply of the country [10].
Research Methodology
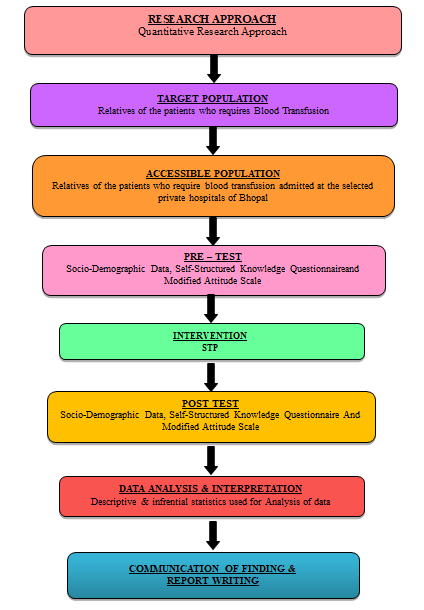
In view of the nature of the problem under the study and to accomplish the objectives of the study. Quantitative research approach was found to be appropriate to assess an effectiveness of STP Knowledge & Attitude regarding Blood Donation among relatives of the patients who requires Blood Transfusion, admitted at selected private Hospitals of Bhopal.
The selection of the design depends upon the purpose of the study, research approach and variables to be studied. Quasi experimental research design with one group pre-test post-test Experimental group was selected for the present study (Table 1) in quasi experimental research design with one group pre-test post-test, the study subjects are selected through non-provability purposive sampling.
| Group | Pre test | Intervention | Post test |
|---|---|---|---|
| Relatives of the patient who require Blood Transfusion | O1 | X | O2 |
Table 1: Experimental group was selected for the study.
- O1: Pre-test Knowledge & Attitude level of among relatives regarding Blood Donation.
- X: STP on Knowledge regarding Blood Donation.
- O2: Post-test Knowledge & Attitude level of among relatives of regarding Blood Donation.
Variables are qualities, properties or characteristics of person, things or situations that change or vary. Variables are classified based on their nature, actions and effects on the variables. Three types of variables are identified in this study. They are dependent, independent and demographic variables.
1. Independent Variable: Independent variable is the stimulus or activity that is manipulated or varied by the researcher to create the effect on the dependent variable. In the present study the STP was the independent variable. 2. Dependent Variable: Dependent variable is the outcome or response due to the effect of the independent variable, which the researcher wants to predict or explain. In the present study Knowledge & Attitude was the dependent variable in the study. 3. Demographic Variables: Researchers make an attempt to study the sample characteristics and present them in research findings. Sometimes researchers even try to establish relations of the demographic variables with the research variables. In this study the demographic variables are age, gender, educational status, employment status, marital status, diet, area of residence, source of information.
The target population consists of the total number of people or objects which are meeting the designated set of criteria. In this study target population was among relatives of the patient who require Blood Transfusion. The accessible population in the present study was relatives of patients who require Blood Transfusion and are admitted in People’s Hospital Bhanpur, Bhopal (M.P.) In the present study the sample size consisted of 60 relatives of the patients selected who requires Blood Transfusion and Non probability purposive sampling technique was selected. The physical location and conditions in which data collection takes place is the setting of the study. The research setting in this study is People’s Hospital Bhanpur Bhopal (M.P). The setting is selected because of availability of samples, feasibility of conducting study and ethical clearance. Self-Structured Knowledge questionnaire and Modified Attitude scale is the tool selected for the study. It is considered to be as the most appropriate instrument to elicit the responses from the subject.
The Tool Consists of Three Sections
- SECTION A: Socio-demographic Questionnaire
- SECTION B: Self Structured Knowledge Questionnaire
- SECTION C: Modified Attitude scale Socio-demographic data: Section A Consist of 8 item on the sample characteristics they are Age, Gender, Educational status, Employment status, Marital status, Diet, Area of residence and Source of information occupation.
Self-Structured Knowledge Questionnaire: Self structured knowledge questionnaire related to assess the knowledge of relatives of the patient regarding Blood Donation. It consist of 30 questions related to knowledge regarding Blood Donation.
Each correct response is awarded “1” mark and for incorrect response “0” mark. Maximum score for the questionnaire was “30” and minimum “0”. Score of each item refers to the presence of knowledge, a score of (0-8) indicate poor knowledge, a score of (9-18) indicate average knowledge, a score (19-30) indicates good knowledge. Scoring is done in accordance with suggestion of the expert in medical surgical nursing and statistics field.
Modified Attitude scale: Modified attitude scale used to assess the attitude of relatives of patient regarding blood donation. This scale is 4 level likert scale that contain 4 items strongly agree, agree, disagree, strongly disagree. Attitude scale contain 5 factors; Motivating factors to donate blood, Effect of Blood donation on health, Willingness to donate blood, Reasons for not donating blood and Opinion of people about Blood Donation.
| Strongly Agree | 3 |
|---|---|
| Agree | 2 |
| Disagree | 1 |
| Strongly disagree | 0 |
Table 2: Score of each item refers to- The tool comprises of 08 items regarding demographic variables and level of Knowledge & At
Table 2: Score of each item refers to- The tool comprises of 08 items regarding demographic variables and level of Knowledge & Attitude assessing by modified attitude scale and self-structured knowledge questionnaire. Tool was given to the expert for their suggestions regarding validity. Expert suggested modifying the options for some items. Based on the suggestion’s modification were done.
STP was prepared on the basis of latest available literature on Blood Donation. The STP consists of information on the following items
- Introduction of Blood Donation
- Definition of Blood donation
- How can a person donate Blood
- Before Blood donation
- During Blood Donation
- After Blood Donation
- How is donated blood used
- People who can donate blood
- People who cannot donate blood The STP administered after pre-test that will help to improve the Knowledge and Attitude of the relatives of the patient who requires Blood Transfusion admitted at the selected private Hospitals of Bhopal.
Results
Section A: Percentage Distribution of Demographic Variables
| Age | Frequency | Percent |
|---|---|---|
| 20–25years | 18 | 30 |
| 26–30years | 15 | 25 |
| 31–35years | 12 | 20 |
| 36 and above | 15 | 25 |
| Total | 60 | 100 |
Table 3: Frequency and Percent Distribution According to Age.
Distribution of Age of Participants
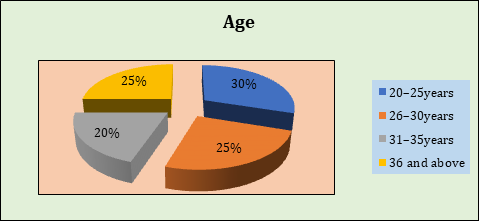
The data presented in Table 3 and Figure 2 reveals the percentage blood donation of patient relatives according to age group. Majority of blood donation 30% were from the relatives who were in the age group of 26-30 years, 25% were in age group of 20-25 years and 25% were in age group of 31-35 years, 20% were in age group of 36 and above. Most of patient relatives who participated in the study were between the age group of 26 to 30 years.
Distribution of Educational status of participants
Distribution of Gender of Participants
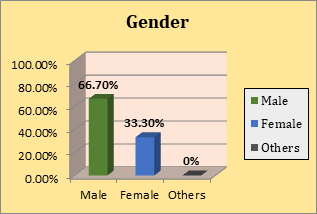
The data presented in Table 4 and Figure 3 reveals that 66.70% relatives of the patient were Male and 33.30% were Females.
| Educational Status | Frequency | Percent |
|---|---|---|
| Higher secondary | 29 | 48.3 |
| Graduate | 19 | 31.7 |
| Post graduate | 8 | 13.3 |
| Illiterate | 4 | 6.7 |
| Total | 60 | 100 |
| Marital Status | Frequency | Percent |
| Single | 7 | 11.7 |
| Married | 46 | 76.7 |
| Divorced | 3 | 5 |
| Widow/ widower | 4 | 6.7 |
| Total | 60 | 100 |
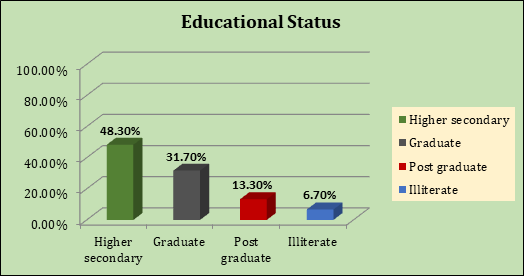
Table 6: Distribution of Educational Status of Participants.
The data presented in Table 5 and Figure 4 reveals that among total samples 48.30% were higher secondary educated, 31.70% were graduate, 13.30% were post graduate whereas 6.70% were illiterate
| Employment Status | Frequency | Percent |
|---|---|---|
| Unemployed | 18 | 30 |
| Government Employee | 13 | 21.7 |
| Private Employee | 17 | 28.3 |
| Others | 12 | 20 |
| Total | 60 | 100 |
Table 5: Distribution of Employment Status of Participants.
Distribution of Employment status of participants
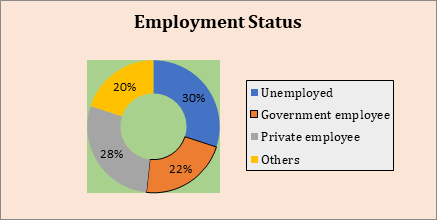
The data presented in Table 6 and Figure 5 shows the majority of patient relatives 30% were unemployed, 22% were government employee, 28% were private employee and 20% were others.
| Gender | Frequency | Percent |
|---|---|---|
| Male | 40 | 66.7 |
| Female | 20 | 33.3 |
| Others | 0 | 0 |
| Total | 60 | 100 |
Table 4: Distribution of Marital Status of Participants.
Distribution of Marital status of participants
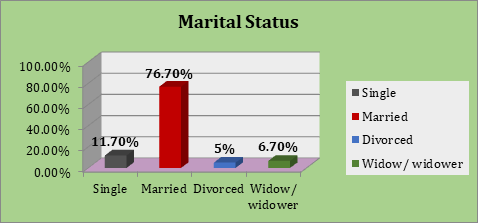
The data presented in Table 7 and Figure 6 shows that majority of patient relatives were married, 11.70% were single, 5% were divorcee and 6.70% were widow or widower.
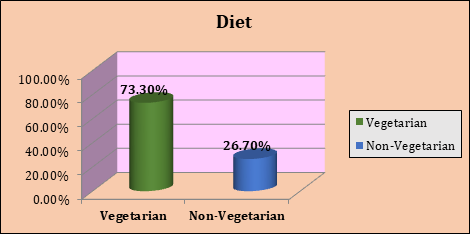
| Diet | Frequency | Percent |
|---|---|---|
| Vegetarian | 44 | 73.3 |
| Non-Vegetarian | 16 | 26.7 |
| Total | 60 | 100 |
Table 8: Distribution of Type of Diet of the Participants.
Distribution of Type of Diet of the Participants
The data presented in Table 8 and Figure 7 shows that majority of Patient Relatives 73.30% were vegetarian and 26.70% were Non vegetarian.
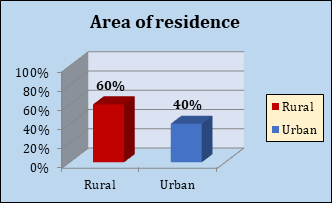
| Area of Residence | Frequency | Percent |
|---|---|---|
| Rural | 36 | 60 |
| Urban | 24 | 40 |
| Total | 60 | 100 |
Table 7: Distribution of Area of Residence of Participants.
Distribution of Area of Residence of Participants
The data presented in Table 9 and Figure 8 shows that majority of Patient Relatives 60% were living in rural area and 40% were living urban area.
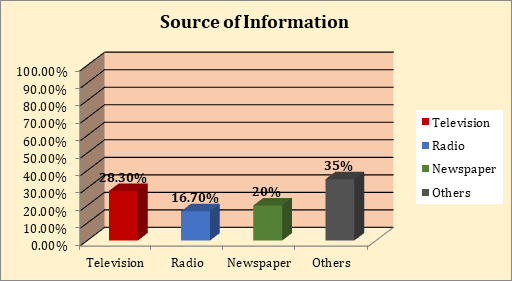
| Source of Information | Frequency | Percent |
|---|---|---|
| Television | 17 | 28.3 |
| Radio | 10 | 16.7 |
| Newspaper | 12 | 20 |
| Others | 21 | 35 |
| Total | 60 | 100 |
Table 9: Distribution of Source of Information of Participants.
Distribution of Source of Information of Participants
The data presented in Table 10 and Figure 9 shows that majority of Patient Relatives 35% had information from other sources, 28.30% from television, 20% from newspaper and 16.70% had information from radio.
Section B: Self Structured Knowledge Questionnaire Comparison
This section deals with Assessment of level of knowledge of patient relatives regarding Blood Donation before and after administering STP.
| S.N. | Mean | SD | t value | Df | P value |
|---|---|---|---|---|---|
| Pre test Post test | 12.6667 26.0333 | 1.94559 2.38617 | 33.669 | 59 | 0.002 |
Table 11: Pre-test and post-test Knowledge of patient relatives regarding Blood Donation. P value significant at P<0.05 Pre-test a
The data represented in Table 11 and Figure 10 the bar diagram shows that the Pre-test and Post-test Knowledge score of patient relatives regarding Blood Donation. The overall pre-test mean score of the relatives of patient was 12.667. The paired ‘‘t-test’’ analysis was used to find out the statistical significance on the effectiveness of STP regarding blood donation among relatives of patients.
The statistical paired t-test indicates the difference between the pre-tests and post-test knowledge score. Further the mean enhancement score was 26.0333 with SD value 2.38617. The paired t-test analysis shows that there was a significant increase in knowledge regarding blood donation among relatives of the patient who require blood transfusion admitted at selected private Hospitals of Bhopal.
Section C: Modified Attitude Scale
This section deals with Assessment of level of knowledge of patient relatives regarding Blood Donation before and after administering STP.
| Pre Test | Post Test | T Value | P Value | |||
|---|---|---|---|---|---|---|
| Mean | SD | Mean | SD | |||
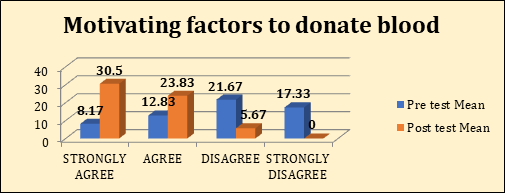
| Strongly Agree | 8.17 | 6.79 | 30.5 | 3.39 | 5.917 | 0.002 |
| Agree | 12.83 | 4.36 | 23.83 | 3.71 | 4.348 | 0.007 |
| Disagree | 21.67 | 1.86 | 5.67 | 2.34 | 10.954 | 0.001 |
| Strongly Disagree | 17.33 | 2.58 | 0 | 0 | 16.444 | 0.002 |
Table 10: Motivating Factors to Donate Blood. P value is significant at P<0.05.
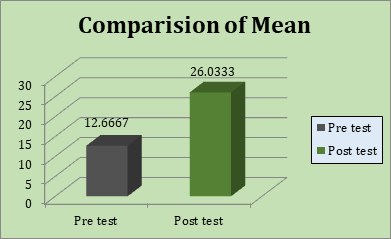
Table 12 and Figure 11 the bar diagram shows the overall comparison of pre-test and post-test mean attitude of the relatives of the patients before and after administration of the STP regarding blood donation. The overall percentage of pretest mean of motivating factors of attitude scale of relative of the patient was 8.17 which refers strongly agree, 12.83 refers to agree, 21.67 refers to disagree and 17.33 refers to strongly disagree. The overall percentages of post- test mean of motivating factors of attitude scale of relative of the patient was 30.50 strongly agree, 23.83 agree, 5.67 disagree whereas none strongly disagree. There is significant improvement of mean value in post-test.
| Pre Test | Post Test | T Value | P Value | |||
|---|---|---|---|---|---|---|
| Mean | SD | Mean | SD | |||
| Strongly Agree | 16 | 7.78 | 30.75 | 4.34 | 5.55 | 0.01 |
| Agree | 18.5 | 3.69 | 24 | 4.32 | 1.52 | .226* |
| Disagree | 17 | 2.16 | 4.25 | 0.95 | 11.5 | 0.001 |
| Strongly Disagree | 8.5 | 10.11 | 1 | 1.15 | 1.50 | .230* |
Table 13: Effect of Blood donation on health. P value is significant at P<0.05.
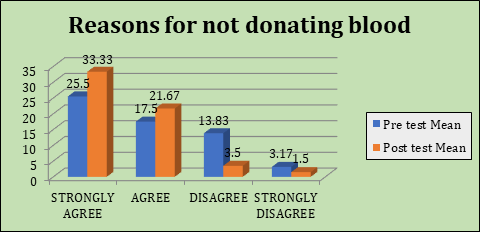
Table 13 and Figure 12 the Cylinder diagram shows the overall comparison of pre-test and post-test mean attitude of the relatives of the patients before and after administration of the STP regarding blood donation.
Overall percentage of pre-test mean of effect of blood donation on health of attitude of relative of patient was 16.0000 refers to strongly agree, 18.5000 refers agree, 17.0000 refers to disagree and 8.5000 strongly disagree. Overall percentage of post-test mean of effect of blood donation on health attitude of relatives of the patient was 30.7500 refers to strongly agree, 24.0000 refers to agree, 4.2500 refers to disagree and 1.0000 refers to strongly disagree. There were significant improvements in post-test after administration of STP.
| Pre test | Post test | T value | P value | |||
|---|---|---|---|---|---|---|
| Mean | SD | Mean | SD | |||
| Strongly Agree | 4.25 | 2.98 | 29 | 3.16 | 12.27 | 0.001 |
| Agree | 10 | 4.08 | 24.25 | 4.19 | 4.28 | 0.023 |
| Disagree | 19.5 | 1 | 5.5 | 2.38 | 9.51 | 0.002 |
| Strongly Disagree | 26.25 | 5.96 | 1.25 | 1.5 | 8.49 | 0.003 |
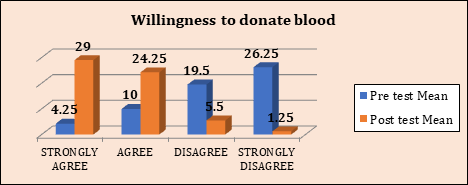
Table 12: Willingness to donate blood. P value is significant at P<0.05.
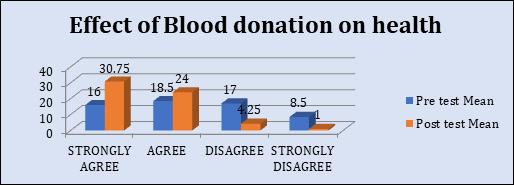
Table 14 and Figure 13 the cone diagram shows the overall comparison of pre-test and post-test mean attitude of the relatives of the patients before and after administration of the STP regarding blood donation.
| Pre test | Post test | T value | P value | |||
|---|---|---|---|---|---|---|
| Mean | SD | Mean | SD | |||
| Strongly Agree | 25.5 | 3.93 | 33.33 | 2.160 | 4.27 | 0.008 |
| Agree | 17.5 | 3.016 | 21.67 | 1.63 | 3.48 | 0.018 |
| Disagree | 13.83 | 3.76 | 3.5 | 1.37 | 6.43 | 0.001 |
| Strongly Disagree | 3.17 | 2.48 | 1.5 | 1.048 | 1.81 | .129* |
Table 14: Reasons for not donating blood. P value is significant at P<0.05.
Overall percentage of pre-test mean of patient relative to willingness to donate blood was 4.2500 which refers to strongly agree, 10.0000 refers to agree, 19.500 refers to disagree and 26.2500 refers to strongly disagree. Overall percentage of post-test mean of patient relative to willingness to donate blood was 29.0000 refers to strongly agree, 24.2500 refers to agree, 5.5000 refers to disagree and 1.2500 refers to strongly disagree. There were significant improvements in post-test after administration of STP.
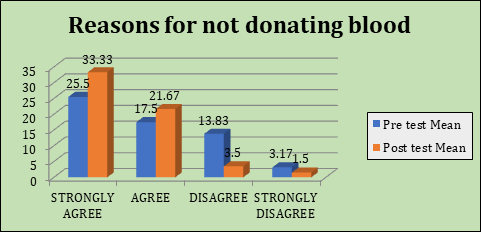
Table 15 and Figure 14 the cone diagram shows the overall comparison of pre-test and post-test mean attitude of the relatives of the patients before and after administration of the STP regarding blood donation.
Overall percentage of pre-test mean of relative of patient to reason for not donating blood was 25.5000 refers to strongly agree, 17.5000 refers to agree, 13.83 refers to disagree and 3.17 refers to strongly disagree. Overall percentage of post- test mean of relative of patient to reason for not donating blood was 33.33 refers to strongly agree, 21.67 refers to agree, 3.5000 refers to disagree and 1.5000 refers to strongly disagree. There were significant improvements in post test score after administration of STP.
| Pre test | Post test | T value | P value | |||
|---|---|---|---|---|---|---|
| Mean | SD | Mean | SD | |||
| Strongly Agree | 27.4 | 5.029 | 10.6 | 11.48 | 2.87 | 0.045 |
| Agree | 20.6 | 3.78 | 11.2 | 5.167 | 4.60 | 0.01 |
| Disagree | 10.2 | 3.563 | 23.4 | 6.73 | 4.12 | 0.015 |
| Strongly Disagree | 1.8 | 2.049 | 14.8 | 8.58 | 3.42 | 0.027 |
Table 15: Opinion of people about Blood Donation. P value is significant at P<0.05.
Table 16 and Figure 15 the cone diagram shows the overall comparison of pre-test and post-test mean attitude of the relatives of the patients on between before and after administration of the STP regarding blood donation.
Overall percentage of pre-test mean attitude of relative of patient was 27.4000 refers to strongly agree, 20.6000 refers to agree, 10.2000 refers to disagree and 1.8000 refers to strongly disagree. Overall percentage of pre-test mean attitude of relative of patient was 10.6000 refers to strongly agree, 11.2000 refers to agree, 23.4000 refers to disagree and 14.8000 refers to strongly disagree. There were significant changes between before and after administration of STP.
Discussion
• The findings are discussed under 3 headings- Section 1: Distribution of socio demographic variables of relatives of the patient. Section 2: Discussion about the Knowledge and Attitude in pre-test score of the relatives of patient. Section 3: Discussion of post-test on Effectiveness of STP on Knowledge and Attitude score of relatives of the patient.
Section 1: Distribution of socio demographic variables of relatives of the patient.
- Percentage distribution of the sample according to their age, gender, educational status, employment status, marital status, type of diet, area of residence and source of information.
- Age shows that majority of them 18 (30.0%) aged 20-25 years, 15 of them (25.0%) aged 26-30 years, 12 of them (20.0%) aged 31-35 years and 15 of them (25.0%) aged 36 year and above.
- Gender shows that majority of them 40 (66.7%) were male and 20 of them (33.3%) female.
- Educational status shows that educational status relation between the patient relative majority 29 (48.3%) were higher secondary educated, 19 of them (31.7%) graduate, 8 of them (13.3%) post graduate and 4 of them (6.7%) illiterate.
- Employment status shows that the majority 18 (30.0%) were unemployed, 13 of them (21.7%) government employee, 17 of them (28.3%) private employee and 12 of them (20.0%) others.
- Marital status shows that majority 46 (76.7%) were married, 7 of them (11.7%) single, 4 of them (6.7 %) widow/widower and 3 of them (5.0%) divorced.
- Type of diet shows that majority 44 (73.3%) were vegetarian and 16 of them (26.7%) non-vegetarian.
- Area of residence shows that majority 36(60.0%) lived in rural area and 24 of them (40.0%) urban.
- Source of information shows that majority 21 (35.0%) had information from others source, 17 of them (28.3%) had information from television, 12 of them (20.0%) had information from newspaper and 10 of them (16.7%) had information from radio.
Section 2: Discussion of pre-test score of patient relatives on Knowledge and Attitude.
- The present study shows that highest percentage of knowledge pre-test mean score of the relatives of patient was 12.667.
- The overall percentage of pre-test mean of patient relative to motivating factors score was 8.17 refers strongly agree, 12.83 refers to agree, 21.67 refers to disagree and 17.33 refers to strongly disagree.
- Overall percentage of pre-test mean of effect of blood donation on health of attitude scale of relative of patient was 16.0000 refers to strongly agree, 18.5000 refers agree, 17.0000 refers to disagree and 8.5000 strongly disagree.
- Overall percentage of pre-test mean of patient relative to willingness to donate blood was 4.2500 refers to strongly agree, 10.0000 refers to agree, 19.500 refers to disagree and 26.2500 refers to strongly disagree.
- Overall percentage of pre-test mean of relative of patient to reason for not donating blood was 25.5000 refers to strongly agree, 17.5000 refers to agree, 13.83 refers to disagree and 3.17 refers to strongly disagree.
- Overall percentage of pre-test mean score relative of patient related to opinion of people about blood donation was 27.4000 refers to strongly agree, 20.6000 refers to agree, 10.2000 refers to disagree and 1.8000 refers to strongly disagree.
Section 3: Discussion of post-test on Effectiveness of STP on Knowledge and Attitude score of the patient relatives.
• Overall percentage of post-test means Knowledge was 26.0333. There are significant changes after administration of STP.
- The overall percentage of post-test means of patient relative to motivating factors was 30.50 refers to strongly agree, 23.83 agree, 5.67 disagree, none strongly disagree.
- Overall percentage of post-test mean of effect of blood donation on health attitude of relatives of the patient was 30.7500 refers to strongly agree, 24.0000 refers to agree, 4.2500 refers to disagree and 1.0000 refers to strongly disagree.
- Overall percentage of post-test mean of patient relative to willingness to donate blood was 29.0000 refers to strongly agree, 24.2500 refers to agree, 5.5000 refers to disagree and 1.2500 refers to strongly disagree.
- Overall percentage of post-test mean of relative of patient to reason for not donating blood was 33.33 refers to strongly agree, 21.67 refers to agree, 3.5000 refers to disagree and 1.5000 refers to strongly disagree.
Conclusion
The present study was undertaken to assess the Effectiveness of the STP on Blood Donation among relatives of the patient who requires Blood Transfusion admitted at selected private Hospitals of Bhopal. The data was collected from 60 relatives of the patient by using Self Structured Knowledge questionnaire and Modified Attitude scale using by before and after STP. Non probability convenient sampling was used to select the sample. The data is organized analysed through descriptive and inferential statistics. The study reveals that before administration of the STP in pre-test patient relatives had low level of knowledge & attitude regarding blood donation. The overall mean score of Knowledge & Attitude were increased after administration of STP regarding Blood Donation.
Recommendations
On the basis of the study that had been conducted certain suggestions are given for future studies.
- A study may be replicated using a large population of the relatives.
- A study can be done to evaluate the effectiveness of the information booklet on knowledge regarding blood donation among relatives of the patients.
- A comparative study can be conducted on awareness among males and females regarding Blood Donation.
References
-
Prajapati A, Singh S, Kushwaha P, Bamaniya S (2023) A study to assess the effectiveness of structured teaching program on knowledge regarding blood donation among adults at selected urban area of Rewa (M.P). IP Journal of Paediatrics and Nursing Science 6: 136-143.
-
Pandian B (2020) Effectiveness of structured teaching programme on knowledge of blood donation among government higher secondary school students
-
WHO (2020) Voluntary unpaid blood donations must increase rapidly to meet 2020 goal.
-
Akhter B, Sultana N, Farzana S, Ahmed R, Rubby MG (2017) Awareness about blood donation among donors at a specialized tertiary level public hospital. Update Dental College Journal 6(2): 21-26.
-
WHO (2020) A Global Framework for Action Towards 100% Voluntary Blood Donation.
-
Black JM, Hawks JH (2007) Text book of Medical Surgical Nursing. 7th (Edn.), Elsevier publications, pp: 2656.
-
Vasanthi D (2019) Effectiveness of STP on knowledge on blood donation among arts and science students in selected college at Vadalur. International education and research journal 5(3): 23-27.
-
Melku M, Asrie F (2018) Knowledge, Attitude and Practices regarding Blood Donation among undergraduate Health Science students at the University of Gondar, Northwest Ethiopia. Ethiop J Health Sci 28(5): 571-582.
-
Jasim N, Asadi A (2017) Knowledge attitude and practice of blood donation among university students in Basrah, Iraq; A comparison between medical and non-medical students. Asian Journal of Medical Sciences 5(7): 7-12.
-
Prashant V, Aditya T (2018) A cross sectional study to assess knowledge attitude and practice regarding voluntary blood donation among medical students of Jabalpur, Central India. International Journal of Community Medicine and Public Health 5(3): 123-131.
- How to Identify and Overcome Barriers in Developing Blood Systems?
- Why Was Transfusion Medicine Not Recognized as a Clinical Discipline?
- Outcomes of Lenalidomide Relapsed/Refractory Patients
- Is Transfusion Always Necessary?
- The Logistics of Production and Use of Blood and Blood Components
- The Challenge for Component Therapies