Seasonal and Tidal Dynamics of Nutrients and Chlorophyll a Concentration in Water at the Sundarbans Mangrove Ecosystems of Bangladesh
The study was conducted to investigate the seasonal and tidal variations of physicochemical parameters, nutrient contents and chlorophyll a concentration from water of Passur river and Koromjol canal in the Sundarbans mangrove ecosystems during March 2018 to February 2019. Samples were collected from five sampling stations from during March, August and November where these months were considered as pre-monsoon, monsoon and post-monsoon seasons, respectively. Samples were analyzed in the laboratory of the Mawlana Bhashani Science and Technology University, Tangail and the Bangladesh Fisheries Research Institute, Mymensingh. In pre-monsoon, monsoon and post-monsoon seasons, the temperature, pH, DO, salinity, EC and TDS were ranged from 22.3 to 28.7ºC, 7.6 to 8.68, 7.85 to 13.13mg/l, 0.093 to 0.361%, 712 to 3257μs/cm and 306 to 3456ppm, respectively during high tides. During low tides, temperature, pH, DO, salinity, EC and TDS were ranged from 23.8 to 28.2ºC, 8.05 to 8.7, 7.45 to 14.39mg/l, 0.099 to 0.317%, 102 to 3857μs/cm and 213 to 3461ppm, respectively. The nutrients NH3-N, NO3-N, PO4-P, SO4 and Chlorophyll a concentrations were found 0.001 to 0.09, 3.5 to 50, 0.06 to 5.4, 30 to 272 and 0.18 to 1.75mg/l, respectively during high tides, and 0.001 to 0.39, 4.2 to 47, 0.1 to 2.75, 20 to 179 and 0.218 to 1.88mg/l, respectively during low tides. Temperature, EC and TDS were lower than suitable range at S1 to S3 during monsoon. Salinity concentrations of all stations were very low during both tides over three seasons. The NO3-N was very high than suitable limit during both tides at monsoon and postmonsoon. The PO4-P was found moderately high during both tides at all stations. The SO4 was found 187.8 and 76.87 mg/l during high tide, and 135.4 and 95.73 mg/l during low tides in pre-monsoon and post-monsoon, respectively; which were very high than suitable range of water quality. During low tide, mean concentration of chlorophyll a was 1.428 mg/l in post-monsoon, which was higher than monsoon (0.649 mg/l) and pre-monsoon (0.789 mg/l). The Passur river and the Koromjol canal are fluctuating seasonally and tidally in some magnitude and their variations can alter the water quality as well as living organisms; that would be a major concern in Sundarbans mangroves environment.
Mir Mozammal Hoque1
Bhashani Science and Technology University, Bangladesh
Koromjol canal are fluctuating seasonally and tidally in some magnitude and their variations can alter the water quality as well as living organisms; that would be a major concern in Sundarbans mangroves environment.
Keywords: Chlorophyll a; Nutrients Concentration; Sundarbans Mangrove Ecosystems
Introduction
Sundarbans, the world's largest mangroves ecosystem is covering 6000km2 in Bangladesh, provides extensive variety of ecosystem as well as economic services, which ecological importance is associated with its rich biodiversity (355 species of birds, 49 species of mammals, 87 species of reptiles, 14 species of amphibians, 234 species of floras, and 300 species of fishes) and the ecosystems valuable services [1]. As well as to its ecological and real contributions to the local and national economy, the Sundarbans also unswervingly supports the livelihood of about 7 million people breathing in the surroundings of the forest [1, 2]. Aquatic environment of the Sundarbans is extremely complex in nature due to its dynamic coastal processes where the abiotic and biotic resources are highly variable in response to the processes [1]. Mangrove ecosystems are important contributors of organic carbon and other nutrients to the adjacent coastal ecosystems and provide nutrients for phytoplankton growth, thus enhancing secondary production and promotion of commercial fisheries.
The distribution and behavior of nutrients are usually affected by tidal, seasonal and weather conditions [3]. By this process, suspended matter, nutrients, heavy metals and other compounds from inland waters are deposited in mangrove environment [4]. Besides, anthropological activities as resource extraction, fishing, shrimp farming, agriculture and tourism also affect mangrove ecosystem. Consequently of both natural and human activities, the valuable ecosystem of Sundarbans has been subjected to considerable degradation [5]. Nutrients exchange between land and sea in mangrove forest relatively depend on the availability and sources of water. Fresh water of the rivers originating from the Ganges meet in the intertidal rivers of Sundarbans, a region of transition between the freshwater and the saline water of the Bay of Bengal. Numerous rivers as Rupsha, Passur, Shibsa, Bhola, Baleswar, Arpangashia, Kholpetua, Malancha, etc. sweeping into the Bay of Bengal through the Sundarbans and carry enormous amounts of nutrients that differ with streams and periods, affecting the productivity [5]. On the other hand, worldwide mangrove nutrients loads have progressively increased in contemporary decades as a result of increasing population and industries. Accordingly, these increased nutrients may trigger the primary production and act as a source of carbon, phosphorous, nitrite and sulphate in waters. Quality of water as habitat is most important for biodiversity of aquatic system and the quality of water varies with season and climate. So, assessing the water productivity with tide and time is very essential [6, 7].
For maintaining of productive as well as balanced aquatic environment, nutrients are the prime crucial elements [8]. Phosphorus and nitrogen are the primary nutrients that in excessive amounts pollute aquatic environment. Phosphorus occurs in dissolved organic and inorganic forms or attached to sediment particles. When it remains in the sediments it is generally not available for use by algae; however, various chemical and biological processes can allow sediment phosphorus to be released back into the water [1, 9, 10, 11]. Sulphate can be found in the environment as a result of atmospheric and terrestrial processes. Major natural contributors of sulphate to the environment are sulphur released from erosion of evaporate deposits and sulphide containing rocks and minerals. One third of the sulphur reaching the environment is anthropogenic in the form of sulphate, sulphuric acid, hydrogen sulphide and SOx [12]. Chlorophyll a is the pigment that allows plants and algae to photosynthesize, in which, plants use the sun’s energy to convert carbon-dioxide and water into oxygen and cellular material. It also absorbs energy from wavelengths of violet-blue and orange-red light, however, reflects green-yellow light [13, 14].
All aquatic organisms depend directly on nutrients for their survival, growth and reproduction. Some nutrient levels are related to the chlorophyll a availability of the water body, which means the availability of phytoplankton in the water. Thus nutrient availability is directly related to the productivity of the water body. A shortage of nutrients causes the water body to be unproductive, and an excess of nutrients causes eutrophication by algal bloom and makes the water toxic [11, 14]. Thus, the nutrient concentration must be within suitable limit for a good aquatic environment and for better production of aquatic organisms [1]. Apart from the importance of nutrients dynamics in mangrove waters very few attempts have been made to investigate the concerns. The present study was an attempt to enumerate the nutrients and chlorophyll a concentrations in water with seasons and tide in different locations.
Materials and Methods
Study area
The study area is in the Bangladesh part of Sundarbans lies between the geographical coordinates of 21º 45' to 22º 30' N and 89º 00' to 90º 00' E. Sundarbans is the prime example of the estuary of the Ganges and the Brahmaputra river systems in the Bay of Bengal. This biologically and ecologically rich and diverse eco-region is located within Khulna and Bagerhat districts under Khulna division of Bangladesh. The area is experiences a subtropical monsoon climate with an annual rainfall of 1600 to 1800 mm and severe cyclonic storms [15]. The study area was divided into five sampling stations namely as S1: Passur river (22º03.107′N 089º58.329′E), S2: Passur river (22º25.680′N 089º35.680′E), S3: Koromjol canal (22º25.733′N 089º35.406′E), S4: Koromjol canal (22º25.702′N 089º35.130′E) and S5: Koromjol canal (22º25.726′N 089º34.944′E).
Sample Collection
The water samples were collected from 5 stations at Sundarbans mangrove forest during March, August and November in 2018 where the duration were divided as pre-monsoon (March to May), monsoon (June to October) and post-monsoon (October to February) seasons, respectively. To analyze the water quality parameter, 500 ml water was collected by plastic bottles with double stoppers from each sampling points. Before sampling, the bottle were cleaned and washed with detergent solution and treated with 5% HNO3 over-night. The bottles were finally rinsed with deionized water and dried. After sampling, the bottles were screwed carefully and marked with the respective identification number and brought to laboratory.
Sample Analysis
The samples were analyzed through experiment with the independent variable which collected as sample from the studying area (Passur River and Koromjol canal) and compared with the standard level of water quality parameters that is the control variable that already exists. The following analyses were done from the collected water samples: temperature, pH, dissolved oxygen (DO), salinity, electrical conductivity (EC), total dissolved solids (TDS), ammonia (NH3-N), nitrate (NO3-N), phosphate (PO4-P), sulfate (SO4) and chlorophyll a. The study was conducted through experimental method and experimental data were collected and processed with very carefully. The physicochemical parameters were analyzed in the laboratory of Environmental Science and Resource Management of the Mawlana Bhashani Science and Technology University, Tangail. Temperature and pH were determined by the thermometer and digital pH meter, respectively. Buffer solution containing pH 7.0 was used to calibrate the digital pH meter. Salinity was analyzed by Mohr’s method. DO was determined by digital DO meter where sodium thiosulphate (0.025N) was used as a reagent. EC and TDS were determined by EC and TDS meter, respectively. Samples were analyzed in the Water Quality Laboratory of Bangladesh Fisheries Research Institute (BFRI), Mymensingh for measuring concentrations of NH3-N, NO3-N, PO4-P and SO4. A high- definition spectrophotometer was used for estimating the concentration of major water nutrients. During analysis, PO4-P and SO4 were determined by the PhosVer 3 (Ascorbic acid) and SulfaVer 4 method, respectively; while NH3-N was measured by Salicylate method; and NO3-N was measured by Cadmium Reduction method [16]. Seasonal and tidal variations of nutrient concentrations were evaluated by calculating means and standard errors from the total number of samples taken for each analytic method during high and low tide within each sampling date. The chlorophyll a of water samples were analyzed by 90% acetone method in the Biochemistry and Molecular Biology Laboratory of the university.
Results and Discussion
Physicochemical Properties of Water
Temperature: The temperature were ranged from 25.6 to 28.7, 22.3 to 24.3 and 24.1 to 25ºC during high tide, and 25.4 to 28.2, 23.8 to 24.3 and 24 to 24.9ºC during low tide over pre-monsoon, monsoon and post-monsoon season, respectively (Table 1). During high tide, the highest and lowest temperatures were 28.47 and 22.36ºC at S3 in pre- monsoon and at S1 in monsoon season, respectively. Conversely, during low tide, the highest (28.17ºC) and lowest (23.9ºC) were found at S1 in pre-monsoon and at S2 in monsoon, respectively. The water temperature ranged from 23 to 27°C along the mangrove area of Kundapur [17] and varied from 26 to 28°C at the Vedaranyam mangrove forest [18].
| Parameter | Seasonal and Tidal Variation | Standard | |||||||||||||||||
|---|---|---|---|---|---|---|---|---|---|---|---|---|---|---|---|---|---|---|---|
| Pre-monsoon | Monsoon | Post-monsoon | |||||||||||||||||
| H.T. | L.T | H.T. | L.T | H.T. | L.T | ||||||||||||||
| Temp. (ºC) | 27.25±1.47 (25.6 to 28.7) | 26.46±1.05 (25.4 to 28.2) | 23.34±0.92 (22.3 to 24. 3) | 24.13±0.14 (23.8 to 24.3) | 24.57±0.15(24.1 to 25.0) | 24.56±0.15 (24.0 to 24.9) | 25 to 30 | ||||||||||||
| pH | 8.35±0.16 (7.80 to 8.55) | 8.52±0.09 (8.2 to 8.7) | 8.25±0.26 (7.60 to 8.65) | 8.29±0.06 (8.0 to 8.6) | 8.41±0.13 (7.96 to 8.68) | 8.57±0.06 (8.3 to 8.7) | 6.5 to 8.5 | ||||||||||||
| DO (mg/l) | 9.84±1.04 (7.85 to 11.68) | 9.79±0.78 (7.45 to 11.48) | 9.56±1.34 (7.85 to 12.54) | 10.41±0.83 (8.66 to 12.48) | 10.6±0.78 (8.48 to 13.13) | 10.31±2.02 (8.65 to 14.39) | 7.5 to 8.5 | ||||||||||||
| Salinity (%) | 0.17±0.03 (0.13 to 0.25) | 0.16±0.02 (0.12 to 0.21) | 0.14±0.01 (0.09 to 0.19) | 0.13±0.01 (0.09 to 0.19) | 0.24±0.06 (0.17 to 0.36) | 0.23±0.04 (0.16 to 0.32) | 0.5 to 30.0 | ||||||||||||
| EC (µs/cm) | 1599.79±961.73 (756 to 3257) | 1945.53±1336.9 (351 to 3857) | 1482.86±10006.2 (712 to 2765) | 1795.13±1324.25 (102 to 2790) | 1746.06±15.23 (1706 to 1799) | 1742.99±21.01 (1700 to 1789) | >1500 | ||||||||||||
| TDS (ppm) | 1518±1069.81 (638 to 3456) | 1812.86±1219.78 (351 to 3461) | 988.33±799.87 (306 to 2213) | 1400.12±1059.78 (213 to 2244) | 1291.13±105.65 (1139 to 1402) | 1371.39±40.95 (1254 to 1448) | 500 to 30000 |
Table 1: Seasonal and tidal variation of physicochemical parameters with seasons. pH: The pH was ranged from 7.80 to 8.55, 7.60 t
Table 1: Seasonal and tidal variation of physicochemical parameters with seasons. pH: The pH was ranged from 7.80 to 8.55, 7.60 to 8.65 and 7.96 to 8.68 during high tide, and 8.20 to 8.70, 8.10 to 8.62 and 8.30 to 8.70 during low tide at pre-monsoon, monsoon and post-monsoon seasons, respectively (Table 1). During high tide, the highest pH was 8.55 at S3 in post- monsoon and lowest was 7.82 at S3 in monsoon season. During low tide, the highest (8.66) and lowest (8.2) pH were found at S2 in post-monsoon and at S4 in monsoon season, respectively. The pH were higher during low tide than high tide at maximum stations over the three seasons. DO: The DO contents were ranged from 7.85 to 11.68, 7.85 to 12.54 and 8.48 to 13.13 mg/l during high tide, and 7.45 to 8.61, 8.66 to 12.48 and 8.65 to 14.39 mg/l during low tide in pre-monsoon, monsoon and post-monsoon seasons, respectively (Table 1). In high tide, the highest DO (11.87 mg/l) was found at S1 during post-monsoon than pre-monsoon (11 mg/l) at S1 and monsoon (11.76 mg/l) at S5. On the other hand, the lowest (8.12 mg/l) was found at S3 during monsoon followed by pre- monsoon (8.52 mg/l) at S3 and post-monsoon (9.77 mg/l) at S4. In low tide, the highest (11.33 mg/l) was found at S5 during post-monsoon than pre-monsoon (10.87 mg/l) at S3 and monsoon (11.14 mg/l) at S3. However, the lowest (8.79 mg/l) was found at S4 during pre-monsoon than monsoon (9.26 mg/l) at S4 and post-monsoon (8.92 mg/l) at S3. The higher level of DO in post-monsoon (4.37 to 7.03 mg/l) and dry winter (4.37 to 6.23 mg/l), whereas the monsoon period showed a lower DO (3.90 to 4.63 mg/l) in the river water of the Sundarbans [1].
Salinity: The salinity were ranged from 0.134 to 0.251, 0.093 to 0.187 and 0.165 to 0.361% during high tide, and 0.117 to 0.210, 0.099 to 0.192 and 0.158 to 0.317% during low tide in pre-monsoon, monsoon and post- monsoon seasons, respectively (Table 1). During high tide, the highest (0.321%) and lowest (0.110%) salinity were found at S4 in post-monsoon and at S2 in monsoon period, respectively. During low tide, the highest and lowest salinity were 0.280 and 0.122% in post-monsoon and monsoon season at same station (S4), respectively. The water salinity of the Sundarbans mangrove forest steadily increased to its maximum in pre-monsoon and started declining in monsoon season [4], and ranged from 1.2 to 2.0% during high and low tide in the western part of Sundarbans [19]. EC: The EC contents were ranged from 756 to 3257, 712 to 2765 and 1706 to 1799 µs/cm with mean contents of 1599.79, 1482.86 and 1746.06 µs/cm during high tide in pre-monsoon, monsoon and post-monsoon, respectively (Table 1). In high tide, the highest EC was 2749.33 µs/cm at S5 and lowest was 745 µs/cm at S1 during monsoon season. In low tide, the highest and lowest EC were 3241.33 µs/cm at S3 and 343.33 µs/cm at S1 during pre- monsoon and monsoon seasons, respectively. The EC contents were lower during the monsoon than the pre- monsoon period in the eastern part of the forest [4]. The EC contents moderately higher in the Sundarbans western part than the present contents of EC in Sundarbans water [5]. TDS: The TDS contents were ranged from 638 to 3456, 306 to 2213 and 1139 to 1402 ppm during high tide, and
351 to 3461, 213 to 2244 and 1254 to 1448 ppm during low tide over pre-monsoon, monsoon and post-monsoon seasons, respectively (Table 1). During high tide, the highest (3239.66 ppm) was found at S5 in pre-monsoon than post-monsoon (1892.33 ppm) at S4 and monsoon (2135.66 ppm) at S5. On the other hand, the lowest (317 ppm) was found at S3 than 470.33 ppm at S1 and 498 ppm at S2 in monsoon season. During low tide, the highest TDS contents were found 3158.33 ppm at S5 in pre-monsoon followed by 2191.66 ppm at S3 and 2220.66 ppm at S4 in monsoon season. However, the lowest was found 221.66 ppm at S2 in monsoon than post-monsoon (258.66 ppm) at S1 and pre-monsoon (423.33 ppm) at S1. As plants and animals decay, dissolved organic particles are released and can contribute to the TDS concentration in Sundarbans water. The mean TDS contents were ranged from 1716.67 to 1870, 2100 to 2263.33 and 902.67 to 1319 ppm during pre-monsoon, monsoon and post-monsoon season, respectively [5].
$$ = \frac {1}{2} \times 1 0 ^ {4} $$
$$ = 1 0 0 $$
Nutrients and Chlorophyll a in water
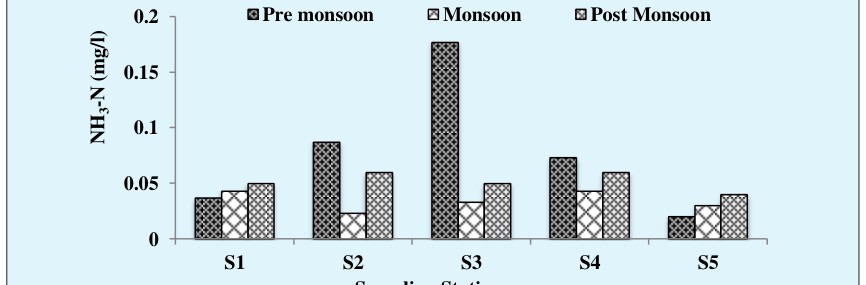
Ammonia (NH3-N): The mean NH3-N contents were 0.035, 0.037 and 0.07 mg/l during high tide in pre- monsoon, monsoon and post-monsoon, respectively (Figure 1). During high tide, the highest (0.06 mg/l) was found at S2 and S5 in post-monsoon whereas lowest (0.002 mg/l) was found at S2 in pre-monsoon season. The mean NH3-N contents were 0.078, 0.034 and 0.052 mg/l during low tide in pre-monsoon, monsoon and post- monsoon season, respectively (Figure 2). During low tide, the highest (0.17mg/l) and lowest (0.02 mg/l) both were found in pre-monsoon season at S3 and S5, respectively. Changes of NH3-N contents during high and low tides were very diminutive. The NH3-N contents were ranged from 0.001 to 0.33 mg/l in Sundarbans water [20], which are closely similar with recorded NH3-N contents during low tide at pre-monsoon season in the present study.
$$ = 1 0 0 0 0 0 0 0 0 0 0 0 0 0 0 0 0 0 0 0 0 0 0 0 0 0 0 0 0 0 0 0 0 0 0 0 0 0 0 0 0 0 0 0 0 0 0 0 0 0 0 0 $$
Nitrate (NO3-N): The NO3-N contents were ranged from 3.5 to 12.3, 8.4 to 27.2 and 5 to 50 mg/l during high tide, and 6.1 to 12.2, 4.2 to 28.2 and 10 to 47 mg/l during low tide in the study area at pre-monsoon, monsoon and post- monsoon seasons, respectively. During high tide, the highest 31.67 mg/l at S3 and the lowest 8.87 mg/l at S1 were found in post-monsoon and pre-monsoon season, respectively (Figure 3). During low tide, the highest 31.67 mg/l and the lowest 7.8 mg/l were found at S3 in post- monsoon and at S2 in pre-monsoon season, respectively (Figure 4). Mean contents of NO3-N were found 9.48, 19.07 and 22.6 mg/l during high tide, and 9.33, 17.2 and 23.2 mg/l during low tide over pre-monsoon, monsoon and post-monsoon seasons, respectively. The NO3-N concentration was found 0.04 to 0.46 mg/l with an average of 0.15 mg/l over the three sampling seasons [5].
35 $$ = \frac {1}{2} \times 1 0 ^ {4} $$
$$ = 1 0 0 $$
Pre monsoon
$$ = 1 0 0 0 0 0 0 0 0 0 0 0 0 0 0 0 0 0 0 0 0 0 0 0 0 0 0 0 0 0 0 0 0 0 0 0 0 0 0 0 0 0 0 0 0 0 0 0 0 0 0 0 $$ Monsoon Post Monsoon
$$ = \frac {1}{2} \times 1 0 ^ {4} $$
$$ = 1 0 0 $$
Pre monsoon
Monsoon
35 $$ = 1 0 0 0 0 0 0 0 0 0 0 0 0 0 0 0 0 0 0 0 0 0 0 0 0 0 0 0 0 0 0 0 0 0 0 0 0 0 0 0 0 0 0 0 0 0 0 0 0 0 0 0 $$ Post Monsoon
Phosphate (PO4-P): The PO4-P contents were ranged from 0.27 to 5.4, 0.06 to 1.57 and 0.48 to 1.98 mg/l during high tide, and 0.41 to 2.75, 0.1 to 1.61 and 0.79 to 1.63 mg/l during low tide over pre-monsoon, monsoon and post-monsoon seasons, respectively. During high tide, the highest PO4-P contents 4.44 mg/l was found at S1 in pre- monsoon than 1.27 at S4 and 1.57 at S5 both in post- monsoon season, and lowest PO4-P content 0.28 mg/l was found at S3 in monsoon than 0.36 at S5 and 0.39 at S2 both in monsoon season (Figure 5).
5 Pre monsoon
PO4–P (mg/l)
Monsoon
Post Monsoon
3 Pre monsoon
$$ = \frac {1}{2} \times 1 0 ^ {4} $$
$$ = 1 0 0 $$
PO4–P (mg/l)
2.5 Monsoon
Post Monsoon
$$ = 1 0 0 0 0 0 0 0 0 0 0 0 0 0 0 0 0 0 0 0 0 0 0 0 0 0 0 0 0 0 0 0 0 0 0 0 0 0 0 0 0 0 0 0 0 0 0 0 0 0 0 0 $$
Sulfate (SO4): The SO4 contents were ranged from 119 to 272, 30 to 90, 32 to 130 mg/l with mean contents 187.8, 53.19 and 76.87 mg/l were found during high tide in pre- monsoon, monsoon and post-monsoon, respectively. During high tide the highest 264 mg/l at S2 and the lowest 40 mg/l at both S3 and S1 were found in pre- monsoon, and both monsoon and post-monsoon season, respectively. In high tide, the SO4 values at maximum sampling stations were between suitable range during monsoon season which were found slightly increased during post-monsoon and highly increased during pre- monsoon (Figure 7). The SO4 contents were ranged from
69 to 179, 20 to 80, 60 to 130 mg/l with mean contents 135.4, 45.8 and 95.73 mg/l were found during low tide over pre-monsoon, monsoon and post-monsoon, respectively. During low tide, the highest 176 mg/l and the lowest 31 mg/l were found at S3 in pre monsoon and at S5 in monsoon period, respectively. In low tide, the SO4 values at maximum sampling stations were between suitable range during monsoon season which were found moderately higher during post monsoon and extremely higher during pre-monsoon (Figure 8).
300 $$ = \frac {1}{2} \times 1 0 ^ {4} $$
$$ = 1 0 0 $$
Pre monsoon
$$ = 1 0 0 0 0 0 0 0 0 0 0 0 0 0 0 0 0 0 0 0 0 0 0 0 0 0 0 0 0 0 0 0 0 0 0 0 0 0 0 0 0 0 0 0 0 0 0 0 0 0 0 0 $$ $$ = 1 0 0 0 0 0 0 0 0 0 0 0 0 0 0 0 0 0 0 0 0 0 0 0 0 0 0 0 0 0 0 0 0 0 0 0 0 0 0 0 0 0 0 0 0 0 0 0 0 0 0 0 $$ Monsoon Post Monsoon
Chlorophyll a: The concentrations of chlorophyll a were ranged from 0.611 to 0.840, 0.217 to 1.168 and 0.180 to 1.75 mg/l during high tide, and 0.638 to 0.883, 0.218 to 1.189 and 0.69 to 1.88 mg/l during low tide over pre- monsoon, monsoon and post-monsoon season, respectively. During high tide, the highest 1.29 mg/l and the lowest 0.345 mg/l were found at S1 in post-monsoon and at S3 in monsoon seasons, respectively (Figure 9). In high tide the chlorophyll a concentrations 0.345 mg/l at S3 during monsoon and 0.52 mg/l at S2 during post- monsoon, were found similar to the standard range. During low tide, the highest 1.58 and the lowest 0.464 mg/l were found at S4 in post-monsoon and S2 in monsoon seasons, respectively (Figure 10). In low tide the
| Pre monsoon | Monsoon | Post Monsoon |
| 150 | 40 | 30 |
| 135 | 35 | 45 |
| 75 | 45 | 75 |
| 135 | 75 | 35 |
| 175 | 35 | 95 |
Table 2: Seasonal and tidal dynamics of temperature, pH and DO in Sundarbans water.
during high tide, and 0.789, 0.649 and 1.428 mg/l during low tide over the pre-monsoon, monsoon and post- monsoon seasons, respectively.
1.4 Pre monsoon
Monsoon
Post Monsoon
$$ = \frac {1}{2} \times 1 0 ^ {4} $$
$$ = 1 0 0 $$
1 1.2 1.4 1.6 1.8 Pre monsoon Chlorophyll a (mg/l) $$ = 1 0 0 0 0 0 0 0 0 0 0 0 0 0 0 0 0 0 0 0 0 0 0 0 0 0 0 0 0 0 0 0 0 0 0 0 0 0 0 0 0 0 0 0 0 0 0 0 0 0 0 0 $$ Monsoon Post Monsoon
Variation of temperature from pre monsoon to monsoon season (25.66 to 22.37 at S1, 28.47 to 23.63 at S3, 28.43 to 24.13ºC at S4) in both tides were observed during the study period, whereas a slight variation was found from high tide to low tide over maximum stations such as 22.37 to 23.90 at S2, 23.63 to 24.13ºC at S3 (Table 2). The pH ranged from 7.82 to 8.55 and 8.2 to 8.66 over
| Stations | Season | Temperature (ºC) | pH | DO (mg/l) | ||||||||||||||
|---|---|---|---|---|---|---|---|---|---|---|---|---|---|---|---|---|---|---|
| H.T. | L.T. | H.T. | L.T. | H.T. | L.T. | |||||||||||||
| S1 | Pre-monsoon | 25.66±0.06 | 28.17±0.06 | 8.47±0.06 | 8.38±0.18 | 11.00±1.0 | 10.13±1.18 | |||||||||||
| Monsoon | 22.37±0.06 | 24.23±0.06 | 8.4±0.2 | 8.31±0.16 | 9.54±1.16 | 11.01±1.51 | ||||||||||||
| Post-monsoon | 24.73±0.25 | 24.73±0.06 | 8.41±0.14 | 8.49±0.19 | 11.87±1.51 | 10.8±1.42 | ||||||||||||
| S2 | Pre-monsoon | 25.63±0.06 | 26.57±0.15 | 8.49±0.05 | 8.61±0.10 | 10.3±1.13 | 9.79±0.42 | |||||||||||
| Monsoon | 22.37±0.06 | 23.9±0.17 | 8.16±0.16 | 8.25±0.13 | 9.27±1.33 | 9.79±1.21 | ||||||||||||
| Post-monsoon | 24.43±0.32 | 24.83±0.12 | 8.23±0.24 | 8.66±0.05 | 10.38±1.73 | 9.54±0.56 | ||||||||||||
| S3 | Pre-monsoon | 28.47±0.25 | 26.4±0.10 | 8.06±0.25 | 8.6±0.05 | 8.52±0.62 | 10.87±0.41 | |||||||||||
| Monsoon | 23.63±0.59 | 24.13±0.06 | 7.82±0.19 | 8.32±0.2 | 8.12±0.31 | 11.14±0.65 | ||||||||||||
| Post-monsoon | 24.6±0.10 | 24.57±0.25 | 8.55±0.07 | 8.59±0.12 | 10.29±2.2 | 8.93±0.25 | ||||||||||||
| S4 | Pre-monsoon | 28.43±0.06 | 25.57±0.21 | 8.39±0.04 | 8.52±0.03 | 8.99±1.48 | 8.79±1.67 | |||||||||||
| Monsoon | 24.13±0.06 | 24.17±0.06 | 8.4±0.2 | 8.2±0.22 | 9.14±0.66 | 9.26±0.53 | ||||||||||||
| Post-monsoon | 24.4±0.26 | 24.57±0.23 | 8.34±0.26 | 8.6±0.07 | 9.77±1.19 | 10.95±2.22 | ||||||||||||
| S5 | Pre-monsoon | 28.06±0.06 | 25.6±0.10 | 8.33±0.15 | 8.49±0.07 | 10.4±0.50 | 9.39±1.56 | |||||||||||
| Monsoon | 24.23±0.06 | 24.23±0.12 | 8.45±0.23 | 8.38±0.22 | 11.46±1.09 | 10.87±1.57 | ||||||||||||
| Post-monsoon | 24.7±0.30 | 24.37±0.47 | 8.52±0.14 | 8.52±0.16 | 10.68±2.23 | 11.34±2.65 |
Table 3: Seasonal and tidal dynamics of temperature, pH and DO in Sundarbans water.
| Stations | Season | Salinity (‰) | EC (µs/cm) | TDS (ppm) | ||||||||||||||
|---|---|---|---|---|---|---|---|---|---|---|---|---|---|---|---|---|---|---|
| H.T. | L.T. | H.T. | L.T. | H.T. | L.T. | |||||||||||||
| S1 | Pre monsoon | 0.14±0.01 | 0.13±0.02 | 839±97.92 | 446.33±101.1 | 740.67±95.2 | 423.33±70.5 | |||||||||||
| Monsoon | 0.12±0.01 | 0.13±0.03 | 745.67±36.4 | 343.33±319.3 | 470.33±52.5 | 258.67±14.3 | ||||||||||||
| Post monsoon | 0.19±0.04 | 0.19±0.03 | 1757.33±13.2 | 1758.33±17.7 | 1198.33±23.4 | 1369±42.3 | ||||||||||||
| S2 | Pre monsoon | 0.15±0.01 | 0.16±0.01 | 1012.67±235.1 | 558±285.7 | 853.33±214.9 | 647.67±103.3 | |||||||||||
| Monsoon | 0.11±0.09 | 0.14±0.05 | 763.33±27.65 | 345.67±390.4 | 498±30.12 | 221.67±13.32 | ||||||||||||
| Post monsoon | 0.27±0.08 | 0.19±0.02 | 1754.67±26.7 | 1758.33±49.7 | 1157±22.34 | 1431±27.73 | ||||||||||||
| S3 | Pre monsoon | 0.15±0.02 | 0.17±0.02 | 848.67±87.2 | 3241.33±583.3 | 864±97.55 | 2171±451.7 | |||||||||||
| Monsoon | 0.12±0.02 | 0.15±0.05 | 751.33±34.3 | 2755.33±19.4 | 317±18.19 | 2191.67±24.34 | ||||||||||||
| Post monsoon | 0.19±0.03 | 0.26±0.04 | 1730.67±4.9 | 1718.67±28.9 | 1389.33±11 | 1358.33±29.77 | ||||||||||||
| S4 | Pre monsoon | 0.21±0.04 | 0.19±0.01 | 2582.33±624.3 | 2614.67±622.1 | 1892.33±104.9 | 2664±121.01 | |||||||||||
| Monsoon | 0.14±0.05 | 0.12±0.03 | 2404.67±586.4 | 2768±19.47 | 1520.67±303.5 | 2220.67±25.77 | ||||||||||||
| Post monsoon | 0.32±0.05 | 0.28±0.04 | 1728.33±36.12 | 1721.33±21.83 | 1363±15.52 | 1381±9.54 | ||||||||||||
| S5 | Pre monsoon | 0.19±0.02 | 0.18±0.02 | 2716.33±312.8 | 2867.33±560.8 | 3239.67±195.9 | 3158.33±295.3 | |||||||||||
| Monsoon | 0.14±0.02 | 0.13±0.01 | 2749.33±6.11 | 2763.33±5.51 | 2135.67±68.04 | 2108±73.57 | ||||||||||||
| Post monsoon | 0.22±0.03 | 0.25±0.06 | 1759.33±34.79 | 1758.33±25.54 | 1348±7.55 | 1317.67±70.23 |
Table 4: Seasonal and tidal dynamics of salinity, EC and TDS in Sundarbans water.
Seasonal and Tidal Dynamics of Nutrients and Chlorophyll a in Water
The NH3-N contents were ranged from 0.002 to 0.06 and 0.02 to 0.177 mg/l at all sampling stations over three seasons during high and low tide, respectively (Table 4). From S1 to S5, NO3-N contents showed a highly difference between high and low tide both pre-monsoon and post- monsoon. In post-monsoon, NO3-N contents were showed slightly changed between two tides at all stations (Table
4). In all stations, PO4-P were found very higher than the suitable range (0.005 to 0.2 mg/l) during both tides at pre monsoon and monsoon season. In monsoon season, PO4-P were found higher during both tides but they were remain lower than the two remaing seasons (Table 4).
| Station | Season | NH -N (mg/l) 3 | NO -N (mg/l) 3 | PO -P (mg/l) 4 | |||||||||||||||
|---|---|---|---|---|---|---|---|---|---|---|---|---|---|---|---|---|---|---|---|
| H.T. | L.T. | H.T. | L.T. | H.T. | L.T. | ||||||||||||||
| S1 | Pre monsoon | 0.035±0.1 | 0.037±0.1 | 8.87±2.2 | 10.4±0.6 | 4.44±0.9 | 2.48±0.3 | ||||||||||||
| Monsoon | 0.037±0.02 | 0.043±0.02 | 15.3±4.9 | 14.9±8.93 | 0.81±0.7 | 0.48±0.2 | |||||||||||||
| Post monsoon | 0.05±0.01 | 0.05±0.02 | 27.33±20.5 | 31.67±13.9 | 0.67±0.2 | 1.1±0.3 | |||||||||||||
| S2 | Pre monsoon | 0.002±0.001 | 0.087±0.01 | 11.47±0.46 | 7.8±1.5 | 0.36±0.05 | 0.55±0.04 | ||||||||||||
| Monsoon | 0.027±0.02 | 0.023±0.02 | 21.23±3.73 | 9.57±8.44 | 0.39±0.14 | 0.74±0.8 | |||||||||||||
| Post monsoon | 0.06±0.03 | 0.06±0.02 | 10.33±6.81 | 18.33±6.51 | 0.69±0.17 | 1.2±0.13 | |||||||||||||
| S3 | Pre monsoon | 0.057±0.02 | 0.177±0.19 | 9.7±2.46 | 8.6±1.47 | 0.46±0.09 | 0.49±0.1 | ||||||||||||
| Monsoon | 0.05±0.01 | 0.033±0.02 | 19.9±6.65 | 18.2±6.1 | 0.28±0.2 | 0.50±0.11 | |||||||||||||
| Post monsoon | 0.05±0.03 | 0.05±0.02 | 31.67±7.64 | 31.33±4.04 | 0.84±0.1 | 1.11±0.1 | |||||||||||||
| S4 | Pre monsoon | 0.057±0.03 | 0.073±0.02 | 7.23±3.4 | 8.63±1.69 | 0.46±0.1 | 0.62±0.13 | ||||||||||||
| Monsoon | 0.043±0.03 | 0.043±0.02 | 22.9±2.7 | 17.9±2.61 | 0.79±0.43 | 0.15±0.1 | |||||||||||||
| Post monsoon | 0.04±0.02 | 0.06±0.03 | 26±14.18 | 19.67±6.66 | 1.27±0.25 | 1.31±0.5 | |||||||||||||
| S5 | Pre monsoon | 0.024±0.02 | 0.02±0.02 | 10.13±2.02 | 11.23±0.91 | 0.92±0.12 | 0.6±0.04 | ||||||||||||
| Monsoon | 0.03±0.01 | 0.03±0.02 | 16.03±7.02 | 25.47±2.57 | 0.36±0.1 | 0.26±0.1 | |||||||||||||
| Post monsoon | 0.06±0.03 | 0.04±0.02 | 17.67±6.5 | 15±5 | 1.57±0.5 | 1.03±0.21 |
Table 5: Seasonal and tidal dynamics of ammonia, nitrate and phosphate in Sundarbans water.
| Station | Season | SO (mg/l) 4 | Chlorophyll a (mg/l) | ||||||||||
|---|---|---|---|---|---|---|---|---|---|---|---|---|---|
| H.T. | L.T. | H.T. | L.T. | ||||||||||
| S1 | Pre monsoon | 153±17.06 | 159±12.12 | 153±17.06 | 159±12.12 | ||||||||
| Monsoon | 40.67±11.02 | 41.33±6.51 | 40.67±11.02 | 41.33±6.51 | |||||||||
| Post monsoon | 40±12.17 | 90±26.46 | 40±12.17 | 90±26.46 | |||||||||
| S2 | Pre monsoon | 264±8 | 136±9.64 | 264±8 | 136±9.64 | ||||||||
| Monsoon | 48.67±12.06 | 35±15.13 | 48.67±12.06 | 35±15.13 | |||||||||
| Post monsoon | 83.33±40.41 | 86.33±25.79 | 83.33±40.41 | 86.33±25.79 | |||||||||
| S3 | Pre monsoon | 198±16.37 | 76±7 | 198±16.37 | 76±7 | ||||||||
| Monsoon | 40±9.17 | 46±7.94 | 40±9.17 | 46±7.94 | |||||||||
| Post monsoon | 99±29.21 | 111.33±16.44 | 99±29.21 | 111.33±16.44 | |||||||||
| S4 | Pre monsoon | 192±18.73 | 135±13.08 | 192±18.73 | 135±13.08 | ||||||||
| Monsoon | 79.33±9.02 | 75.67±5.13 | 79.33±9.02 | 75.67±5.13 | |||||||||
| Post monsoon | 82±11.27 | 102.67±13.01 | 82±11.27 | 102.67±13.01 | |||||||||
| S5 | Pre monsoon | 132±11.36 | 171±8 | 132±11.36 | 171±8 | ||||||||
| Monsoon | 57.33±29.69 | 31±10.15 | 57.33±29.69 | 31±10.15 | |||||||||
| Post monsoon | 80±36.06 | 88.33±20.79 | 80±36.06 | 88.33±20.79 |
Table 6: Seasonal and tidal dynamics of sulfate and Chlorophyll a contents in Sundarbans water.
Conclusion
Nutrients balance of the Sundarbans mangrove ecosystem was influenced by the tidal cycle and seasonal variations as revealed by the changes in water nutrients and chlorophyll a in different seasons. The effect of tidal amplitude was important in determining in the extent of variations in nutrient and chlorophyll a concentrations. Water quality of Pasur river and Koromjol canal during different tides and seasons has impact on the nutrients and chlorophyll a concentrations. The upstream and downstream flowing of water, fluctuations of tides and different seasons have greater impact on water quality of mangrove ecosystem. As a result, major nutrients and chlorophyll a concentrations in river water could have some effects on aquatic ecosystem in the Sundarbans mangrove.
References
-
Rahaman SMB, Sarder L, Rahaman MS, Ghosh AK, Biswas SK, et al. (2013) Nutrient dynamics in the Sundarbans mangrove estuarine system of Bangladesh under different weather and tidal cycles. Ecological Processes 2(29): 1-13.
-
Hossain MI, Nabi MR, Ansari MNA, Latif A, Mahmud MR, et al. (2016) Ecosystem services of the world largest mangrove forest Sundarbans in Bangladesh. Int J Innovation Scientific Res 27(1): 9-15.
-
Senthilkumar B, Purvaja R, Ramesh R (2008) Seasonal and tidal dynamics of nutrients and chlorophyll _a_ in tropical mangrove estuary, southeast coast of India. Indian J Marine Sci 37(2): 132-140.
-
Hoq ME, Wahab MA, Islam MN (2006) Hydrographic status of Sundarbans mangrove, Bangladesh with special reference to post-larvae and juveniles fish and shrimp abundance. Wetlands Ecological Management 14(1): 79-93.
-
Rahman MM, Rahman MT, Rahaman MS, Rahman F, Ahmad JU, et al. (2013) Water quality of the world’s largest mangrove forest. Canadian Chemical Transactions 1(2): 141-156.
-
Akhter M, Reza MS, Jamil AHMN, Uddin MN (2018) Assessment of water quality and seasonal variations based on aquatic biodiversity of Sundarbans mangrove forest, Bangladesh. IOSR J Biotechnol Biochem 8(1): 109.
-
Kathiresan K, Bingham BL (2001) Biology of mangroves and mangrove ecosystems. Advances in Marine Biology 40: 81‐251.
-
Islam MS, Kabir MH, Sifat SA, Meghla NT, Tusher TR (2014) Status of water quality from the Padma river at Bheramara point of Kushtia in Bangladesh. Bangladesh Journal of Environmental Science 27: 110-115.
-
Rahman F, Rahman MT, Rahman MS, Ahmad J (2014) Organic production of Koromjol, Passur river system of the Sundarbans, Bangladesh. Asian J Water Environ Pollution 11(1): 95-103.
-
MCPA (Minnesota Pollution Control Agency) (2008) Nutrients: phosphorus, nitrogen sources, impact on water quality- a general overview. Water quality/ impaired waters # 3.22.
-
Islam MS, Shil SC, Kabir MH, Hoq ME (2017) Investigation of heavy metal contamination in fishes from Passur river near the Sundarbans mangroves of Bangladesh. J Environ Sci Natural Res 10(1): 21-24.
-
Moreno-Casas PA, Aral H, Sadus AV (2009) Environmental impact and toxicology of sulphate. _In_: conference on enviromine, 2009, Santiago, Chile.
-
Suzuki JY, Bollivar DW, Bauer CE (1997) Genetic analysis of chlorophyll _a_ biosynthesis. Annual Review Genetics 31(1): 61-89.
-
Islam MS, Imran MH, Rimu SH, Kabir MH, Suravi (2019) Water quality monitoring of aquaculture hatchery in Mymensingh region of Bangladesh. J Environ Sci Natural Res 36: 15-22.
-
Haque MI (2008) Water Resource Management in Bangladesh. Anushilan, Chuadanga and Dhaka, 24-84 pp.
-
EPA (Environmental Protection Agency) (2007) _Water quality standards handbook._ EPA office of water science and technology, Washington DC.
-
Kumar K, Kumara V (2011) Avifaunal diversity of mangrove ecosystem, Kundapura, Udupi district, Karnataka, India. Recent Res Sci Technol 3(10): 103- 110.
-
Ramamurthy K, Radhika A, Kavitha A, Raveendran S (2012) Physicochemical analysis of soil and water of Vedaranyam mangrove forest, Tamil Nadu, India. Int J Advanced Life Sci 3(1): 65-71.
-
Sarkar S, Ghosh PB, Das TM, Som MS, Saha T (2013) Environmental assessment in terms of salinity distribution in the tropical mangrove forest of Sundarban, northeast coast of Bay of Bengal, India. Archives Appl Sci Res 5(6): 109-118.
-
IWM (Institute of Water Modeling) (2003) Water quality of mangrove forest, Bangladesh.
-
DoE (Department of Environment) (1991) Ministry of Environment and Forest. Peoples Republic of Bangladesh.
- Lessons to Learn: Trees are More than the Lungs of the World
- Community Forestry Enterprises as a Model for Sustainable Forest Development: The Case Of The "Baja Tarahumara" in Chihuahua, Mexico
- Ecological and Socio-Economic Impacts of Chromolaena odorata and Mesosphaerum suaveolens, Two Invasive Alien Species in Central and Southern Benin, West Africa
- Epigenetic Sustainability: Modeling the Human Factor as a Natural Resource through Science 4.0 and the NR3C1 Biological Pilot
- Growth-at-Risk: A Framework for Assessing Economic Vulnerability
- The Rural Territory as a Socioecological System for the Management of Public Policy for Sustainable Rural Development