Pilot Review Study on Yield Gaps and Cost Benefits of Different Sized Seeds of Bread Wheat (Triticum aestivum L.) Varieties
The main goal of this systematic pilot study is to determine the best plant population rate of bread wheat crop by identifying the most cost-effective varieties depending on their seed size in order to deliver an overview of some other bread wheat production management requirements in general and specifically in Ethiopia, comparing with current research trends as well as to make the appropriate seed rate recommendations for small, medium and large sized seeds reliant varieties, for better yield efficiency, grain quality and cost-effective benefits of bread wheat crop. This paper studied the proper application of the optimum plant-population’s reliant seeding rate under ideal environment availability of which may help in improving the yield capacity gaps by identifying the most cost-effective variety from so far conducted seed rate experiments depending on their seed size of bread wheat varieties. To optimize the plant-population’s dependent seed rate of wheat, some experiments have conducted so far across most wheat growing areas of Ethiopia. The field experiments were conducted in different times at Kulumsa Agricultural Research Center from July to November 2012. Quite similar field experiment was also conducted at Kulumsa Agricultural Research Center from June to 2018 cropping season, Three bread wheat varieties (Hidassie, Dendea and Shorima) representing different seed sizes of large, medium, small, respectively and four plant population levels of 250, 300, 350 & 400 plants m-2 were tested. The interaction effects of varieties seed size and plant population on grain yield showed statistically significant (p
Introduction
Ethiopia is the largest wheat producer in sub-Saharan Africa with a record harvest of 4.6 million metric tons registered in 2017 [1]. However, during that same year, the country imported 1.5 million tons of wheat, corresponding to a value of around US$600 million [1]. Further increases in demand for wheat and other cereals, due to population growth and dietary changes [2], are projected to put additional pressure on the national treasury, making the national economy vulnerable to cereal price volatility in world markets. These drivers have put wheat self-sufficiency high on the agenda, with a new initiative of the Ethiopian government targeting self-sufficiency in wheat in the coming few years.
The government of Ethiopia recently announced that the country has a self-sufficiency plan in wheat production by 2022. Bread Wheat (Triticum aestivum L.) yields in Ethiopia need to improvement significantly to diminish import reliance and keep up with the normal increase in population and dietary changes. In spite of the yield growth rate observed in recent years, bread wheat yield gaps remain large. Here, we decompose wheat yield gaps in Ethiopia into efficiency, resource, and technology yield gaps and relate those yield gaps to broader farming systems aspects [3].
Its production is highly concentrated between the latitudes of 30o and 60o N, and 27o to 40o S and within the temperature range of 3oC to 32oC [4]. Bread wheat is an important cool weather crop grown predominantly in the Ethiopian highlands at optimum altitude ranging from 1000 to 2300 meters above sea level. Ethiopia is also the largest wheat producer in Sub-Saharan Africa and bread wheat is the major cereal crops in the Ethiopian highlands, which range between 6 and 160N, 35 and 420E and 1500 to 2800 m. At national level, during 2015/16, cropping season 1,664,564.62 ha, of land was covered by bread wheat and durum wheat and producing 42192572.23 metric tons [5].
Presently at the national level about 1,747,939.31 ha of land is covered by durum and bread wheat and over 4,838,074.09 metric tons yield is produced from this land annually [6]. It is obvious that bread wheat is one of the main commodity crops known worldwide with respect to its production and economic value which requires good production and management practices. Despite its importance and increased production, bread wheat yield and its quality is affected by various biotic and abiotic stresses, among which low or excess mineral nutrition, irrigation schedule or rainfall are among the major ones [7, 8].
Cultivated wheat is classified into two major types; the hexaploid bread wheat (2n = 6x = 42, AABBDD) and the tetraploid durum wheat (2n = 4x = 28, AABB) [9]. Currently, at the global level, bread wheat accounts for 95% of all the wheat produced. Based on growth habit, wheat is classified into spring wheat and facultative/winter wheat, covering about 65 and 35% of the total global wheat production area, respectively [10, 11]. Bread wheat crop has a thin root system and needs optimum and regular application of water and nutrients.
Cropping season and soil moisture may affect the quality and yield of field crops any plants; low moisture conditions in the soil are conducive to poor yields [12], while excessive soil moisture results in wastage of irrigation water, nutrients leaching, and may lead to rots and poor seed quality. The crop yields varied considerably among sites and among production seasons at the same site. These variations were probably due to soil, cropping season, amount and type of nutrients available, planting date, degree of plant population and other differences in cultural practices. So far, many varieties of bread and durum wheat have been developed to satisfy the growing production demands and as a result, about 76 bread wheat and 34 durum wheat varieties have been released [5]. Despite the large area cultivated for wheat, the national average yield of wheat in Ethiopia is about 2.768 metric tons ha-1 [6].
This is certainly lower than the world’s average yield which is about 3.320 metric tons ha-1 [13]. The number of productive tillers is dependent on varieties and environment and strongly influenced by planting population. However, tillering capacity is increased with enough moisture availability, increasing light and optimum nitrogen availability during the vegetative phase and it depends greatly upon varieties [14]. Seed rate is one of the most important agronomic factors which need great emphasis for maximum yield of crops. High seed rate increases the competition among crops for common resource particularly water, nutrients and sunlight which result in low quality and low yield.
Also, Hameed reported that the use of low seed rate leads to low yield due to lesser number of plants per unit area. However, Baloch MS [15], reported lower seed rates significantly increased the number of fertile tillers produced per plant which do have pronounced effect on yield of varieties. Besides its yield impact, sowing at a seed rate that result in optimal plant population may also reduce seed costs, lodging & disease problems which add up extra value in crop production process. A number of bread wheat varieties differing in their seed size, height and maturity as well as tillering capacity have been developed in Ethiopia.
However, the recommended seed rate for all the varieties being used across the country is 150 kg ha-1 [14].
Likewise, around the study area there is a trend by farmers to use higher plant population of seed rates for both of small and large sized bread wheat varieties (own observation). According to the research result of A. Zareian L [16], seed size had a significant impact on all of measured traits with the exception of thousand seeds weight. Results indicated that number of seeds per spike significantly decreased by increasing seed size. The other traits showed significant increase by increasing seed size. Varieties seed size had significant effect on thousand seeds weight, but other traits were similar among varieties. This study is done to find out the best suitable and cost-effective combination of plant population rate and size of seeds for bread wheat (Triticum aestivum L.) varieties. Outcomes of this study will directly be helpful to local farmers and producers. In view of that, it is essential to determine the optimum plant population rates for different seed sized bread wheat varieties in order to improve the production and productivity of the crop by identifying the most cost-effective varieties and profitable plant population rates with low cost of production inputs. Thus, for this study, three recently released bread wheat varieties namely (Hidassie, Dendea and Shorima) representing standard categorization of seed sizes as small (Shorima), medium (Dendea) and large (Hidassie) with plant population rates of 250, 300, 350 and 400 plants m-2 were selected and tested to attain the intended objectives.
Body of Discussion
Historical Evolutionary Processes of Bread Wheat Crop
The process, which began some ten thousand years ago, involved the following major steps. Wild einkorn (T.urartu) crossed spontaneously with Goat grass 1 (Aegilops speltoides) to produce Wild Emmer (T. dicoccoides;) further hybridizations with another Aegilops (A. taushi), gave rise to Spelt (T. spelta) and early forms of Durum Wheat (cultivated emmer); Bread Wheat (T. aestivum) finally evolved through years of cultivation in the southern Caspian plains. This evolution was accelerated by an expanding geographical range of cultivation and by human selection, and had produced bread wheat as early as the sixth millennium BC. Modern varieties are selections caused by natural mutation starting with emmer wheat up to husk less modern wheat [17].
It is considerably believed that T. monoccocum naturally hybridized with the yet unknown B-genome donor to give rise to the tetraploid emmer group. Emmer wheat in turn hybridized with Ae. squarossa and a spontaneous chromosome doubling of the triploid resulted in the formation of hexaploid wheat [17]. The other forms, such as T. durum, T. turgidum and T. polonicum might have originated from cultivated emmer through mutation or accumulation of mutations that reduced the toughness of the glumes to a point at which free- threshing was attained. At the tetraploid level, two main species have been recognized; T. timopheevi (AAGG) and T. turgidum (AABB). T. durum belongs to the latter group. There are many known wild and cultivated species in the genus Triticum. However, the principal wheat’s of commercial importance are T. aestivum and T. durum [18].
Overview of Bread Wheat Production and its Importance
Bread wheat is the leading grain and most important food crop in anywhere in the world. Its importance was derived from the properties of its gluten, a cohesive network of touch endosperm proteins that stretch with the expansion of fermenting dough, yet coagulates and holds together when heated to produce a risen loaf of bread. Only wheat, and to a lesser extent rye and triticale, have this property. It is utilized for making bread, flour confectionery products (cakes, cookies, and pretzels), unleavened bread, semolina, bulgur, and breakfast cereals. Its diversity of uses, nutritive content, and storage qualities has made wheat a stable food for more than one-third of the world’s population
Bread Wheat Production Status in Ethiopia
Ethiopia is one of the principal producers of wheat in East Africa. Wheat is one of the major cereal crops in the Ethiopian highlands, which range between 6 and 16°N, 35 and 42°E, and from 1500 to 2800 m. At present, wheat is produced solely under rain fed conditions. It is produced mainly in the southeast, northwest and central parts of Ethiopia. Minor amount is also produced in the rest of the south and northern regions [5]. At the national level presently, 1,664,564.62 million ha of land is covered by bread & durum wheat and over 42,192.57 metric tons yield is produced from this land annually and recently-released bread wheat cultivars are highly responsive to improved management systems relative to older wheat lines. Its production is increasing rapidly due to both a high local demand, and the availability of high-yielding, input-responsive cultivars adapted to heterogeneous environmental conditions [19]. Area coverage of bread wheat has substantially expanded mainly by replacing unimproved, input non-responsive traditional cereal crops such as teff (Eragrostis Teff), durum wheat (T. Durum) and barley (Hordeum vulgare) [5].
![Figure 1: The national average yield Status of wheat production in Ethiopia from the year 1960-2012 GC. Source: USDA, http://www.indexmundi.com/agriculture/ According to the USDA [13] study reports on the earlier bread wheat research and grain yield status, Ethiopia is the largest bread wheat producer in sub-Saharan Africa with about 0.75 million ha of bread wheat and durum wheat. Bread wheat is one of the major cereal crops in the Ethiopian highlands, which range between 6 and 16°N, 35 and 42°E, from 1500 to 2800 m. Bread wheat is produced solely under rain fed conditions. About 60% of the wheat production area is covered by durum and 40% by bread wheat.](/fulltextimages/8211/fig_1.png)
Figure 1: The national average yield Status of wheat production in Ethiopia from the year 1960-2012 GC. Source: USDA, http://www.indexmundi.com/agriculture/ According to the USDA [13] study reports on the earlier bread wheat research and grain yield status, Ethiopia is the largest bread wheat producer in sub-Saharan Africa with about 0.75 million ha of bread wheat and durum wheat. Bread wheat is one of the major cereal crops in the Ethiopian highlands, which range between 6 and 16°N, 35 and 42°E, from 1500 to 2800 m. Bread wheat is produced solely under rain fed conditions. About 60% of the wheat production area is covered by durum and 40% by bread wheat.
Of the current total bread wheat production area, 75.5% is located in Arsi, Bale and Shewa regions. Forty-six percent of the 13 million ha classified as highly suitable for bread wheat production is located in Arsi and Shewa. The national wheat improvement program was organized most effectively from 1967-2012 [13]. The national average yield status of bread wheat production in Ethiopia during the 1960-2012 cropping years were showed in (Figure 1).
Present Bread Wheat Production and Existing Average Yield Statistics of Ethiopia
Bread wheat is one of Ethiopia’s main essential crop in terms of both production and consumption. Based on its role in the plant populations caloric intake, bread wheat is the second most important food in the country. [20]. Bread wheat is grown primarily in the highlands of Ethiopia, and the two main bread wheat producing regions (Oromia and Amhara) account for approximately 85% of national bread wheat production [21]. Even though bread wheat is typically grown by smallholder farmers in Ethiopia, the country is the largest bread wheat producer in Africa south of the Sahara by a sizable margin. Bread wheat production during the 2015/2016 Meher season was 4.1 million metric tons and has been growing significantly over time (rising by an average annual growth of 7.1 percent over the last two decades) due to both area expansion and yield improvements (Figure 2).
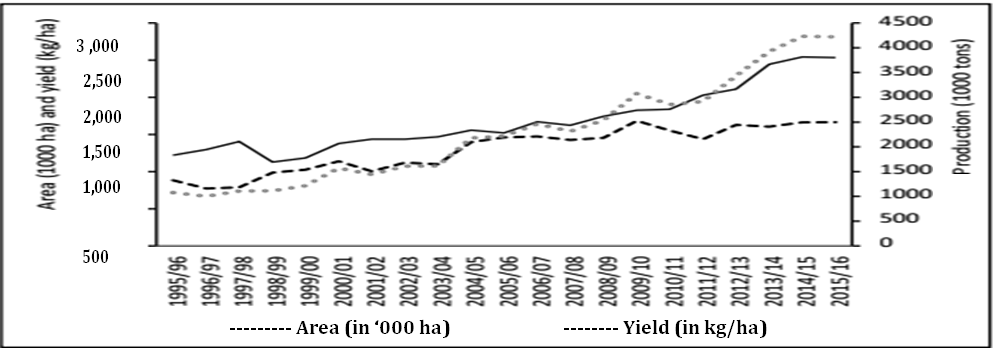
In terms of area, bread wheat is the fourth most widely grown crop in Ethiopia, after teff, maize, and sorghum. Today, approximately 1.7 million hectares of land are devoted to bread wheat crops that a significant increase from the less than one million hectares planted in bread wheat in 1996, representing an annual growth rate of 3.2 percent (Figure 2).
In addition, the country has increased its bread wheat yield by approximately 3.7 percent per year over the last two decades: Current bread wheat yields are roughly double the average bread wheat yields 20 years ago, implying that more than half of the growth in production since 1996 can be attributed to yield growth [20]. The amount of plants established from a given weight of seed based on the size of seeds and the percentage of those seeds that are viable and can grow into established plants.
Bread Wheat Yield Gaps Across Smallholder Farming Systems in Ethiopia
Wheat yields in Ethiopia need to increase considerably to reduce import dependency and keep up with the expected increase in population and dietary changes. Despite the yield progress observed in recent years, wheat yield gaps remain large. Here, we decompose wheat yield gaps in Ethiopia into production efficiency, effective resource, and technology yield gaps and relate those yield gaps to wider agri-business systems. Bread wheat yield capacity in farmers’ fields averaged 1.9 t ha−1. Most of the yield gap was attributed to the technology yield gap (> 50% of water-limited yield) but narrowing efficiency (ca. 10% of water-limited yield) and resource yield gaps (ca. 15% of water-limited yield) with current technologies can nearly double actual yields and contribute to achieve wheat self-sufficiency in Ethiopia. There were small differences in the relative contribution of the intermediate yield gaps to the overall yield gap across agro-ecological zones, administrative zones, and farming systems.
This is the first thorough yield gap decomposition for wheat in Ethiopia and our results suggest government policies aiming to increase wheat production should prioritize accessibility and affordability of inputs and dissemination of technologies that allow for precise use of these inputs. Increasing wheat yield in Ethiopia, through narrowing yield gaps, is important to reduce the import dependency for this crop while avoiding area expansion. This needs to occur in a smallholder agriculture setting as wheat is cultivated by approximately 4.2 million smallholders on ca. 1.7 million ha (Figure. 1) [1]. Currently, wheat is produced mostly under rain fed conditions and with relatively low inputs [22].
Yield gap analysis at regional level is useful to investigate the key factors limiting and reducing crop production in farmers’ fields [23, 24, 25]. Previous research concluded wheat yield gaps in West Arsi, one of the wheat belts in Ethiopia, can be largely attributed to technology yield gaps. This means that technologies currently used by farmers do not reach agronomic best practices and that considerably more and better use of inputs is needed if wheat yield gaps are to be narrowed [26, 27].
Importance of Bread Wheat Crop as Source of Income and Food Products
Bread wheat is not only the most important cereal crop in the world but also the major source of staple food for the peoples [28, 29]. Despite of being grown on larger area, average yield at farmers’ fields is still far below than the potential. Bread wheat is widely consumed, in the countries to meet the consumers demand for bread and other food products. This indicated that globally there is number of people who rely on wheat for a substantial part of their diet amounts to several billions. Statistics for the total volume of wheat which is consumed directly by humans as opposed to feeding livestock, for the United Kingdom indicates about one-third of the total production, approximately 5.7 m tones per annum are milled with home production.
Globally there is no doubt that the number of people who rely on wheat for a substantial part of their diet amounts to several billions [30]. The high content of starch, about 60–70% of the whole grain and 65–75% of white flour, means that wheat is often considered to be little more than a source of calories, and this is certainly true for animal feed production, with high-yielding, low-protein feed varieties being supplemented by other protein-rich crops, notably soybeans and oilseed residues. However, despite its relatively low protein content, usually 8–15% wheat still provides as much protein for human.
In general, wheat is the most widely used cereal for bread and bakery production process throughout the whole world [31, 32]. Pena-Bautista R [33] reported that, wheat-based foods are critical for food security and nutritional security worldwide. The global wheat researchers draw attention to the predicted upcoming food crisis, as populations in developing countries expand rapidly, especially in Africa and South Asia.
They note that population growth is likely to outpace yield gains in wheat and call for larger investments in wheat and other cereal crops to keep pace with future demand. As the demand increases because of rapid urbanization, climate change and the planting of same wheat varieties has also been affecting the productivity.
Ethiopia is the second largest producers of wheat next to South Africa in sub-Saharan Africa. Despite, Ethiopia is among the top producers in Africa, productivity is low due to this the country is forced to import wheat from abroad, to fill the demand. Wheat import has grown significantly from time to time this can lead the country to pay additional foreign currency.
Wheat yield has increased over the past decade. Recent estimates show that wheat farmers in Ethiopia produce on average 27q/ha [6]. Though the yield increased, it is not at its potential level when comparing with other countries .A range of factors can be reasons for low productivity when comparing with other countries. There are a lot of factors can be mentioned among these technology could play a more dominant role in productivity.
To fill agricultural technology gap, now days, the Ethiopian Institute of Agricultural Research (EIAR) remains the primary agricultural research agency took the responsibility for generation of agricultural technology [34]. In this regards, Kulumsa Agricultural Research Center is among the centers under EIAR which mandated for generation, demonstration and pre scaling up of improved bread wheat.
More than 100 of high yielding, disease resistant of bread and durum wheat varieties have been made realized and available with its recommended packages which is suitable for different agro ecologies of the country (MoANR), [5]. Despite the release of vibrant seed still challenged by disease particularly rust.
Effect of Varieties Seed Size on Growth of Bread Wheat Crop
Overall, seedling establishment is controlled by genetic makeup and environmental factors. Among the genetic factors are the genes expressed in the maternal parent affect seed growth and development in different ways, the genes that control seed size are expressed in the embryo during seed development, and the genes expressed in the seedling.
Different seed sizes of bread wheat varieties reflect a great extent to the amount of production costs, and as such it has a significant impact on early seedling growth and development [35, 36, 37]. The number of plants established from a given weight of seed depends on the size of the seeds and the percentage of those seeds that are viable and can grow into established plants.
The common range of wheat seed size is 25 to 50 mg and crop establishment varies between 40 and 95 percent of sown seeds depending on soil type, soil moisture, sowing depth, seed quality, diseases and insects. Considering these variables, a seed rate of 100 kg/ha could result in an established plant population that may vary up to three fold even in a drill sown crop [38]. As described by Mingsheng [38], 100 kg/ha sown by 90 germination percent of 25 mg seed size yielded 360 seeds m-2 compared to 100 kg/ha sown by 60 germination percent of 50 mg seed size which yielded 120 seeds m-2. The bread wheat crop sown with large sized seeds showed remarkably better agronomic performance with 95.29% germination, 96.61 cm plant height.
Grain Yield Effects of Plot-Level Plant- Population Reliant Seed Rates
Amongst others, appropriate plant-population determined by seed rates is one of the most significant agronomic practices for improving wheat yield by diminishing competition for minerals [39, 40, 41]. So far, bread wheat yield response to seed rate is inconsistent across spatial and temporal bases due to several biotic and abiotic factors. Ceterius Paribus, seed rate is an important yield determinant in bread wheat production. A better understanding of the relationship among seed rates and yield in bread wheat production could have vital importance in improving seeding rate recommendations according to specific agro-ecology, time-based, and bread wheat variety- related physiognomies [42, 43]. The use of the best quality seed may lead to lower gains if the recommended seed rates are not applied [44, 45]. The Ministry of Agriculture generally recommends a seed rate of 80–100 kilogram of seed per hectare. However, based on location-specific bread wheat variety trials conducted in the East Gojam zone, a seed rate of 100 to 150 kg ha-1 is recommended for Baso Liban and Debre Elias districts. However, farmers in the study area do not stick to the recommendation and use their own seed rates. The yield and yield effects of seed rates of the CBWS of the Ogolcho variety were evaluated when it was introduced in 2012 in the selected Farmers Training Centers (FTCs) in the two districts. Since then, the yield effect of farmer’s own plot level seed rates has never been empirically assessed. Therefore, exploring the effect of the plot level seed rates on wheat yield is an important objective of this study [44, 45, 46].
According to the survey study reports of Yirgalem E, Bamlaku A and Zewdie B [46], respondent farmers were classified into three groups for convenience of their study. The 1st group below-recommended seed rate and the group comprises farmers with a seed rate ranging from 50 to 99 kg ha-1 - 50 kg ha-1 being the lowest observed seeding rate. The 2nd group - recommended seed rate users group includes respondents with a seed rate ranging between 100–150 kg ha-1. The 3rd group - “above recommended” constitutes farmers with a seeding rate greater than 150 kg ha-1. The survey results showed that about 4.9%, 48%, and 47.1% of the respondents use seed rates below, above, and within the recommended seed rates, respectively (Table 1). This means that above 95% of the farmers in the study area use seed rates either above the recommendation or within the recommended seed rate ranges.
Normally, the farmers of the study area have used a seed rate of 194.4 kg ha-1 which is higher than what is recommended. A comparable result was also reported by Akalu Teshome and Ermias Abate [47], where they have reported an average seed rate of 264.56 kg ha-1, about 100 kilograms beyond more than what is recommended. Several studies also found the use of higher seed rates. Late seeding dates, planting methods, the need to reimburse for probable damages due to pests and animals, intents of grain yield boosting, and weed control are reported as some of the reasons for higher seed rates [48, 49].
These explanations for higher seed could also be adopted as reasons for the higher seed rates witnessed in this study. The Pearson’s correlation indicates a negative nexus between seed rate and hand weeding frequency (r = -0.5248, p = 0.05). This could be understood as that farmers reduce the seed rate for making frequent hand weeding easy and convenient. Likewise, farmers in the study area have in fact used lower seed rates due to observed high seed prices and insufficient supply of certified seeds. Though it is not viewed from the results of this study, studies showed many reasons that push farmers to use seed rates below what is recommended. For instance, superior agronomic practices such as row planting and transplanting reduce the seed rate required in crop production.
These practices do not only reduce seed rates but also allow more spacing among seedlings, permit easy weeding, reduce competition among seedlings and allow for better branching out (tillering) of crops [50, 51]. A good section of the respondents (48%) has used a seed rate above the recommendation.
The Pearson’s correlation indicates a positive nexus between the frequency of seed recycling and the amount of seed rate (r = 0.5534, p = 0.05). This implies that higher seed rates are associated with the frequency of seed recycling. The recycled seeds are cheaper than fresh and unrecycled CBWS that may encourage farmers to purchase and use more amounts of bread wheat seed. Several studies provided explanations as to why farmers use more seed rates. For instance, quite often late seeding dates cause higher seeding rates because a delay in sowing normally reduces individual plant growth and tiller production [48].
The result in this study does not portray a significant yield difference between farmers who use recommended and below recommended seed rates. The lowest average wheat productivity was associated with the farmers who apply seed rates above what is recommended. Respondents of the study were asked about the reasons for the higher seed rate they are applying.
Expected better yield gains associated with higher seed rates have been the most frequently reported reason for higher seed rates. The practice of using higher seed rates was reported in other studies too [22, 44, 48, 52]. These studies unfold that farmers usually use higher seed rates than what is recommended due to land scarcity, availability of credit markets for agricultural inputs, and access to markets.
Nevertheless not implied from the data gathered here, these same reasons could also explain the findings in this study. Similarly, farmers in LDCs prefer to use higher seed rates beyond what is recommended hoping that it will be a good strategy to control weeds and help them in coping with risks of crop production. High seed rate application beyond what is recommended is discouraged due to the negative consequences on seed quality such as seed size and weight [44, 53].
| Seed Rate Group | Obs. | Seed Rate (kg ha-1) | Productivity (Qt ha-1) | ||
|---|---|---|---|---|---|
| Mean | Std. Dev | Mean | Std.Dev | ||
| Below Recommended | 22(4.9) | 67.0455 | 11.9183 | 40.3636 | 3.8365 |
| Recommended | 212(47.1) | 133.9623 | 21.2714 | 40.3726 | 4.80499 |
| Above Recommended | 216(48) | 266.6667 | 93.3859 | 36.7361 | 6.2424 |
| Total | 450(100) | 194.3889 | 97.0926 | 38.62667 | 5.7883 |
Table 1: Spreading of average productivity across variable seed rates Note: Numerals in parenthesis are percentages. Source: (Yir
One can’t have a clear depiction of the yield effects of seed rate from the descriptive statistics presented above. The best analytical model to understand the effect of the amount application on response is the dose-response function based on the generalized linear regression model. This regression model produces such estimates more quickly.
However, the use of post estimation command such as margins plot in STATA enables to paint a clear depiction of the effect of the amount of seed on the response wheat yield per hectare. To ensure thus, the data gathered has been prescribed in six seed rate groups to include all observations within ± 50 kg ha-1 of the recommended seed rates. All
farmers that apply a seed rate of 50 kg ha-1 or below are categorized as the 1st group and the seed rate is calibrated as 50 kg ha-1 -50 kg ha-1 being the lowest seed rate [46].
The seed rates above 50 to 100 is calibrated as 100, while seed rates above 100 to 150, above 150 to 200, above 200 to 250, above 250 to 300, and above 300 have been calibrated as, 150, 200, 250, and 300 kg ha-1 , respectively. The regression coefficient is calculated using the generalized linear model to investigate the effect of the seed rate applied by farmers on wheat productivity. The result indicated that a 1-kilogram increase in seed rate is associated with a probability of 0.054 increases in wheat productivity. To go over the main points, Figure 3 below shows the relationship between plot level seed rate and yield in the study areas.
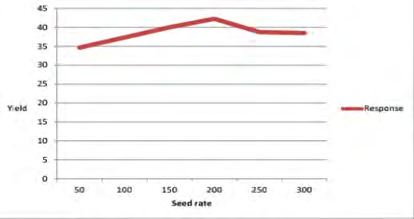
applied. Results of the analysis depicted that seed rates below what is recommended was associated with lower wheat productivity. Curiously, a seed rate of 200 kg ha-1 is associated with the highest average bread wheat production per hectare (4225 kg ha-1). It means that an extra 50 kg ha-1 application beyond the recommended seed rate is associated with higher productivity. This suggests that there might be a need to revise the seed rate recommendation for the study area. As presented in Table 2, an increase in the successive seed rate from 50 to 200 kg ha-1 is associated with an increase in wheat productivity. However, additional seed rates being applied beyond 200 kg ha-1 do not show an increasing effect on wheat productivity.
Rather productivity has started to decline after the 200 kg ha-1. Though the recommended seed rate in the study area has been between 100 to 150 kg ha-1, higher yield gains were reported for seed rates from 150 to 200 kg ha-1 [46]. This is in consent with other field-level experiments and survey results by different authors that reported increasing the seed rate of wheat from 100 to 200 kg ha-1 increased the grain yield and straw yields [50, 53] This study found that about 48% of the respondents reportedly used higher seed rates than what is recommended. Nevertheless, the seed rate is best when it is associated with the maximum grain yield. The economic theory of diminishing return to input has been proved from the findings of this study. The wheat yield hardly changes with additional units of seed rates once the maximum yield level has been achieved.
- (Yirgalem E, Bamlaku A and Zewdie B) [46].
- Further analysis has been carried out using predictive margins at the mean to investigate the magnitude of change in wheat productivity when the seed rate applied by the sample respondents increases from 50 kg ha-1 - the minimum seed rate reported to 300 kg ha-1 - the maximum seed rate
- This could be witnessed from the flatten curve after 200 kg ha-1 seed rates in Figure 1 above. Seed rates used above what is required to reach the flat part of the curve is money wasted that could have been used for other development expenditures [46].
- Seed Rate (kg)
- Delta-Method t p>|t|
- 95% Confidence Interval dydx
- Std. Err
- 50
- 34.635
- 0.37588
- 92.15
- 0.000
- 33.89965
- 35.37706
- 100
- 37.321
- 0.25025
- 149.13
- 0.000
- 36.82926
- 37.81289
- 150
- 40.004
- 0.25237
- 158.52
- 0.000
- 39.50783
- 40.49977
- 200
- 42.246
- 0.75394
- 56.03
- 0.000
- 40.76464
- 43.72809
- 250
- 38.733
- 0.37375
- 103.63
- 0.000
- 37.99811
- 39.46745
- 300
- 38.480
- 0.48983
- 78.56
- 0.000
- 37.51762
- 39.44294
Table 2: Marginal Effects of Different Seed Rates on Wheat YieldSource: (Yirgalem E, Bamlaku A and Zewdie B) [46].
The cost-benefit analysis has been used to assess the economic impact of the different varieties seed size like small, medium and large. The prevailing domestic market price has been adopted to calculate the costs and benefits of the varieties seed size. The cost-benefit analysis is concerned with two important issues. One is costs reduced in the production of goods and services.
The second is income increased as a result of the marketing of goods and services. In this study, the cost reduced as a result of plant-population rates depending on the varieties seed size made at the expense of using fresh and unrecycled certified seed has been calculated followed by the income gained as a result of using fresh and unrecycled certified seed at the expense of the plant-population level [4, 18, 46]. During the 2019/20 cropping season, the unit cost of 100 kg of certified unrecycled and recycled bread wheat seeds have been 2300 and 1800 Ethiopian Birr (ETB), respectively.
Farmers that used unrecycled and fresh certified seeds had a mean seed rate of 169.2835 Kg ha-1 against a mean seed rate of 263.6364 Kg ha-1 in a one-time recycled seed [46]. The cost reduction (CR) as a result of using a one-time recycled seed at the expense of unrecycled certified seed could be equated as follows CR= A1 * B2 C1 100 100 _Where, CR = is cost reduction as a result of seed recycling, A1 = Mean seed rate of the unrecycled seed, B2 = Cost of one-time recycled seeds, C1=Total seed cost of unrecycled seed Unrecycled certified seed users on average used a seed rate of 169.2835 kg ha-1 with a total seed cost of 3893.51 ETB. If unrecycled certified seed users have turned into use of the recycled seed, then the total seed cost would have been 3047.103 ETB. Following the formula above, it is clear that farmers can reduce their seed cost per hectare by 846.42 ETB by reverting from the use of unrecycled CBWS to a one-time recycled seed use. Thus, the economic rationale of farmers for seed recycling does hold water in terms of cost reduction. A study by Clayton GWS, Brandt EN, Johnson JT, O’Donovan KN [54] supports this finding.
These authors found that farmers in Canada try to reduce production costs without incurring large decreases in yield from their own saved seed from a current crop to use for next year’s planting and it is common practice with most cereal and pulse crops. There could be several explanations behind costs reduced as a result of using recycled seed. The first explanation is lower transaction costs. Unrecycled seeds could be purchased from nearby informal sources at local markets. As a result, no extra transportation costs are incurred. In addition to transaction costs, costs pertinent to chemical treatment, labeling, and packaging do not apply to recycled seeds. However, cost reduction alone is not a guarantee to an economically profitable agricultural business.
The economic gains as a result of using the other alternative of the unrecycled certified seed or the economic loss as a result of sticking to an old practice using the recycled seed are also critical. This calls for the need to calculate the net income gain of a crop enterprise. The next equation in the cost-benefit analysis is to check whether the economic gains
from seed recycling are better than unrecycled seed. The
income gained (IG) as a result of using unrecycled certified
seed at the expense of recycled seed is calculated using the
$$ \mathrm {I G} = \frac {\mathrm {D 2} * \mathrm {F 1}}{\mathrm {D 1}} - \mathrm {F 2} \mathrm {D 1} $$
Where, IG is income gained, D2 is the mean yield of recycled
seed, F1 is mean income from unrecycled seed, D1 is mean yield
of unrecycled seed, and F2 is mean income from the recycled
seed.
Following the formula above and based on the numerical figures presented in Appendix Table 2, the use of fresh & unrecycled CBWS has been associated with a higher yield (4044 kg ha-1 ) & higher market prices (1950 Ethiopian Birr). Similarly, a one-time seed recycling is associated with a lower yield (3333 kg ha-1) and market prices (1800 Ethiopian Birr). Thus, the average income per hectare given the price of a one-time recycled is 60,823.62 ETB. However, a farmer reverting to use fresh and unrecycled seed receive an annual income of 65,892.255 ETB per hectare. This means that the use of fresh and unrecycled CBWS leads to an economic gain of 5068.635 ETB than a one-time recycled seed. The net income per hectare associated with the use of unrecycled CBWS and a one-time recycled wheat seed has been 74968.58 ETB and 56078.16 ETB, respectively. This implies that the use of fresh and unrecycled CBWS ends up in a net income gain of 18890.42 ETB per hectare than a one- time recycled seed.
To go over the main points, the results of the cost-benefit analysis made clear that farmers can reduce their seed costs through seed recycling but their yields and net income can be best improved by using unrecycled CBWS. Several authors highly suggested that farmers should use unrecycled certified seeds as continuous recycling reduces crop yield ATA [44, 55, 56].
The finding in this study too is quite in agreement with these authors. On average, the mean productivity of unrecycled wheat seed users has been the highest. This highest wheat yield per hectare could be attributed to the yield superiority of the fresh and unrecycled wheat seed. As it can be learned from the above table, on average, a one- time and a twice seed recycling cause a 665 and 711 kg ha-1 wheat yield decline as compared to the unrecycled certified seed. Here it is commendable to state that the average yield difference among farmers who recycle once and twice was not conspicuous. This indicates the fact that the amount of yield loss as a result of recycling remains insignificant irrespective of recycling frequency. It signifies the need to heavily rely on fresh and unrecycled CBWS [55].
| Seed Recycling Frequency | Obs. | Productivity(Qt ha-1) | Seed Rate (kg ha-1) | ||
|---|---|---|---|---|---|
| Mean | Std. Dev | Mean | Std. Dev | ||
| Unrecycled | 328 | 40.4421 | 4.9718 | 169.2835 | 66.96013 |
| Recycled once | 110 | 33.7909 | 4.673 | 263.6364 | 129.0241 |
| Recycled twice and above | 12 | 33.3333 | 7.3278 | 245.8333 | 130.0495 |
| Total | 450 | 38.6267 | 5.7883 | 194.3889 | 97.09256 |
Table 3: Distribution of average productivity and seed recycling Source: Yirgalem Eshete, Bamlaku Alamirew and Zewdie Bishaw [46]
The Effect of Plant Population Rates on Crop Growth of Bread Wheat
Gafaar [57] reported that increasing plant population rate from 200 up to 400 grains per meter square in wheat crop significantly decreased the days to 50% of heading and days to 90% of maturity. Seed rate at a rate of 100 kg ha-1 shown early days to heading (72.32) followed by 125 kg ha-1 (72.94) and 150 kg ha-1 (73.57) [58].
Chaudhary [59] and Arif [60] reported that at the highest seeding population, the increased intra-plant competition may have also contributed to the reduction in plant height. Furthermore, Worku Awdie [61] revealed that increasing the levels of seeding rate decreased the days to heading and days to 90% of maturity dependably. The number of seedlings emerging does not only affect total crop yield, but the size of individual plant and the graded yields, time taken to reach maturity and uniformity of the plant at maturity [62].
Plants derived from large sized seeds appear to have greater vigour and are able to acquire a larger share of plant growth factors relative to plants derived from small sized seeds. As number of plants acre-1 increases, each plant captures less light, which limits each plant’s growth [63].
The Effect of Varieties Seed Size on Grain Yield Potential of Bread Wheat
The research results indicated significant influence of various seed sizes on grain yield. Grain yield with smallest seed size was significantly lower than other seed sizes and this reduction were 892.8 kg ha-1 by (16.9%) and 144.49 by (19.7%) respectively. Similar results were recorded by Stougaard, R.N. and Q. Xue, [63] who reported that use of larger seed sizes improved grain yields by 18% and the use of small seeds yield by 16% in wheat. On the other hand, the study findings of Tavassoli [64] showed that the effect of seed size on grain yield ha-1 4857.10 kg ha-1 grain yield.
The sown with large size seed was remarkably beneficial with most promising agronomic performance (4857.10 kg ha-1 grain yield) as compared to small size seeds (4400.70 kg ha-1 grain yield). Seed size is an important physical indicator of seed related to yield, market grade factors and harvest efficiency and important parameter, which influences the germination, growth and biomass of the nursery seedlings and that trend leads to the future crop. Kumar and Seth [65] observed that seed size affected the seed yield significantly.
Seed size was the trait that was most consistently associated with yields. Grain yield of bread wheat significantly increased by increasing seed size. Variation in seed size within a seed lot affected neither seedling emergence, plant fertility, nor grain yield per plot. Small seeded plants produced 2-44% less tiller grain yield than neighboring large-seeded plants. Grain yield with smallest size (2-2.2 mm) was significantly lower than larger seed sizes [66].
The Effect of Plant Populations on Grain Yield Potential of Bread Wheat
Increasing plant population rates up to 350 or 400 grains m-2 increased grain yield. According to research results of Jennifer [67], in solid bread wheat populations, grain yield was decreased due to competition between plants that induced self-regulation. His results of grain yield were mismatched with those of Hameed [68] and Ijaz [69], who reported that grain yield increased as seed rate increased.
Likewise, Jamal Abdulkerim [14] also reported that the bread wheat varieties Shorima and Kekeba offered the highest grain yield at a seed rate of 150 kg/ha and, variety Digalu produced maximum yield at seed rate of 175 kg ha-1 as compared to 100, 125, and 200 kg ha-1. The bread wheat crop sown with large sized seeds showed remarkably better agronomic performance of 6.40 tillers plant-1, 11.44 cm spike length, 42.65 grains spike-1, 42.80 g seed index (g), 10241 kg ha-1 biological yield. Plant population rates can impact on bread wheat grain yield [70].
Highest grain yield with maximum plant population rates was also reported by Olsen [71] and Haile [72]. In the same way, Chaudhary [59] and Arif [60] reported that increased tillers with increase in plant population rates.
The Effect of Plant Populations on Grain Quality of Bread Wheat
Quality seed is one of the most essential agronomic factor which need great importance for extreme yield of crops as to the national bread wheat production can be improved [73]. According to the report of Bryan, [74] and Jennifer [67] bread wheat quality is not reduced at higher plant population levels as protein content; kernel weight and test weight was unaffected and these outcomes are not in line with current research results. In contrast, it was stated that protein concentration declined as plant population levels and yields increased [75]. Seed quality is defined as standard of excellence in certain characteristics and/or attributes that will determine the performance of the seed when sown or stored.
Seed quality describes the potential performance of a seed lot. High-quality seed lots should meet minimum standards for each of these characteristics. High quality seed is the key to successful agriculture [76]. For achieving optimum growth and yield production, the basic requirement of farming is to obtain quality seed. Good quality seed can increase yields by 5-20%. The extent of this increase is directly proportional to the quality of seed that is being sown. The seed quality is also reflected in the final growth, maturity of plants, their uniformity and stability of yield. For seed to play a catalytic role, it should reach farmers in a good quality state, i.e. high genetic purity & identity, as well as high physiological & health quality [77]. If the seed lots possess high genetic purity and high germination percentage, and meets the certification standards, is said to have high quality. In general, poorer quality seeds show low viability, reduced germination and emergence rates, poor tolerance to sub optimal conditions and low seedling growth rates. If seedling emergence is inadequate, crop yield will be reduced and in most situations no amount of efforts and expenses later on crop development can be compensated for these effects.
There is a clear relationship between plant population and yield with yield increasing asymptotically as the population increases. Plant population rates can impact on bread wheat protein quality [70]. Hence, achieving higher agronomic performance and better end-use quality requires optimizing and periodically reviewing management practices such as plant population levels.
The Influence of Seed Source on Crop Growth and Grain Yield of Bread Wheat
Seed source influenced growth and yield during the growing season but the response depended on seed size and variety. The source of seed is can also be important since location influences seed nutrient content. The seed source has significant effect on seedling dry weight. Alemayehu A [78], was reported that the number of tillers were significantly affected by main effect of variety, seed source and seed rate. Interaction effect of variety and seed source has highly significant effect on number of tillers per 1 m length.
The influence of seed source on seed quality attributes, such as germination percentage, rate of germination, seedling root length and seedling fresh weight, was significant under laboratory conditions [78]. Farmers in Ethiopia can obtain seed from formal and informal sources. The formal seed source is a system composed of institutional and organizational arrangements. The informal seed source under Ethiopian context is defined as a system of seed production and distribution along with the different actors where there is no legal certification in the process [79].
The Effect of Plant Populations on Yield Components of Bread Wheat
This outcome also in line with Chaudhary [59] who explained that lower plant population levels significantly increased the number of grains per spike. Akhtar MA [80] and Khan [81] concluded that by increasing seed rate the 1000-grains weight is reduced. These results are in analogy with the findings of earlier works of Arif [60] who reported higher yield with seed rate of 150 kg ha-1.Plant population rates can impact on wheat tillering capacity, grain yield [70].
However, in varieties that produce fewer tillers, higher plant populations compensated for reduced tiller and promoted more main stem spikes [70]. According to the research results of Ghulam S. Nizamani., et al., [58], bread wheat plant population rate has significant influence on majority of agronomic traits and bread wheat varieties sown at seed rate of 125 kg ha-1 significantly enhanced the grains per spike (42.93) with compared to that of sown at seed rate of 150 kg/ha (42.08) or 100 kg ha-1 (42.36). Increase or decrease in seed rate from 125 to 150 or 100 kg ha-1, respectively did not show any significant variation in grains per a spike. Sowing at a seed rate that result in optimal plant population may reduce seed costs, lodging, and ameliorate disease problems [58].
In spite of seedling numbers and harvest index percent appeared relatively better at higher seed rate of 150 kg ha-1 (95.38 and 38.66%, respectively) than that of 100 kg/ ha (95.35 and 38.03, respectively) & 125 kg ha-1 (95.21 and 38.32, respectively), the differences between them arise statistically non-significant. Similarly, the spike length seems to be relatively high at seed rate of 125 kg ha-1 (12.32 cm) compared to that of at 150 (12.20 cm) and 100 kg ha-1 (12.16 cm), they do show statistically non-significant differences [58].
Plant populations appeared high at higher seed rate of 150 kg ha-1 (104.99 m-2), followed by 125 kg ha-1 (101.70 m-2) and 100 kg ha-1 (97.85 m-2). Grain weight, a spike length and 1000 grain weight (gm) were although high at seed rate of 125 (2.67 and 43.67 gm, respectively) but statistically similar to that of seed rate 100 kg ha-1 (2.66 and 43.43 g, respectively).
Effect of the Varieties Seed Size and Plant Population on Grain Yield of Bread Wheat
Jemal Abdulkerim [14] also reported that the varieties Shorima_/small seed size/ and Kekeba/medium seed size/_ gave maximum grain yield at seeding rate of 150 kg/ha and, variety Digelu/medium seed size/ produced highest yield at seeding rate of 175 kg ha-1 as compared to 100, 125, and 200 kg ha-1.
Alike with the contemporary, who reported that the lowest seeding rate (100 kg ha-1) resulted in a grain yield of 3851 kg ha-1, which was significantly lower than the yields obtained at the other seeding rates (150 and 175 kg ha-1). In the unlike way, Worku Awdie [61] and Hussain [82] reported that grain yield increased as seeding rate was increased from 50 to 150 and from 100 to 150 kg ha-1, respectively. Furthermore, Ali, [83] concluded that the three years’ average data showed that grain yield was maximum at seeding rate of 150 kg ha-1 followed by 175 and 200 kg ha-1 as against the seeding rate of 125 kg ha-1. Seeding rate of 150 kg ha-1 produced significantly higher grain yield (4120 kg ha-1) followed by 175 and 200 kg ha-1 seeding rates (3904 and 3785 kg ha-1). The seeding rate of 125 kg ha-1 produced significantly lower grain yield (3.669 tones). Another research finding by Nazir [84] also showed that 150 kg ha-1 seeding rate produced significantly the highest grain yield. In addition, higher grain yield with higher seeding rates was also reported by Olsen [71] and Haile [72].
The same result has also been proved by Sikander [85] who concluded that increasing seeding rate from 150 to 250 seeds m-2 resulted in higher grain yield. Whereas higher seed rate of 150 kg ha-1 revealed remarkably least grain weight of a spike (2.57 gm) and 1000 grain weight (42.27 gm) contrast to that of 125 and 100 kg ha-1 seed rates. However, in the economics context, highest grain yield by itself does not indicates much about production efficiency [86, 87] and since the above mentioned grain results were not verified by partial budget analysis, the highest grain yield by itself cannot be recommended for farmers. It also comes out so clearly from research publications that new technologies have been studied for potential yields but comparative economic analysis has not been part of it.
The Effect of Large Sized Seeds on Grain Yield of Bread Wheat
Larger seeds of spring wheat produced higher yields than smaller seeds under late-sown conditions but not under optimum management conditions. In bread wheat, seed size not only influence emergence and establishment but also affected yield components and ultimately grain yield. Simmone [88], reported that size of seed has a strong influence on germination as well as growth and biomass increment of a plant. Kumar and Seth [65] observed that seed size affected the seed yield significantly.
In similar study was reported that use of larger seed sizes improved grain yields by 18% and the use of small seeds reduced yield by 16% in wheat (Stougaard and Xue 2005). Stougaard and Xue (2005) opined that 18% of increased yield could be obtained by larger seeds in wheat. Large seeds have more food storage for embryo growth and development which lead to vigorous growth of the seedling before weeds can emerge and create competition. Lima [89] noted that crop growth rate at the beginning of the growth cycle was higher in plants originating from large seeds. Khurana and Singh [90] who noted that seed size variations affected leaf area, large seeds producing greater leaf area. Stobbe [91] reported that crops grown from large kernels consistently yielded higher than crops grown from small kernels of the same cultivar, for bread wheat (Triticum aestivum L.) and barley (Hordeum vulgare). Adejare [92] reported that large seed size had higher seed yield compared to other medium and small sizes.
Effect of Medium Sized Seeds and Small Sized Seeds on Grain Yield of Bread Wheat
Wheat sown with medium size of seed and small size seed followed a simultaneous decrease in wheat production and concluded that large size seed resulted in maximum grain yield (5294.30 kg ha-1) and yield decreased considerably when sowing was done with medium size and small size seed. Elliott RH, Franke C, Rakow GFW [93], noted that small seeds produced seedlings with much less vigour. Dar [94] have mentioned that small seeds to medium sized ones produced better germination and seedling vigor than those of bigger ones. Smallest seed size had lowest emergence therefore, it is assumed that plants grown from small seed had less fertile tillers than those grown from large seed. Whereby, grain yield and biological yield decreased in smallest seed size. It is obvious that increase in biological yield by increasing seed size was related to higher seedling weight and weight of 100
plants were produced by larger seed sizes in wheat [63].
Adebisi, et al., 2013. reported that in tropical soybean lots with small seed size had maximum seed germination (97%) and emergence (90%) while those with large seed size produced the highest seeds (88.00) per plant, pods (54.00) per plant and seed yield (9.72 g) per plant.
Relationships among Plant Populations, Grain Yield and Yield Components of Wheat
The research results of Xue Q [63] demonstrate that the use of higher plant population rates and larger seed size classes both improve wheat competitive ability towards increasing economic returns. In general, variation in the optimum plant populations was greater between seasons for a given cultivar than between varieties within seasons. The relationship among grain yield and yield components was examined at the optimum population rather than at an arbitrary plant populations at which grain yield may have been suboptimal for some varieties. Grain yields at the optimum plant populations for the various varieties were positively related to culms m-2, spikes m-2 and seeds m-2.
They were not clearly related to culm mortality (%). Spike size (seeds spike-1 or spike weight) and seed size were also not clearly related to grain yield at the optimum plant populations, and it was thus postulated that the production and survival of large numbers of culms, which in turn led to large numbers of seeds per unit area, were the source of large grain yields. Some interactions were found between yield components and plant population for some cultivars that could have implications for plant breeders selecting at low plant densities.
Interactions between varieties and plant populations implied that some varieties required different populations to achieve maximum yields [95]. According to the research results of Anderson [96], the optimum plant populations at maximum grain yield varied over 30-220 plants m-2, depending the cultivars seed size. In general, variation in the optimum plant populations was greater between seasons for a given variety than between cultivars within seasons. The relationship between grain yield and yield components was examined at the optimum plant populations rather than at a random population at which grain yield may have been suboptimal for some varieties.
Grain yields at the optimum plant populations for the various variety were positively related to culms m-2, spikes m-2 and seeds m-2. Spike size, seeds spike-1 or spike weight and seed size were also not clearly related to grain yield at the optimum populations., and it was thus postulated that the production and survival of large numbers of culms, which in turn led to large numbers of seeds per unit area, were the source of large grain yields. Some interactions were found between yield components and plant populations for some cultivars that could have implications for plant breeders selecting at low plant densities. Interactions between varieties and plant populations implied that some varieties required different populations to achieve maximum yields in some seasons [63].
Agronomic Research and Management Options for Maximizing Bread Wheat Yields
Determination of the optimal plant population rates that necessary for optimal bread wheat yield is a major agronomic goal. In recent years, agricultural growth in China has accelerated remarkably, but most of this growth has been driven by increased yield per unit area rather than by expansion of the cultivated area [97].
Looking towards 2030, to meet the demand for grain and to feed a growing population on the available arable land, it is suggested that annual crop production should be increased to around 580 Mt and that yield must need to be increased by at least 2% annually by means of improved farming systems and application of new technology packages [38, 98]. This would lead to substantial improvement in bread wheat crop management practices, which are currently suboptimal. The biggest gains from improved technology will come most immediately from combinations of improved crops and improved agronomical practices [98]. On the other hand, wheat is grown in a wide range of environments that affect overall performance, particularly grain yield and end-use quality. There is a high demand by commercial and small- scale peasant farmers for wheat varieties with higher grain yield, the most cost-effective and better end-use quality.
The Effect of Seed Size on Growth, Quality, Yield and Yield Components of Bread Wheat
According to the research result of Zareian A [16], seed size had a significant impact on all of measured traits with the exception of thousand seeds weight. Results indicated that number of seeds per spike significantly decreased by increasing seed size. The other traits showed significant increase by increasing seed size. Varieties had significant effect on thousand seeds weight, but other traits were similar among varieties.
This study suggested that large seed sizes were superior compared to the other seed size and wheat cultivars had similar performance regarding to the variation in seed sizes. No significant interaction was observed for all traits studied in this experiment [16].
Effect of Plant Populations on Growth, Quality, Yield and Yield Components of Bread Wheat
The research results of Jemal A [14] showed that days to 50% of heading, days to 90% of physiological maturity, plant height, spike length, hectoliter weight and Harvest Index were affected highly significantly (p<0.01) by the main effects of variety and plant population whereas, grain protein content was affected highly significantly (p<0.01) by only variety and biomass yield was affected highly significantly (p<0.01) only by the main effect of the seed rate. Furthermore, thousand kernels weight, number of effective tillers and number of kernels per spike and grain yield were affected highly significantly (p<0.01) by the interaction effects of variety and seed rate. According to the research results of Ghulam S [58], the use of 150 kg ha-1 seed rate for variety Shorima resulted in highest thousand kernels weight (39.48 g), number of kernels per spike (60.23) and grain yield (5339.3 kg ha-
1). From the result of this study, the use of 125 kg ha-1 seed rate for variety Dendea; 150 kg ha-1 for varieties Shorima and Kekeba and 175 kg ha-1 for variety Digalu were identified for good crop stand and finally the yield. Seed rate at a rate of 100 kg ha-1 revealed early days to heading (72.32) followed by 125 kg ha-1 (72.94) and 150 kg ha-1 (73.57).
The Farmers Need for Optimal Plant Population Rates to Reduce their Seed Cost
Farmers need to know what optimum seed rates they should use under their conditions. They decide whether they can reduce their costs of seed through adjustment of plant population rates.
Farmers also want to know how varieties influence crop establishment and plant populations [38, 98]. According to Fan [98] and Mingsheng [38], the best seed rate is that which maximizes grain yield. In practice grain yield hardly changes with further increases in plant population rates once maximum yield is reached. Seed sown above that needed to reach the flat part of the curve, is money wasted.
It should be around a ratio of 5:1 i.e. the cost of quality seed is five times the value of grain produced. The economic analysis results of this study suggested that large sized varieties and quality seeds were superior as compared to the small and medium sized seeds and hence, according to Fan [98] and Ming Sheng [38], bread wheat varieties had similar performance with regard to the dissimilarity in the varieties seed size.
Different Seed Sized Varieties that Represent about 19 Various Bread Wheat Genotypes
The three bread wheat varieties that can represent the three seeds sizes of 32.5 mg, 37.6 mg, 42.6 mg and four plant population levels of 250 plants/m2, 300 plants/m2, 350 plants/m2, 400 plants/m2 were assigned and twelve treatment arrangements of three bread wheat genotypes were tested. The selected bread wheat varieties were classified in to three broad seed sizes, namely small, medium and large. Hence the varieties Shorima, Dendea and Hidassie were selected to represent the small, medium and large size seeds of bread wheat, respectively. The three varieties with different seed sizes were combined with four plant population levels. For the convenience my experiment, these different sized bread wheat varieties were assigned as main plot treatment, while four different levels of plant population were assigned as sub plot treatments. As a result, in the then of my experiment 400 seeds/ m2 or 4,000,000 seeds/ha was the normal seed rate to be assigned as a standard check of that experiment.
Economic Analysis of Bread Wheat Grain Yields
The Economic analysis results of the varieties seed size and plant populations have been indicated a consistent profitable response on grain yield of bread wheat.
Relating to the partial budget analysis results, the highest net benefit value (46735 ETB ha-1) was obtained from the variety Hidassie at a seed rate of 300 seeds m-2, followed by the net benefit value (44460 ETB ha-1) was obtained from the variety Hidassie at a seed rate of 250 seeds m-2 and the lowest grain yield (30117 ETB ha-1) was obtained from the variety Hidassie at seeding rate of 400 seeds m-2. The results of the partial budget analysis and the economic data used in the development of the partial budget are illustrated in (Table 1).
Costs that Vary and the Inputs Price Data Collected
Data necessary for economic analysis was collected from the experiment field and from the nearest wheat producing farmers were reviewed as well. All variable costs including land preparation, planting, weed control, and harvesting costs are estimated based on the actual field prices at the time of planting, and at vegetative growth stages as well as immediately after harvest; and assigned over the varieties and plant population levels.
The variables buying costs and selling prices used for economic analysis is the 2018 and 2019 marketing costs and local market prices respectively, due to the better management conditions. The costs of NPS and N fertilizer were estimated based on the cost of NPS and Urea, respectively Dechassa H [4]. Dominance analysis, as recommended by CIMMYT [86], was applied to screen treatments with higher variable costs, but lower net benefits; and dominated treatments eliminated from further considerations in Marginal analysis.
The minimum acceptable rate of return was taken as 100%; and treatments with lower minimum rates of return were also removed from further analysis.
The above assigned seed prices are calculated with normal seed price of ETB 2288 per 150 kg (400 seeds m-2) for one hectare, but it may become vary from this according to the varieties seed size. The total cost that vary (TVC) for lesser plant population levels was lower than the greater plant population levels. On the other hand, lowest net benefit (NBV) was scored due to the highest seed rate of 400 seeds m-2 which benefited about 30117 ETB ha-1 Dechassa H [4]. Relevant data to conduct preliminary assessment of economic analysis, yield levels were collected using data collecting formats that were developed to this effect. These were mainly the costs of inputs, wages, fertilizers, chemicals and the prices of outputs.
Partial Budgeting Analysis of Bread Wheat Grain Yields
In order to organize the experimental data and information about the costs and benefits of various alternative treatments, a partial budget analysis was done to determine the economic impact of various alternative treatments as compared to the farmers’ practice for bread wheat production at the study area.
Local market (LM) price was used to calculate the product value. The cost of labour for weeding was taken at 35.00 ETB per day. Considering the costs that varied (cost of seed, fertilizers, chemicals and labour wage for planting, weeding and harvesting), the farmers’ practice had a lower cost than the experimental method. In the partial budgeting analysis result of the present study, the costs for the different plant population levels varied according to their rates requirements being other costs were constant for each treatment.
In order to recommend the present results for the study area, it is necessary to estimate the minimum rate of return acceptable to farmers or producers in the recommendation domain. According the study results of Dawit Habte H [18], the highest net benefit (46735 ETB ha-1) was obtained from treatment combination of variety the Hidassie/large seed size/ with a seed rate of 300 seeds m-1, followed by net benefit (44460 ETB ha-1) was obtained from the treatment combination of variety Hidassie/large seed size/ with a seed rate of 250 seeds/m-2, while the lowest net benefit (30117 ETB/ha-1) was also obtained from the combination of variety Hidassie/large seed size/ with a seed rate of 400 seeds/m-2 only in one growing season as shown on (Table 4) [18].
Benefit to Cost Ratio Analysis
A benefit-cost ratio (BCR) is a ratio used in a cost- benefit analysis to summarize the overall relationship between the relative costs and benefits of a proposed project. If a project has a BCR greater than 1.0, the project is expected to deliver a positive net present value to a firm and its investors. The benefit cost ratio is calculated by dividing the present value of benefits by that of costs and investments. This is the consolidated formula (source): where: BCR = Benefit Cost Ratio. PV = Present Value. The Benefit Cost Ratio (BCR), also referred to as Benefit-to-Cost Ratio is an indicator that is typically used within a cost benefit analysis. In project management, the benefit cost ratio can support the cost- benefit analysis of a business case.
The PMI Project Management Body of Knowledge lists the BCR under project success measures, next to the net present value and return on investment. If a project has a BCR greater than 1.0, the project is expected to deliver a positive net present value to a firm and its investors. If a project›s BCR is less than 1.0, the project›s costs outweigh the benefits, and it should not be considered. The benefit-cost ratio analysis was used in the cost-benefit analysis in order to summarize the overall relationship between the relative costs and benefits of the proposed research project in which the BCR was expressed in monetary terms. The alternatives are not simply ranked but can be quantitatively assessed one against the other.
The highest benefit cost ratio of (7.57) with low marginal cost and more profitable MRR (795%) was obtained from the variety Hidassie/large seed size/ at the use of 300 seeds m-2 seeding rate followed by (7.55) benefit cost ratio with the advantageous MRR (899%) was recorded from the variety Hidassie/large seed size/ at seeding rate of 250 seeds m-2 respectively (Table 5 and 6).
Therefore, the most economical seed rates for small scale farmers of the study area with low cost of production and higher benefits in this case were 300 and 250 seeds m-2 seeding rates of variety Hidassie/large seed size/ respectively Dawit Habte H [18].
| Variety | Plant population ha-1 | Average grain yield (kg/ha) | Adjusted grain yield (kg/ha) | Total costs that varied (ETB/ha) | Gross farm benefit (ETB/ha) | Net benefit value (ETB/ha) | Benefit to cost ratio (ETB) | |
|---|---|---|---|---|---|---|---|---|
| 1 | Shorima | 2500000 seeds | 3930 | 3341 | 5382 | 43433 | 38051 | 7.07 |
| 2 | Shorima | 3000000 seeds | 4346 | 3694 | 5656 | 48022 | 42366 | 7.49 |
| 3 | Shorima | 3500000 seeds | 4322 | 3674 | 6001 | 47762 | 41761 | 6.96 |
| 4 | Shorima | 4000000 seeds | 4059 | 3450 | 6178 | 44850 | 38672 | 6.26 |
| 5 | Dendea | 2500000 seeds | 4134 | 3514 | 5595 | 45682 | 40087 | 7.16 |
| 6 | Dendea | 3000000 seeds | 4045 | 3438 | 5931 | 44694 | 38763 | 6.54 |
| 7 | Dendea | 3500000 seeds | 4485 | 3812 | 6236 | 49556 | 43320 | 6.95 |
| 8 | Dendea | 4000000 seeds | 4865 | 4135 | 6572 | 53755 | 47183 | 7.18 |
| 9 | Hidassie | 2500000 seeds | 4556 | 3873 | 5889 | 50349 | 44460 | 7.55 |
| 10 | Hidassie | 3000000 seeds | 4788 | 4070 | 6175 | 52910 | 46735 | 7.57 |
| 11 | Hidassie | 3500000 seeds | 3643 | 3097 | 6541 | 40261 | 33720 | 5.16 |
| 12 | Hidassie | 4000000 seeds | 3350 | 2848 | 6907 | 37024 | 30117 | 4.36 |
Table 4: Partial Budgeting Analysis of Bread Wheat Grain Yields. Note: Cost of seed 15.25 ETB/kg; Labor Cost ETB 35/day; Field Sa
Table 4: Partial Budgeting Analysis of Bread Wheat Grain Yields. Note: Cost of seed 15.25 ETB/kg; Labor Cost ETB 35/day; Field Sales price ETB 13.00/kg Adjusted Grain Yield Analysis of Bread Wheat (kg ha-1) The adjusted yield is the average yield adjusted downward by a certain percentage to reflect the difference between the experimental yield and the yield farmers could expect from the treatment. Experimental yields, even from on-farm experiments under representative conditions, are often higher than the grain yields that farmers could expect using the same treatments [86].
There are several reasons for yield adjustment insistences and just to emphasize some key points:
• Field Management Researchers can often be more precise and sometimes more timely than farmers in operations such as plant spacing, fertilizer application, or weed control.
• Plot Size Yields estimated from small plots often overstate the yield of an entire field because of errors in the measurement of the harvested area and because the small plots tend to be more uniform than the farmers large fields.
• Harvest Date Researchers often harvest a crop at physiological maturity, whereas farmers may not harvest at the optimum time. Thus even when the yields of both researchers and farmers are adjusted to constant moisture content, the researchers’ yield may be higher, because of fewer losses to insects, birds, rodents, ear rots, or shattering.
• Form of Harvest In some cases farmers’ harvest methods may lead to heavier losses than result from researchers’ harvest methods.
This might occur, for example, if farmers harvest their fields by machine and researchers carry out a more careful manual harvest. Unless some adjustment is made for these factors, the experimental yields will overestimate the returns that farmers are likely to get from a particular treatment [18].One way to estimate the adjustment required is to compare yields obtained in the experimental treatment which represents farmers’ practice with yields from carefully sampled check plots in the farmers’ fields. Where this is not possible, it is necessary to review each of the four factors discussed earlier & assign a percentage adjustment.
Dominance Analysis on Bread Wheat Grain Yields
Dominance analysis procedure was carried to select potentially profitable treatments from the range that was tested. It was done first by listing the treatments in order of increasing costs that vary as shown on (Table 5). Any treatment that had net benefits that are less than or equal to those of a treatment with lower costs that vary is dominated. Then the dominated treatments were eliminated from further economic analysis. It led to the selection of treatments, Hidassie/large seed size/ at seed rate of 250 and 300 seeds m-2, which ranked in equal order of the BCR respectively. The marginal rate of return for non-dominated treatments is stated in (Table 6). MRR among treatme_nts_ of the variety Hidassie at seed rate of 300 seeds m-2 were lower than that of the treatments in the variety Hidassie at seed rate of 250 seeds m-2.It was finally to in that order would give positive MRR of 795% and 899% respectively.
| Variety/Seed Size | PPL | TVC (ETB/ha) | NBV (ETB/ha) | Dominance | |
|---|---|---|---|---|---|
| 1 | Shorima/Small | 250 seeds m-2 | 5382 | 38051 | |
| 5 | Dendea/Medium | 250 seeds m-2 | 5595 | 40087 | |
| 2 | Shorima/Small | 300 seeds m-2 | 5656 | 42366 | |
| 9 | Hidassie/Large | 250 seeds m-2 | 5889 | 44460 | |
| 6 | Dendea/Medium | 300 seeds m-2 | 5931 | 38763 | Dominated |
| 3 | Shorima/Small | 350 seeds m-2 | 6001 | 41761 | Dominated |
| 10 | Hidassie/Large | 300 seeds m-2 | 6175 | 46735 | |
| 4 | Shorima/Small | 400 seeds m-2 | 6178 | 38672 | Dominated |
| 7 | Dendea/Medium | 350 seeds m-2 | 6236 | 43320 | Dominated |
| 11 | Hidassie/Large | 350 seeds m-2 | 6541 | 33720 | Dominated |
| 8 | Dendea/Medium | 400 seeds m-2 | 6572 | 47183 | |
| 12 | Hidassie/Large | 400 seeds m-2 | 6907 | 30117 | Dominated |
Table 5: Dominance Analysis of Bread Wheat Grain Yields Note: PPL = plant population level; TVC= total variable cost; NBV = net b
The changes to the variety Shorima at plant population levels of 250 seed m-2 is eliminated for this reason to remain with changes to the variety Hidassie/ at plant population levels of 250 and 300 seeds m-2 which gave more than
100% MRR as promising new practices for farmers under the prevailing price structure (Table 3). According CIMMYT [18], the minimum acceptable marginal rate of return (MRR) should be 100%.
| Variety/Seed Size x PPL | TVC (ETB/ha) | MC (ETB/ha) | NBV (ETB/ha) | MNB (ETB/ha) | MRR (%) | |
|---|---|---|---|---|---|---|
| 1 | Shorima/Small x 250 Seeds m-2 | 5382 | 38051¶ | |||
| 5 | Dendea/Medium x 250 Seeds m-2 | 5595 | 213 | 40087¶ | 2036 | 956 |
| 2 | Shorima/Small x 300 Seeds m-2 | 5656 | 61 | 42366¶ | 2279 | 3736 |
| 9 | Hidassie/Large x 250 Seeds m-2 | 5889 | 233 | 44460 | 2094 | 899 |
| 10 | Hidassie/Large x 300 Seeds m-2 | 6175 | 286 | 46735 | 2275 | 795 |
| 8 | Dendea/Medium x 400 Seeds m-2 | 6572 | 397 | 47183¶ | 448 | 113 |
Table 6: Marginal Analysis Effects of Bread Wheat Grain Yield. Note: ₠ = eliminated; PPL = plant population level; TVC = total va
As stated by CIMMYT [18], recommendation is not necessarily based on the highest yield and even not based on the highest MRR. Recommendation is just based on the highest net benefit cost ratio and thus, the most economically superior variety and seed rate for farmers of the study area with low cost of production and the highest net benefits were identified to be the variety Hidassie/large seed size/ at seeding rate of 300 seeds m-2 (142.00 kg ha-2). The seeding rate of 250 seeds m-2 (118 kg ha-2) of this variety was also profitable with the highest net benefit and recommended as 2nd option. Consistent with the partial budgeting analysis results, it can be determined that the most profitable treatment was the variety Hidassie/large seed size/ which gave the highest benefit cost ratio of (7.57) and MRR (795%) at seed rate of 300 seeds m-2 whereas, alternatively the MRR of (899%) and benefit cost ratio (7.55) were attained also from the variety Hidassie/large seed size/ at seeding rate of 250 seeds m-2 as shown on (Tables 4 & 6).
Therefore, the changes to the variety Shorima/small seed size/ at a seed rate of 250 seeds m-2; Dendea/Medium seed size/ at a seed rate of 250 seeds m-2, Shorima/Small seed size/ at a seed rate of 300 seeds m-2 and Dendea/medium seed size/ at a seed rate of 400 seeds m-2 are eliminated for their low benefit cost ratio and to remain with the changes to the variety Hidassie/large seed size/ at seed rate of 300 and 250 seeds m-2.
The yield of treatment 8 is higher than that of treatment 10, but the dominance analysis shows that the value of the increase in yield is not enough to compensate the increase in costs. Farmers would be better off using the lower seed rate with lower costs [4, 99, 100].
Conclusion
One of the great challenges encountering Ethiopia at present is the productivity, income and production of sufficient food to feed the quickly increasing population growth. Getting more agricultural land-dwelling into farming is not possible in the closely inhabited regions. Improved agricultural productivity requires higher yields per unit land area, which increases the demand of improving the production and productivity of bread wheat.
Concerning the varietal differences, in previously studies revealed that selecting varieties which are related to the specified population and use by farmers may be a feasible option for improving bread wheat yields. Based on the result of the economic analysis, among four plant population levels the use of 300 and 250 seeds m-2 for the variety Hidassie/large seed size/ is superior in most of bread wheat agronomic traits. The bread wheat varieties seed size and plant population-rates interaction effect showed that most economical and profitable grain yield of 4100 and 4339 kg ha-1 was produced at seed rate of 250 and 300 plants m-2 for the variety Hidassie/large seed size/ respectively.
According to the partial budgeting analysis, a visible advantageous and more profitable dominance with low cost of the variety Hidassie /large seed size/ at plant population of 300 plants m-2 (142 kg ha-1) and 250 plants m-2 (118 kg ha-1) was found to be over the other varieties.
This shows that the variety Hidassie is genetically better in grain yield than varieties Dendea and Shorima. As a whole, significant variations in grain yields gap and Cost-effects of bread wheat varieties were observed due to variety seed size and plant-population levels. The current study suggested that sowing bread wheat with large sized seeds such as the variety Hidassie was peculiarly beneficial with most encouraging agronomic performance. With the objective to determine the effect of seed rates and plant population rates on the yields and cost effects of different bread wheat varieties, the field experiments were carried out in different times at Kulumsa Agricultural Research Center from July to November 2012 & from June to November 2018 cropping seasons.
Four varieties (Digalu, Dandea, Kakaba and Shorima) and five seed rates (100, 125, 150, 175, 200 kg ha-1) with three row spacing (20, 25 and 30 cm) were tried. On the other hand, in the 2018 cropping season, three bread wheat varieties (Shorima, Dendea and Hidassie representing different seed sizes of small, medium, large respectively and four plant populations of 250, 300, 350 and 400 seeds m-2 were tested. Apart from this, the same type of experimental study with the same nature of objectives were also carried out during the 2015 main cropping season at Awtaro Woreda, Wolaita Zone on farmer’s field, From the result of this studies, the use of 125 kg ha-1 seed rate for variety Dendea; 150 kg/ha for varieties Shorima and Kekeba and 175 kg/ha for variety Digalu were identified for good crop stand and the top crop yield.
In general, from all of the studies, significant differences in grain yield and most of agronomic parameters of bread wheat were identified due to variety and seeding rates. Similar experiment with the same nature of objectives were also carried out at Kulumsa Agricultural Research Center from June to November 2018 main cropping season, with the objectives of to determine the optimum plant population rate by identifying the most cost-effective bread wheat variety. Most of the yield gap was attributed to the technology yield gap, meaning that certain inputs and technologies are entirely lacking in highest-yielding fields such as technologies for optimal crop establishment and for control of pests, diseases, and weeds and that the current input levels are not high enough to reach the water-limited yield. Although their small share in explaining the wheat yield gap, narrowing the efficiency and resource yield gaps can nearly double actual yields and contribute to realize the yield progress needed to achieve bread wheat self-sufficiency in Ethiopia without having to expand the bread wheat area.
Recommendation
The author intensely believes that upon the application of the suggestions made here, with regard to using of proper seed rate will be boosted. Furthermore, the author is extremely convinced that these recommendations can be used by farmers, extension agents, policymakers, researchers and other stakeholders involved in bread wheat production in efforts to improve wheat productivity. The following are the most important recommendations made based on the findings of the study discussed above.
Whereas the cost reduction and high seed prices are frequently reported as main factors for seed reprocessing, the cost-benefit analysis indicated that the use of unprocessed certified seed leads to better economic gains than reprocessed or recycled seeds.
In accordance with the result of the economic analysis, among four plant-population levels the use of 300 and 250 seeds m$^{-2}$ from the unprocessed certified seed of different three varieties, the variety Hidassie/large seed size/ is superior than most of bread wheat varieties. Therefore, this study recommends strategies that will encourage the use of fresh and unprocessed certified seeds. Likewise, agricultural credit schemes and price subsidizations geared towards helping farmers use unprocessed or unrecycled certified seeds are recommended as key strategies to reduce economically wasteful reprocessing practices.
Putting into practice of these recommendations is expected to take along multiple benefits. First, it will raise farmer’s productivity, income, and food security. Second, seed scientists, seed producers, and other individuals and institutions will benefit the most from their research and innovations.
This profit could also be reinvested for more research and development efforts. Third, agro-processing could be enhanced that may increase government revenue and the creation of wider employment opportunities.
Seed recycling practices have caused yield loss as compared to the non-recycled seeds. Therefore, ensuring the supply of fresh certified seeds is highly recommended. This could be achieved through encouraging seed parastatals, establishing new seed production and marketing cooperatives, and encouraging the existing ones.
Wheat varietal diversity in the study area is found to be very low. This study therefore strongly recommends varietal diversification through the promotion of different varieties in the study areas instead of relying on one variety.
Grain yield maximization was the most important reason to use seed rates beyond the recommendation.
The evidence from the existing seed rate application of the farmers proved that a higher seed rate of up to 50 kg ha$^{-1}$ above the existing recommendation has been associated with the highest yield per hectare. Thus, this study strongly suggests that the MoA, agricultural research institutes, and other stakeholders undertake location-specific seed rate trials and validations to keep or modify the existing seed rate application.
To further contribute to the yield effects of plot-level seed rate and plant-population practices, this study has several significant implications for future research efforts. Thus, research efforts in the following thematic areas will enrich the existing discussions and knowledge as far as the yield effects of seed rate and seed recycling practices are concerned.
The use of time-series data will provide clear evidence about the yield effects of plot-level seed rates and seed recycling practices of CBWS on a temporal basis.
The yield effects of wheat seed rates and plant-population rate for different bread wheat varieties in different socio-economic settings, weather conditions, and spatial arrangements should be investigated.
As the research results of this study also indicates, the use of 125 kg/ha seed rate for variety Dendea; 150 kg/ha$^{-1}$ for varieties Shorima, Kekeba and 175 kg/ha-1 for variety Digalu can be recommended for most areas of Arsi zone as well as for interrelated areas of the same agro-ecological conditions. Besides, depending on the agronomic performance and yield of different studies variety Shorima at 150 kg/ha$^{-1}$ was advantageous.
However, as this is one season and one location experiment, it has to be repeated over the wide-ranging agro-ecologies and seasons with consideration of cost of production to reach at conclusive recommendation. The economic analysis of the experiment was brought to select the best combination of the variety Hidassie/large seed size/ at a plant population rate of 300 seeds m-2 (142.00 kg ha$^{-1}$) gave the greatest grain yield (4070 kg ha$^{-1}$) with low cost of production and higher net benefits and recommended tentatively as $1^{4}$ option for the study area. On the other hand, the variety Hidassie/large seed size/ at a plant population rate of 250 seeds m-2 (1118 kg ha$^{-1}$) gave better yield (3873 kg ha$^{-1}$) with a slightly additional cost rather than the primarily recommended seed rate and it was recommended as a $2^{nd}$ option for the small scale farmers of the study area.
Acknowledgment
This study was self-sponsored project and does not financially supported by any internal or external funding organizations. The author would like to acknowledge the research colleagues who work at Kulumsa Agricultural Research Center for their wonderful cooperation in their technical and analytical advices while conducting this pilot study.
References
-
Zareian A, Yari L, Hasani F, Ranjbar GH (2012) Field Performance of Three Wheat (Triticum aestivum L.) Cultivars in Various Seed Sizes. World Applied Sciences Journal 16(2): 202-206.
-
Alemu D, Assefa G, Kirub A (2016) Agricultural Research for Ethiopian Renaissance 2016. Ethiopian Institute of Agricultural Research (EIAR), pp: 384. Link: https://bit. ly/3uB630c
-
Adebisi MA, Kehinde TO, Salau AW, Okesola LA, Porbeni JBO, et al. (2013) Influence of different seed size fractions on seed germination, seedling emergence and seed yield characters in tropical Soybean (Glycine max L. Merrill). International Journal of Agricultural Research 8(1): 26- 33.
-
Adejare KO (2010) Effect of seed size and shape on field performance of tropical maize (Zea mays L.) varieties. Project Report, Department of Plant Breeding and Seed Technology, Federal University of Agriculture, Abeokuta, Nigeria.
-
Adugnaw Anteneh, Dagninet Asrat (2020) Wheat Production and Marketing in Ethiopia: A Review Study. Cogent Food & Agriculture 6(1): 1778893.
-
Akalu Teshome, Ermias Abate (2013) Wheat Technologies from Where to Where? The Case of East Gojam Zone of Amhara Region, Ethiopia. Journal of Agricultural Economics and Development 2(6): 226-236.
-
Akbar GA, Ghasemipirbalouti M, Najaf AFM, Shahverdi M (2004) Effects of harvesting time on soybeans seed germination and vigor. J Agr 6: 6-18.
-
Alemayehu A (2015) Effect of Seed Sources and Rates on Productivity of Bread Wheat **(**Triticum aestivum L.) Varieties at Kersa, eastern Ethiopia. Haramaya University, Haramaya.
-
Ali M, Ali L, Sattar M, Ali MA (2010) Improvement in wheat (Triticum aestivum L.) Yield by manipulating seed rate and row spacing in vehari zone. Adaptive Research Farm, Vehari. Journal of Animal and Plant sciences 20(4): 225-230.
-
Almaz A (2014) Response of Sulphur Fertilizer Application to Growth, Yield and Quality of Bread Wheat (Triticum aestivum L.) at Kulumsa, Arsi Zone, MSc Thesis, Bahir Dar University, Ethiopia, pp: 33-34.
-
Anbessie D, Abebe M, Dechassa H (2020) Effect of Plant Population on Growth, Yields and Quality of Bread Wheat (Triticum Aestivum L.) Varieties at Kulumsa in Arsi Zone, South-Eastern Ethiopia. International Journal of Research Studies in Agricultural Sciences (IJRSAS) 6(2): 32-53.
-
Anbessie Debebe A, Dawit Habte H (2020) Response of Seed Size and Plant Density on Growth, Yield and Grain Quality of Bread Wheat (Triticum aestivum L.) Varieties under Vertic Luvisols of Kulumsa in Arsi Zone. Journal of Natural Sciences Research.
-
Anbessie Debebe Aboye, Asrat Mekonnen Teto (2020) The response of Seed Rates and Row Spacing on Growth, Yield and Yield Components of Wheat (Triticum aestivum L.) Crop. Journal of Natural Sciences Research.
-
Anderson WK (1986) Some relationships between plant population, yield components and grain yield of wheat in a Mediterranean environment. Australian Journal of Agricultural Research 37(3): 219-233.
-
Anderson WK, Sawkins D (1997) Production practices for improved grain yield and quality of soft wheat’s in Western Australia. Australian Journal of Experimental Agriculture 37(2): 173-180.
-
Arif M, Ali M, Din QM, Akram M, Ali L (2003) Effect of different seed rates and row spacing on the growth and yield of wheat. J Anim Pl Sci 13(3): 161-163.
-
ATA (Agricultural Transformation Agency) (2015) A Training Manual on Cereal Production.
-
Baloch MS, Shah ITH, Nadim MA, Khan MI, Khakwani AA (2010) Effect of seeding density and planting time on growth and yield attributes of wheat. J Anim Pl Sci 20(4): 239-240.
-
Bonny S (2014) Taking stock of the genetically modified seed sector worldwide: market, stakeholders, and prices. Food Security 6(4): 525-540.
-
Braun HJ, Atlin G, Payne T (2010) Multi-location testing as a tool to identify plant response to global climate change. In: Reynolds MP (Ed.), Climate change and crop production, CABI International, pp: 115-138.
-
Braun HJ, Saulescu NN (2002) Breeding winter and facultative wheat. In: Curtis BC, Rajaram S, Macpherson HG (Eds.), Bred wheat, Improvement and production, pp: 567-575.
-
Bryan H (2001) Planting rate influence on yield and agronomic traits of harder spring wheat in north eastern North Dakota. NDSUAg. Report 1, North Dakota State University.
-
(2003) Center for New Crops & Plant Products, Purdue University. Triticum species. http://www.hort.purdue.edu/newcrop/nexus/ Triticum_spp_nex.html
-
Chaudhary MA, Ali A, Siddique MA, Sohail R (2000) Growth and yield response of wheat to different seed rates and wild oat (Avenafatua) competition durations. Pakistan J Agri Sci 37(3-4): 152-154.
-
Cheruth AJ, Gopi R, Sankar B, Gomathinayagam M, Panneerselvam R (2008) Differential responses in water use efficiency in two varieties of Catharanthus roseus under drought stress. Comptes rendus, Biologies 331(1): 42-47.
-
Chumbask Okusaa (2017) Seed Replacement Rates and Its Impact on Annual Yield Growth of the Kisumu District. A thesis Submitted to Jomo Kenyatta University of Agriculture and Technology, Nairobi, Kenya.
-
(1988) From agronomic Data to Farmer Recommendations: An Economics Training Manual. Completely Revised edition, Mexico. CIMMYT.
-
Clayton GW, Brandt S, Johnson EN, O’Donovan JT, Harker KN, et al. (2009) Comparison of Certified and Farm- Saved Seed on Yield and Quality Characteristics of Canola. Published in Agron J 101(6): 1581-1588.
-
CSA (2018) Report on Area and Production of Major Crops: Addis Ababa 57.
-
CSA (2019) Agriculture sample survey 2018/2019: Volume I Technical report on area and production of major crops. 589 Statistical Bulletin. Addis Ababa, Ethiopia.
-
CSA (2017) Agricultural sample survey: Report on area and production of major crops. Addis Ababa, Ethiopia.
-
CSA (2013) Agricultural Sample Survey 2006‒07: Report on Area and Production of Crops. Addis Ababa, Ethiopia.
-
Dar FA, Gera M, Gera N (2002) Effect of seed grading on germination pattern of some multi-purpose tree species of Jammu Region. Indian forester 128(5): 509-513.
-
Dobermann A, Cassman KG (2002) Plant nutrient management for enhanced productivity in intensive grain production systems of the United States and Asia. Plant and Soil 247: 153-175.
-
Dogbe W, Dzomeku IK, Yahaya BS, Siise A, Krofa EO, (2015) Influence of seed quality and soil fertility management on the production of rice (oryza sativa l.) in the guinea savanna of ghana. UDS International Journal of Development 2(2): 15-25.
-
Elliott RH, Franke C, Rakow GFW (2008) Effects of seed size and seed weight on seedling establishment, vigour and tolerance of Argentine canola (Brassica napus) to flea beetles, Phyllotreta spp. Canadian Journal of Plant Science 88(1): 207-217.
-
Elwell AL, Gronwal DS, Miller ND (2011) Sppalding parental environment from seed size effects on next generation growth and development in Arabdopsis. Plant Cell Envronment 34(2): 291-301.
-
Esayas Lemma (2015) Effect of Blended Fertilizers on Yield and Yield Traits of Durum Wheat (Triticum durum L. Var. Durum) Varieties in Ada District, Central Ethiopia Haramaya University, Haramaya, pp: 2-3.
-
Dawit Alemu, David Spielman J (2006) Ethiopian Seed System Regulation and Stakeholders. ESSP (Ethiopian Seed Strategies Program). Addis-Ababa, Ethiopia, pp: 109-115.
-
Fan M, Christie P, Zhang W, Zhang F, Lal R, et al. (2010) Crop production, fertilizer use and soil quality in China, Advanced in soil science: food security and soil quality, Boca Raton, London, New York.
-
(2016) FAOSTAT: Food Balance Sheets. FAO (Food and Agriculture Organization of the United Nations).
-
Feldman M (2001) Origin of Cultivated Wheat. In: Bonjean AP, Angus WJ (Ed.), The World Wheat Book: A History of Wheat Breeding, Intercept Ltd., London, pp: 3-56.
-
Finch Sevege WE (2000) Influence of seed quality on crop establishment, growth and yield. Seed Quality.
-
Gafaar NA (2007) Response of some bread wheat varieties grown under different levels of planting population and nitrogen fertilizer. Minufiya Journal of Agriculture 32: 165-183.
-
Gashaw Tadesse Abate, Tanguy Bernard, Alan de Brauw, Nicholas Minot (2016) The Impact of the Use of New Technologies on Farmers Wheat Yield in Ethiopia: Evidence from a Randomized Control Trial. Agricultural Economics 49(4): 409-421.
-
Geleta B, Atak M, Baenziger PS, Nelson LA, Baltenesperger DD, et al. (2002) Seeding Rate & Genotype Effect on Agronomic Performance & end-use Quality of Winter Wheat. Crop Sci 42(3): 827-832.
-
Ghulam Nizamani S, Shamsuddin T, Umed Ali B, Muhammad IK (2014) Influence of Different Seed Rates on Yield Contributing Traits in Wheat Varieties. Journal of Plant Sciences 2(5): 232-236.
-
Girma Gezimu Gebre, Hiroshi Isoda, Dil Bahadur Rahut, Yuichiro Amekawa, Hisako Nomura (2019) Gender differences in the adoption of agricultural technology: The case of improved maize varieties in southern Ethiopia. Women’s Studies International Forum 76: 102264.
-
Habte D, Tadesse K, Admasu W, Desalegn T, Mekonen A (2014) Agronomic and economic evaluation of the N and P response of bread wheat growin in the moist and humid mighighland vertisols areas of Arsi zone, Ethiopia. Afr J Agric Res 10(3): 89-99.
-
Haile Deressa, Girma F (2010) Integrated Effect of Seeding Rate, Herbicide Dosage and Application Timing on Durum Wheat (Triticum Turgidum L. Var Durum) Yield, Yield Components and Wild Oat (Avena Fatua L.) Control in South Eastern Ethiopia. Momona Ethiopian Journal of Science.
-
Hameed E, Wajid SA, Shad AA, Bakht J, Muhammad T (2003) Effect of different planting dates, seed rates and nitrogen levels on wheat. Asian J Plant Sci 2(6): 464-474.
-
Hochman Z, Horan H (2018) Causes of wheat yield gaps and opportunities to advance the water-limited yield frontier in Australia. Field Crops Res 228: 20-30.
-
Hussain I, Khan MA, Khan H (2010) Effect of seed rates on the agro-physiological traits of wheat. Sarhad J. Agric 26(2): 1-8.
-
Khan IA, Bakht J, Shah WA, Khan N, Ullah I (2003) Effect of seed rate on the yield and yield components of wheat under irrigated conditions of Peshawar. Asian Journal of Plant Sciences 1(5): 513-515.
-
Jaleel CA, Manivannan, P, Sankar, B, Kishorekumar A, Gopi R, et al. (2007) Water deficit stress mitigation by calcium chloride in Catharanthus roseus; effects on oxidative stress, proline metabolism and indole alkaloid accumulation. Colloids Surf B Biointerfaces 60(1): 110- 116.
-
Abdulkerim J, Tana T, Eticha F (2015) Response of Bread Wheat _(Triticum aestivum L.)_ Varieties to Plant population levels at Kulumsa, South Eastern Ethiopia. Asian Journal of Plant Sciences 14(2): 50-58.
-
Bromm J, Wendy A, Boudreau S, Entz M, Shirtliffe S (2006) Seeding rate for weed control in organic spring wheat. Organic Agriculture Center of Canada, Final Research Report E-2006-08.
-
Vandercasteelen J, Dereje M, Minten B, Taffesse AS (2013) Scaling-up adoption of improved technologies: The impact of the promotion of row planting on farmers’ tef yields in Ethiopia. LICOS Centre for Institutions and Economic Performance.
-
Silva JV, Reidsma P, Baudron F, Jaleta M, Tesfaye K, et al. (2021) Wheat yield gaps across smallholder farming systems in Ethiopia. Agronomy for Sustainable Development 41: 12.
-
Khan AZ, Khan H, Khan R, Ghoneim A, Ebid A (2002) Effect of sowing date & seed rates on yield & yield components of wheat. Trendsin Applied Sci Res 2(6): 529-534.
-
Khan MA, Anwar J, Sattar A, Akhtar MA (2001) Effect of seed rate on wheat yield under different sowing dates & row spacing. J Agric Res 39(3-4): 223-229.
-
Khurana E, Singh JS (2000) Influence of seed size on seedling growth of _Albizia procera_ under different soil water levels. Ann Bot 86(6): 1185-1192.
-
Kitajima K (2003) Impact of cotyledon and leaf removal on seedling survival in three trees pecies with contrasting cotyledon functions. Biotropica 35(3): 429-434.
-
Kumar D, Seth R (2004) Seed yield response of fodder cowpea (Vigna unguiculata (L.) Walp) varieties to varying seed rate and seed size. Seed Res 32: 149- 153.
-
Lima ER, Santiago AS, Araujo AP, Teixeira MG (2005) Effects of the size of sown seed on growth and yield of common bean cultivars of different seed sizes. Brazil J Plant Physiol 17(3): 273-281.
-
Lollato RP, Diaz DAR, DeWolf E, Knapp M, Peterson DE, (2019) Agronomic practices for reducing wheat yield gaps: a quantitative appraisal of progressive producers. Crop Sci 59(1): 333-350.
-
Mehrvar MR, Asadi H (2006) Agronomical & economical assessment of planting methods and seeding rates in irrigated wheat _(Triticum aestivum_ L.). J Agron 5(4): 626-633.
-
Malik MA, Irfan M, Ahmed ZI, Zahoor F (2006). Residual effect of summer grain legumes on yield and yield components of wheat (_Triticum aestivum_ L.) Pakistan Journal of Agriculture, Agricultural Engineering and Veterinary Sciences (Pakistan).
-
Mehring GH (2016) Determining optimum seeding rates for diverse hard red spring wheat (Triticum aestivum L.) cultivars. Dissertation thesis.
-
Mingsheng F, Shen J, Yuan L, Jiang R, Chen X, et al. (2011) Improving crop productivity and resource use efficiency to ensure food security and environmental quality in China. Journal of Experimental Botany 63(1): 13-24.
-
MoA (Ministry of Agriculture of the Federal Democratic Republic of Ethiopia) (2015) Technological Package for wheat production: A Training Manual for Development Practitioners. Addis Ababa, Ethiopia.
-
MANR (2016) Plant Variety Release, Protection and Seed Quality Control Directorate. Addis Ababa, Ethiopia, Crop Variety Register 19: 1-330.
-
Hosseini NM, Ellis RH, Samadi BY (2010) Effects of Plant Population Population on Yield and Yield Components of Eight Isolines of cv. Clark (glycine max L.). J Agric Sci Technology 3: 131-139.
-
Nazir MS, Jabbar A, Waheed Z, Gaffar A, Aslam M (2000) Response of late sown wheat to seeding population and nitrogen management. Pak J Biol Sci 3(6): 998-1001.
-
Mango N, Makate C, Tamene L, Mponela P, Ndengu G (2020) Impact of the adoption of conservation practices on cereal consumption in a maize-based farming system in the Chinyanja Triangle, Southern Africa. Sustainable Futures 2: 100014.
-
Nik MM, Babaeian M, Tavassoli A (2011) Effect of seed size and genotype on germination characteristic and seed nutrient content of wheat. Scientific Research and Essays 6(9): 2019-2025.
-
Olsen J, Kristensen L, Weiner J, Griepentrog HW (2005) Increased population and spatial uniformity increase weed suppression by spring wheat (_Triticum aestivum_). Weed Research 45(4): 316-321.
-
Bautista RJP, Espinosa NH, Jones JM, Guzman C, Braun HJ (2017) CIMMYT Series on Carbohydrates, Wheat, Grains, and Health: Wheat-Based Foods: Their Global and Regional Importance in the Food Supply, Nutrition, and Health1,2.
-
Tigabu R, Asfaw F (2016) Effects of Seed Rate and Row Spacing on Yield and Yield Components of Bread Wheat (Triticum aestivum L.) in Dalbo Awtaru Woreda, Wolaita Zone, Southern Ethiopia. Journal of Biology, Agriculture and Healthcare 6(7): 1-10.
-
Edreira JIR, Mourtzinis S, Conley SP, Roth AC, Ciampitti IA, et al. (2017) Assessing causes of yield gaps in agricultural areas with diversity in climate and soils. Agric Forest Meteorol 247: 170-180.
-
Furtas R (2018) Overview of Certified Seed and Farmer Saved Seed. Economic and Competitiveness Branch.
-
Shewry PR, D’Ovidio R, Lafiandra D, Jenkins JA, Mills ENC, et al. (2009) Wheat Grain Proteins. In: Khan K, Shewry PR (Eds.), Wheat. St. Paul, AACC International, pp: 223-298.
-
Shock CC, Feibert EBG, Saunders LD (1998) Onion yield and quality affected by soil water potential as irrigation threshold. HortScience 33(7): 1188-1191.
-
Tanveer SK, Hussain I, Sohail M, Kissana NS, Abbas SG (2003) Effects of different planting methods on yield and yield components of wheat. Asian Journal of Plant Science 2(10): 811-813.
-
Simmone R, Steege HT, Werger M, (2000) Survival and growth in gaps: A case study for tree seedlings of 8 species in the Guyanese tropical rainforest in seed seedlings and gap size matters. Troplenbos-Guyana Programmes, Guyana.
-
Slot M, Palow DT, Kitajima K (2013) Seed reserve dependency of _Leucaenaleucocephala_ seedling growth for nitrogen and phosphorus. Funct Plant Biol 40(3): 244-250.
-
Slukova M, Levkova J, Michalcova A, Horackova S, Skrivan P (2017) Effect of the Dough Mixing Process on the Quality of Wheat Buckwheat Proteins.
-
Staggenborg SA, Whitney DA (2003) Seeding and Nitrogen rates required to optimize winter wheat yields following grain sorghum & soybean. Agron J 95(2): 253- 259.
-
Stobbe E, Moes J, Gan Y, Ngoma H, Bourgeca L (2008) Seeds, seed vigor and seeding research report. Department of Plant Science, NDSU Agriculture and University Extension, North Dakota, USA.
-
Stougaard RN, Xue Q (2005) Spring wheat seed size and seedling rate effects on _avena fatua_ iterference. Economic returns and economic thresholds. Weed Res 45(5): 351-360.
-
Tanner DG, Gorfu A, Taa A (1993) Fertiliser effects on sustainability in the wheat-based small-holder farming systems of southeastern Ethiopia. Field Crops Res 33(3): 235-248.
-
Bezabih T (2012) Study on Intensity and Adoption of Improved Wheat Varieties and Associated Agronomic Practices in Kaffa Zone, The Case of Gesha Woreda. St Mary’s University.
-
Tuino SD, Korejo MN, Jarwar AD, Waggan MR (2006) Studies on indigenous and exotic weed competition in wheat. Pak J Agric Engg Vet Sci 22(1): 1-8.
-
USDA (2017) World Agricultural Production. Foreign Agricultural Service, pp: 1-41.
-
Ittersum MKV, Cassman KG, Grassini P, Wolf J, Tittonell P, et al. (2013) Yield gap analysis with local to global relevance - a review. Field Crops Res 143: 4-17.
-
Ittersum MKV, Bussel LGJV, Wolf J, Grassini P, Wart JV, et al. (2016) Can sub-Saharan Africa feed itself? Proc Natl Acad Sci 113: 14964-14969.
-
Zecevic V, Boskovic J, Knezevic D, Micanovic D (2014) Effect of seeding rate on grain quality of winter wheat. Chilean J Agric Res 74(1).
-
Awdie W (2008) Effects of nitrogen and seed rates on yield and yield components of bread wheat (triticumaestivum L.) in yelmana densa district, northwestern Ethiopia. M.Sc Thesis The School of Graduate.
-
Eshete Y, Alamirew B, Bishaw Z (2021) Yield and Cost Effects of Plot Level Wheat Seed Rates and Seed Recycling Practices in the East Gojam Zone, Amhara Region, Ethiopia: Application of the Dose-Response Model.
-
Zareian A, Yari L, Hasani F, Ranjbar GH (2013) Field performance of three wheat (Triticum aestivum L.) cultivars in various seed sizes. World App Sci J 16(2): 202-206.
- Lessons to Learn: Trees are More than the Lungs of the World
- Community Forestry Enterprises as a Model for Sustainable Forest Development: The Case Of The "Baja Tarahumara" in Chihuahua, Mexico
- Ecological and Socio-Economic Impacts of Chromolaena odorata and Mesosphaerum suaveolens, Two Invasive Alien Species in Central and Southern Benin, West Africa
- Epigenetic Sustainability: Modeling the Human Factor as a Natural Resource through Science 4.0 and the NR3C1 Biological Pilot
- Growth-at-Risk: A Framework for Assessing Economic Vulnerability
- The Rural Territory as a Socioecological System for the Management of Public Policy for Sustainable Rural Development