Household Carbon Footprint: Rural and Urban Community
A significant disparity exists in the living conditions and lifestyles of people living in rural and urban India. Based on geographical location and lifestyle, an individual's contribution to the global carbon footprint has been estimated in this study. This study examines the household carbon footprint in different rural and urban regions of West Bengal. It analyzes the difference of contribution of the factors based on one’s geographical location and how an individual's socioeconomic status affects carbon footprint. Data on the consumption of goods and services resulting in GHG emissions was gathered at the household (N=243) level through a questionnaire survey in different districts of West Bengal. The average carbon footprint in rural areas is estimated to be 0.56 tones CO2e per capita per year. In urban areas, it is 2.33 tones CO2e per capita per year significant difference is found in the annual per capita carbon footprint (household, travel, lifestyle, and total carbon footprint) among the various income groups of rural and urban areas. Another significant difference is found among different monthly expenditure categories between urban and rural households. Based on the information given by the respondents of the rural and urban areas the difference regarding electricity consumption, travelling details, monthly expenditure category, type of energy used, cooking fuel, annual household, travel, and lifestyle carbon footprint have been discussed graphically. This study looked at the sectoral contribution (activity-wise, e.g., cooking, transportation, etc.) and the rural-urban disparity in the individual carbon footprint.
Introduction
The major contributors to carbon footprints are food consumption, transportation, household energy [1, 2], and livestock are responsible for a significant amount of greenhouse gas emissions [3]. In addition, transportation of foods, pesticide use, and purchasing food out of season also contribute to carbon footprints. Processed foods have higher emissions than fresh food, including transportation, factory production, and additional packaging [4, 5].
According to the CSE Report in India, current carbon-di- oxide emission is about 2.88Gt, which are projections based on the median annual rate change in past decades. The energy consumption in the buildings is a major contributor to the increasing carbon footprint through bad insulation systems, inefficient appliances, and excessive water use [6]. Various building components, residents’ behavior, awareness, and climatic conditions are associated with carbon emissions and carbon footprints [7, 8].
Researchers focused on carbon footprint [2, 9, 10, 11, 12] related to poor insulation in the buildings, individual carbon footprint (like gathering materials, production and transport), lifestyle and behavior of the citizen (awareness and economic condition), natural and other artificial sources. Another [3, 13, 14, 15, 16, 17, 18] indicates carbon footprint and greenhouse gas emission associated with:
- Socio-demographic household characteristics - household size, income and location,
- Consumer choice and parches of the product,
- Determinants of the individual such as attitudes, belief and psychological factors. This study analyzed the major carbon footprint factors in rural and urban households.
Methods and Materials
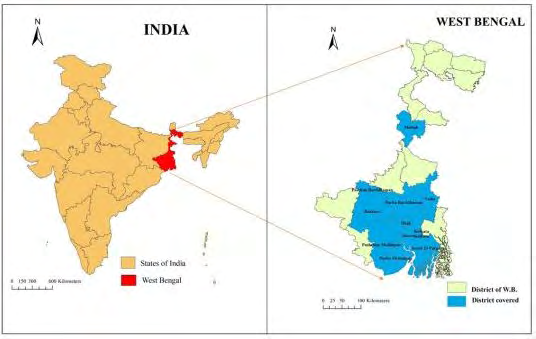
The questionnaire for this study contains four different sections such as personal Information, Household, Transport, and Secondary information. Total 260 individuals completely responded to the Google form. 17 forms have been rejected due to being incomplete and irrelevant information. Therefore, the total number of responses used in this study is 243. All the responses have been collected from various parts of West Bengal (Figure 1). The individual carbon footprint has been calculated using an online carbon footprint calculator. Sector-wise per capita annual carbon footprint in each household as well as total per capita carbon footprint is analyzed. Collected data are analyzed with the help of an online carbon footprint calculator, descriptive statistical technique, independent t-test technique and ANOVA. With the help of the gathered data, individual annual carbon footprint has been calculated using an online platform named Wildlife Conservation (including species and habitats) using Geospatial Techniques, hosted by WWF-India, New Delhi and, sponsored by the Ministry of Environment, Forest and Climate Change, Government of India (http://www.wwfenvis.nic.in/KidsCentre). Using its carbon footprint calculator features all the necessary information about the respondents have been put in each sector of the calculator, and finally got sector-wise per capita annual carbon footprint as well as total carbon footprint.
Results
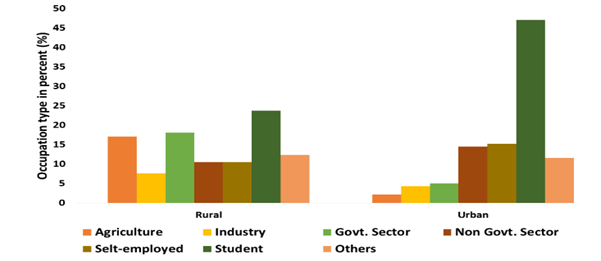
The entire study is based on different urban and rural areas of West Bengal. Total 243 responses have been collected; 105 responses are from rural areas, whereas 138 responses are from urban areas. The study mainly covers seven occupation types (Figure 2) of occupation (e.g., agriculture, industry, govt. sector, non-govt. sector, self- employed, student, and others). ~17.1% of the respondents is from an agricultural field in rural areas, whereas ~2.2% of occupants falls under agricultural fields in urban areas because agriculture-related activities are higher in rural regions than urban or semi-urban regions. ~7.6% people in rural areas and ~4.4% people in urban areas work in the industry. The maximum individual among the respondents is a student in both rural (~23.8%) and urban (~47.10%) regions. As the whole study was conducted via an electronic medium, the maximum number of respondents is a student for both regions. The minimum number of responses is related to the industry in rural regions, whereas the agricultural sector in the urban area occupies the minimum share. Occupants in Govt. sector is higher in the rural area (~18.1%) compared to an urban area (~5.1%). Non-Govt. sector and self-employed have almost equal shares in rural and urban regions (~10.48% in urban areas and ~14.5%, ~15.2% in rural areas, respectively). ~12.4% from the rural area and ~11.6% from the urban area fall under the “others” category of occupation.
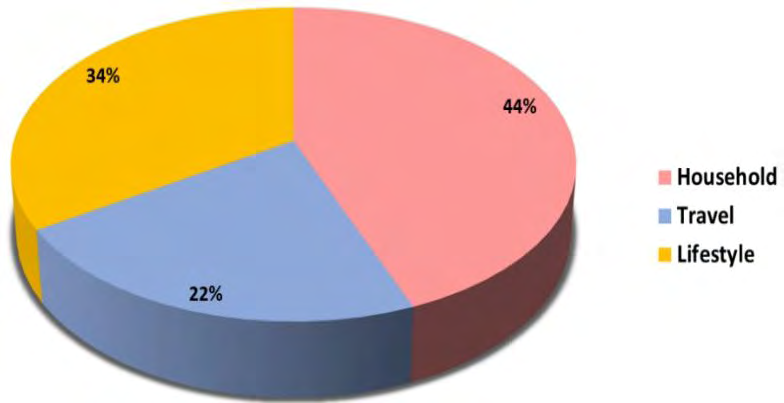
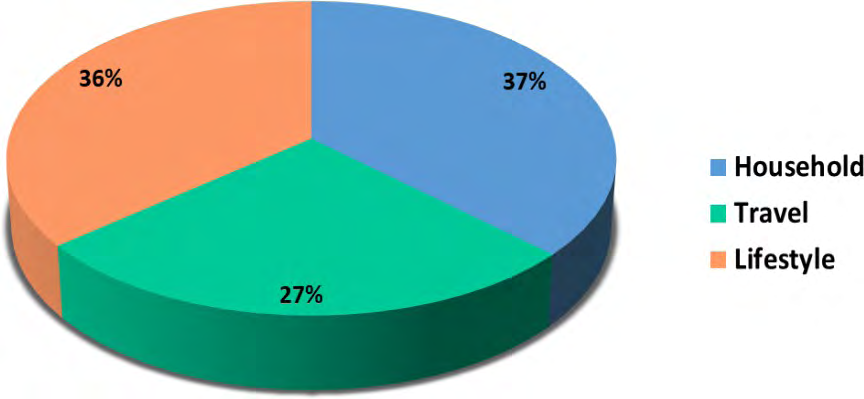
Figures 3 & 4 depicted the relative contribution of the various sources to the total the carbon footprint for a typical household in the rural and urban areas. It clearly defined that in the rural area, the contribution to the carbon footprint is highest (~44%) due to household activities (majorly electricity consumption, cooking fuel, etc.). Travelling and lifestyle-related activities occupied ~22% and ~34%, respectively. Here lifestyle-related activities denote various sectors where an individual spends his income annually. Lifestyle-related activities include food and drinks, pharmaceuticals, clothes, textiles, Paper-based products, electronic equipment, education, telephone, mobile costs, etc. In urban areas maximum share of the total carbon footprint is released by household activities (~37%). ~27% occupied by travelling and ~36% occupied by lifestyle-related activities. It is observed that the contribution of household- related activities to the total carbon the footprint is higher in rural areas compared to urban areas. This is mainly because of the differentiation in the use of cooking fuel. Household in rural areas majorly depends on the fossil fuel for cooking purposes, which can generate a large amount of greenhouse gases. Transportation facility in terms of personal vehicle or public vehicle availability is anyhow greater in an urban area compared to rural areas. So, it is quite evident that the contribution of travelling to the total carbon footprint is high in urban areas. Availability of the basic amenities as well as developed lifestyles contributed a higher the carbon footprint to the urban dwellers.
The diagram (Figure 5) depicts that the different types of energy used in the rural household daily for cooking and other purposes. Among all the responses from the rural area, many of them indicate the use of several types of energy daily in their household. Maximum people use coal (~80.9%) daily, mainly for cooking purposes. ~74.3% of people use electricity in their daily life. As rural India is developing day by day, the availability of electricity in each household is quite a natural thing nowadays. Despite several rural areas do not have electricity in their daily lives until now. ~48.57% of households use heating oil regularly (mainly kerosene). Cow dung and wood was used by ~57.1% and ~40.9% of rural households, respectively. LPG is used by ~44.8% of households in rural areas. As govt. initiate several schemes of distribution of LPG cylinders for low-income group people, therefore the use of LPG in rural areas is increasing day by day. Less than ~10% of people use solar energy and natural gas in their daily life because of lack of availability. Rural households are the major contributors to the total carbon footprints in terms of energy used daily. Rural living is mainly relying on coal, wood, cow dung heating oil, etc. for cooking and other purposes and they are one of the greatest sources of carbon emission.
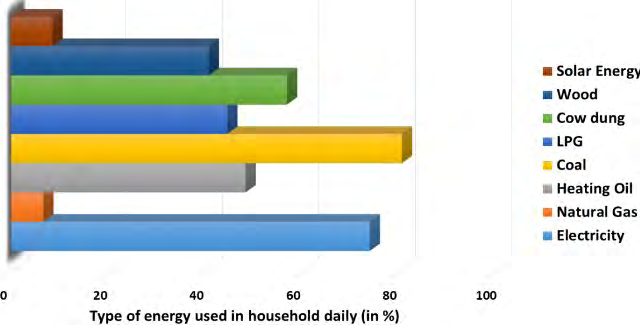
Figure 6 shows the different types of energy used in the urban household daily for cooking and other purposes. In this study, ~100% of people in the urban area used electricity as a type of energy in everyday life. Maximum households use LPG (~79.7%) as the main cooking fuel daily. Use of coal, cow dung, wood, etc. (less than 10%) in their everyday life is very less compared to the rural communities. Heating oil and natural gas are used by ~21.7% and ~12.7% of households, respectively. ~15.9% of households use solar energy in everyday life. The use of solar energy in urban communities is increasing due to the development of various technologies and their inclination towards green energy.
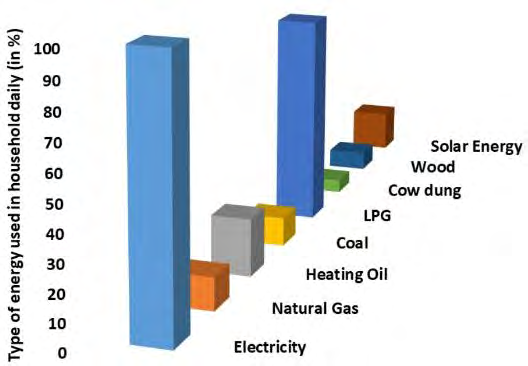
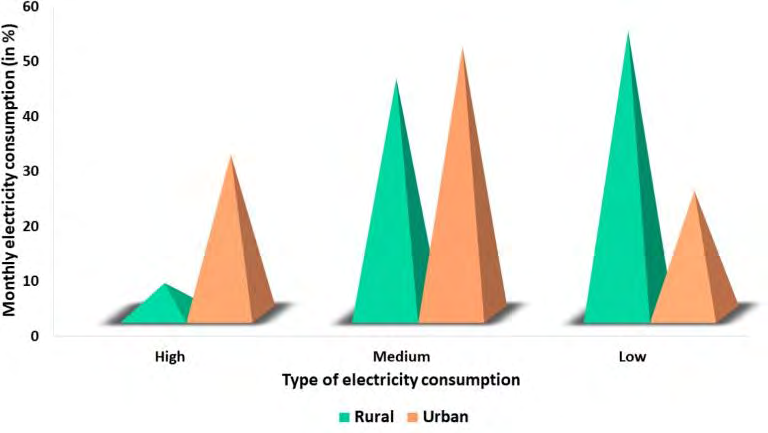
Figure 7 depicted the electricity consumption pattern among rural and urban areas of West Bengal. Electricity consumption has been categorized into three type’s high, medium, and low electricity consumption. High consumption represents above ~300 kWh electricity consumption per month, and the monthly electricity bill for a high consumption rate is ~1500 rupees and above. Maximum high consumption of electricity observed in urban households. This is due to the excess use of heavy electrical equipment (e.g., air-conditioner, refrigerator, television, washing machine, microwave, etc.) daily in urban lifestyle. Medium consumption of electricity varies between ~100-300kWh per month, and the bill ranges between ~500-1500 rupees monthly. Urban households have a maximum, medium electricity consumption pattern. Lastly, the low electricity consumption rate is below 100kWh monthly, and the bill amount is ~below 500 rupees per month. Rural households have low electricity consumption in the maximum household. Table 1 depicted the comparison of the monthly expenditure between two communities on various categories of lifestyle activities (Food and drink products, Pharmaceuticals, Clothes, textiles and shoes, Paper- based products, Television, radio and phone, education, etc.). Maximum variables of monthly expenditure differed significantly between rural and urban areas.
| Independent Sample Test | |||||
|---|---|---|---|---|---|
| Urban (N=138) | Rural (N=105) | Levene’s test | t test (df=1, 241) | ||
| Mean( ±SD) | Mean( ±SD) | F value | t | Level of significance | |
| Food and drinkp roducts | 3.1(±1.4) | 3.4(±0.9) | 25.5 p<0.001 | -2.1 | (p<0.05) |
| Pharmaceuticals | 2.1(±1.4) | 2.0(±0.9) | 9.5 p<0.01 | .58 | NS* |
| Clothes, textiles, a nd shoes | 2.1(±1.1) | 1.9(±0.8) | 9.1 p<0.01 | 1.1 | NS* |
| Paper-basedp roducts | 1.3(±1.1) | 1.2(±0.6) | 19.4 p<0.001 | 1.1 | NS* |
| Television, radio a nd phone (equipment) | 1.7(±1.1) | 1.2(±0.6) | 38.5 p<0.001 | 4.5 | (p<0.001) |
| Furniture ando ther manufactured goods | 1.5(±1.3) | 0.9(±0.8) | 11.3 p<0.01 | 4.1 | (p<0.001) |
| Hotels, restaurants | 1.8(±1.2) | 1.1(±0.7) | 22.3 p<0.001 | 5.6 | (p<0.001) |
| Telephone, m obile/cell phone call costs | 1.8(±1.0) | 1.5(±0.6) | 12.9 p<0.001 | 2.7 | (p<0.01) |
| Banking andf inance | 2.5(±1.7) | 1.6(±0.9) | 63.7 p<0.001 | 5.3 | (p<0.001) |
| Food and drinkp roducts | 3.1(±1.4) | 3.4(±0.9) | 25.5 p<0.001 | -2.1 | (p<0.05) |
| Banking and f inance (loan interestp ayments | 2.5(±1.7) | 1.6(±0.9) | 63.7 p<0.001 | 5.3 | (p<0.001) |
| Insurance | 2.2(±1.6) | 1.6(±1.0) | 31.8 p<0.001 | 3.9 | (p<0.05) |
| Computers and Equipmen t | 1.4(±1.2) | 1.1(±0.7) | 28.1 p<0.001 | 2.5 | (p<0.05) |
| Education | 2.6(±1.6) | 1.6(±1.3) | 6.5 p<0.05 | 5.1 | (p<0.001) |
| NS*- Not statistically significant |
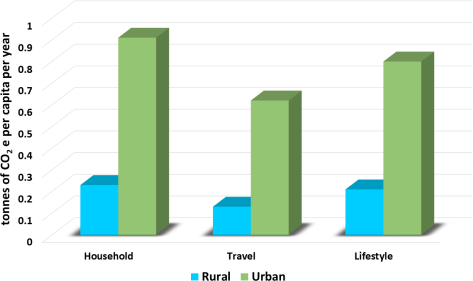
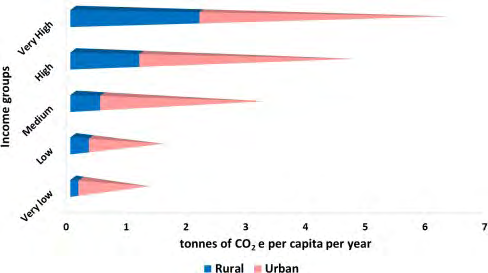
Figure 8 shows the sector-wise distribution of the annual per capita carbon footprint (tones of CO2e) in the rural and urban regions. Annually ~0.91, ~0.62, 0.8 tons of CO2 e (per capita) come from urban households, travel, and lifestyle-related activities, respectively. Also, mobility and connectivity (through mobile phones) have become essential services in urban areas. On the other hand, the annual average per capita carbon footprint from the rural household, travel, and lifestyle-related activities area ~0.23, ~0.13, ~0.21 tons of CO2e respectively. This can be easily explained by the fact that the usage of less efficient cook-stoves with wood for cooking purposes is very common in rural areas whereas, it is negligible for urban areas. The food pattern, on the other hand, can be explained by the lifestyle followed in these areas. The diet of rural people mainly consists of rice with a high CO2e emission factor compared to other food items. Whereas in urban areas people eat a variety of food, reducing the amount of rice consumed compared to rural areas.
As indicated in Figure 9, Maximum people from rural as well as urban areas are from low-income groups. As we know, the rural economy in India is not flourishing too much;
therefore, a high concentration of households belonging to low income can be seen here. Urban centers are highly populated nowadays as many people come to the cities for livelihood. Therefore, there is more variability in the socio- economic statuses in an urban area compared to a rural area because of the wide distribution of income among the population. From the graph, it can be observed that the number of respondents of each income group is higher in urban areas compared to rural areas except for the low- income group. As the whole the survey was conducted via an electronic medium; this can also be a reason for a higher the concentration of respondents from various income groups in urban areas.
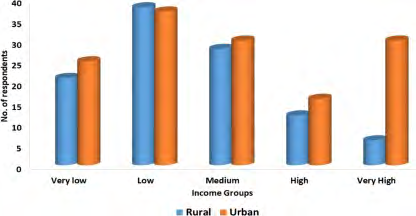
Figure 10 shows the average annual carbon footprint across various income groups in rural and urban areas. There is more variability in the socio-economic statuses in an urban area compared to a rural area because of the wide distribution of income among the population. Based on the collected information, the data is divided into five incomes groups ranging from very low to very high. Below 50000 rupees per annum income is termed as a very low-income group. The average carbon footprint among the very low- income group in the rural area is ~0.13 (tones of CO2 per capita per year) and ~1.15 (tones of CO2 per capita per year) in urban areas. The low-income group occupied 0.3 and ~1.22 (tones of CO2 per capita per year) in rural and urban areas, respectively. The rest of the income groups (medium, high, and very high) in urban areas have a comparatively higher annual per capita carbon footprint in terms of rural communities.
The diagram (Figure 11a) shows the sector-wise contribution of the annual carbon footprint among various income groups in rural regions. from the graph, it can be clearly said that the very high-income group (above 5 lakh) in rural areas occupies the highest amount of carbon footprint annually in terms of lifestyle (~0.95 tones of CO2 e per capita per year), household activities (0.62 tons of CO2e per capita per year) and travelling (~0.57 tons of CO2e per capita per year). In India rate of living always depends on the socio- economic status. Very high-income groups in rural areas can afford way more amenities compared to the other income groups. Therefore, their contribution to the annual per capita carbon footprint is higher, followed by high, medium, low, and very low-income groups. Among all income groups, maximum carbon footprint comes from household- related activities, which majorly focused on electricity consumption and the use of cooking fuel. Lifestyle-related activities hold higher shares in annual carbon footprint compared to travelling in rural communities. On the other hand, Figure 11b shows the sector-wise contribution of annual carbon footprint among various income groups in urban areas. In (a) the urban area, most of the people have personal vehicles, and a large number of them use public transport as well for commuting to their workplaces. The distance travelled is also significantly longer than that by the rural population.
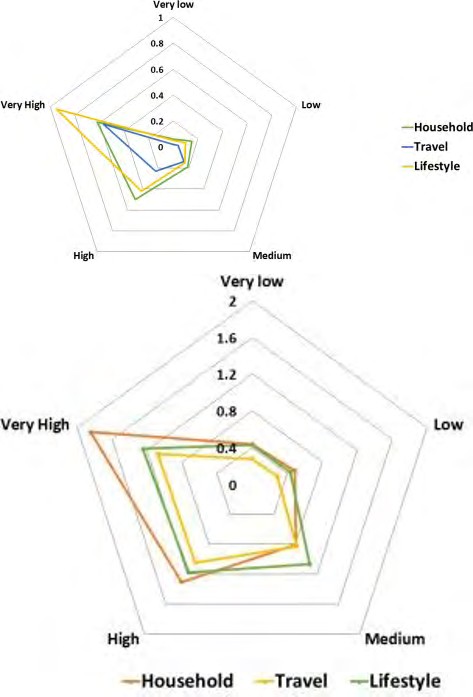
(b)
Therefore, the annual carbon footprint from travelling across all income groups in urban areas is much higher than in rural areas. Highest shares of the carbon footprint from travelling held by the very high-income group (~1.08 tons of CO2e per capita per Year). The very high-income group also occupies the most significant shares of annual carbon footprint in terms of lifestyle-related activities and household activities. The diet of the urban people consists of a much larger variety than rural people. LPG is the major cooking fuel. Urban lifestyle is way more developed than rural communities. Therefore, all the income groups in urban areas contributed a larger carbon footprint towards the environment. Using the One-way ANOVA test (Table 2), the statistical analysis indicated that the carbon footprint per capita per year (household, travel, lifestyle, and total carbon footprint) differed significantly among the different income groups of urban and rural households.
| Very low (N=46) | Low (N=75) | Medium (N=58) | High (N=28) | Very High (N=36) | Analysiso f variance | |
|---|---|---|---|---|---|---|
| Mean (±SD) | Mean (±SD) | Mean (±SD) | Mean (±SD) | Mean( ±SD) | F value (df= 4,238) | |
| Household Carbon Footprint (tones of CO e per capita per year) 2 | 0.3 (±0.2) | 0.3 (±0.2) | 0.5 (±0.3) | 0.9 (±0.5) | 1.6 (±0.5) | 114.9 (p<0.001) |
| Travel Carbon | 0.2 | 0.2 | 0.5 | 0.6 | 0.9 | 59.6 |
| Footprint (tones of CO e per capita per year) 2 | (±0.2) | (±0.1) | (±0.4) | (±0.5) | (±0.3) | (p<0.01) |
| Lifestyle Carbon Footprint (tones of CO e per capita per year) 2 | 0.3 (±0.2) | 0.3 (±0.2) | 0.6 (±0.5) | 0.7 (±0.4) | 1.2 (±0.3) | 55.4 (p<0.001) |
| Total Carbon Footprint (tones of CO e per capita per year) 2 | 0.8 (±0.5) | 0.8 (±0.5) | 1.5 (±1.1) | 2.2 (±1.2) | 3.8 (±0.9) | 91.4 (p<0.01) |
Table 2: Carbon footprint (per capita per year) among the different income groups of rural and urban communities.
Discussion
The goal of this study is to identify the primary factors that contribute to carbon footprint in the home, travel, and lifestyle activities [13]. The survey primarily covers 11 districts of West Bengal. A total of 243 replies have been gathered, with 105 responses coming from rural areas and 138 from urban areas. The study focuses on seven types of occupations (agricultural, industry, government, non-government, self- employed, student, and others) in both regions. Household activities (primarily electricity consumption, cooking fuel, etc.) contribute the most to carbon footprint in both rural and urban areas (~44% and 37% percent, respectively), but rural communities have a greater share of a household carbon footprint than urban communities in terms of total carbon footprint (tones of CO2e per capita per year). This is primarily due to differences in cooking fuel usage. Households in rural areas rely heavily on fossil fuels for cooking, which emits a significant quantity of greenhouse gases. In terms of personal automobile or public vehicle availability, urban areas have a slight advantage over rural areas. As a result, travel contributes a significant portion of the total carbon footprint in metropolitan regions. The availability of basic utilities, as well as a developed lifestyle, contributed to urban people having a bigger carbon footprint. The majority of individuals (~80.9%) use coal regularly, primarily for cooking in rural households, ~74.3% of people use electricity in their daily lives. In everyday life, ~100% of people in metropolitan areas use electricity as an energy source. That is evidenced by a developed lifestyle and facilities. Daily, the majority of urban households (~79.7%) utilize LPG as their primary cooking fuel. Therefore, the major factors of carbon footprint are electricity consumption and cooking fuel which are related to the household carbon footprint. Maximum variables of monthly expenditure differed significantly between rural and urban areas. Overall, this study focused on identifying the primary factors of carbon footprint in rural and urban households. In this study, the average total carbon footprint of urban dwellers is ~2.33 (tones of CO2 e per capita per year). In contrast, the average rural per capita total carbon footprint is ~0.56 (tones of CO2 e per capita per year). The average footprint for people in India is ~1.73 tones, and the average worldwide carbon footprint is about 4.8 tones. The world target by 2050 is 0 tones of CO2 e per capita per year. Due to household activities, travel, and lifestyle-related activities, the carbon footprint is much higher for urban areas than rural areas. This reflects the urban lifestyle that depends on electricity as the lifeline. Also, mobility and connectivity (through mobile phones) have become essential services in urban areas. There is more variability in the socio-economic statuses in an urban area compared to a rural area because of the wide distribution of income among the population. All income groups (very low, low, medium, high, and very high) in urban areas have a comparatively higher annual per capita carbon footprint in terms of rural communities. In India, the rate of living always depends on the socio-economic status. Very high-income groups in rural and urban areas can afford way more amenities than the other income groups. Therefore, their annual per capita carbon footprint contributes higher, followed by high, medium, low, and very low-income groups. From the result of statistical testing, there are significant differences in household, travel, lifestyle, and total carbon footprint across various income groups have been established in this study. A significant difference can be observed between all the groups except between very low, medium, medium, and high in terms of total carbon footprint (tones of CO2 e per capita per year).
Conclusion
The study is based on a subjective evaluation of each person’s carbon footprint in rural and urban locations throughout West Bengal. The carbon footprint has risen to prominence as a major source of greenhouse gas emissions. Food, consumption, transportation, and domestic energy are the key contributions to the carbon footprint. This understanding has helped bring carbon awareness to homes and make civil society aware of how much their activities contribute to global warming. Because India’s total energy usage is substantially lower than that of other developed nations, its per capita carbon footprint is smaller than anywhere else in the world. As a result, adopting sustainable energy use must be considered as a required and complementary approach to lowering CO2 emissions via managing energy consumption. A greater emphasis should be placed on creating and producing extremely energy- efficient technology or renewable energy-based items that can be used by the general public without disrupting their way of life.
Acknowledgement
The authors appreciatively acknowledge the kind permission of the Vice-Chancellor of the University in undertaking the study. Partial financial support of the Government of West Bengal (India) under Swami Vivekananda Merit cum Means Scholarship is gratefully acknowledged.
Conflict of Interest
Author declared that no conflict of interest
References
-
Wiedmann T, Minx J (2008) A definition of ‘carbon footprint’. Ecological economics research trends, 1: 1-11.
-
Muller LJ, Katelhon A, Bringezu S, McCoy S, Suh S, et al. (2020) The carbon footprint of the carbon feedstock CO2. Energy & Environmental Science 13(9): 2979-2992.
-
Koide R, Kojima S, Nansai K, Lettenmeier M, Asakawa K, et al. (2021) Exploring carbon footprint reduction pathways through urban lifestyle changes: a practical approach applied to Japanese cities. Environmental Research Letters 16(8): 084001.
-
Ridhosari B, Rahman A (2020) Carbon footprint assessment at Universitas Pertamina from the scope of electricity, transportation, and waste generation: toward a green campus and promotion of environmental sustainability. Journal of Cleaner Production 246: 119172.
-
Greene S, Jia H, Domingo GR (2020) Well-to-tank carbon emissions from crude oil maritime transportation. Transportation Research Part D: Transport and Environment 88: 102587.
-
Tonn B, Hawkins B, Rose E, Marincic M (2021) Income, housing and health: Poverty in the United States through the prism of residential energy efficiency programs. Energy Research Social Science 73: 101945.
-
Fenner AE, Kibert CJ, Woo J, Morque S, Razkenari M, et al. (2018) The carbon footprint of buildings: A review of methodologies and applications. Renewable and Sustainable Energy Reviews 94: 1142-1152.
-
Nadoushani ZSM, Akbarnezhad A (2015) Effects of structural system on the life cycle carbon footprint of buildings_._ Energy and Buildings 102: 337-346.
-
Yang Y, Qu S, Cai B, Liang S, Wang Z, et al. (2020) Mapping global carbon footprint in China. Nature communications 11(1): 1-8.
-
Zhuang H, Guan J, Leu SY, Wang Y, Wang H (2020) Carbon footprint analysis of chemical enhanced primary treatment and sludge incineration for sewage treatment in Hong Kong. Journal of Cleaner Production 272: 122630.
-
Onat NC, Kucukvar M (2020) Carbon footprint of construction industry: A global review and supply chain analysis. Renewable and Sustainable Energy Reviews 124: 109783.
-
Akenji L, Chen H (2020) A framework for shaping sustainable lifestyles, determinants and strategies. UNEP, pp: 1-52.
-
Koiwanit J, Filimonau V (2021) Carbon footprint assessment of home-stays in Thailand. Resources, Conservation and Recycling 164: 105123.
-
Li Y, Zhang L (2020) Ecological efficiency management of tourism scenic spots based on carbon footprint analysis. International Journal of Low-Carbon Technologies 15(4): 550-554.
-
Yue T, Liu H, Long R, Chen H, Gan X, et al. (2020) Research trends and hotspots related to global carbon footprint based on bibliometric analysis: 2007-2018. Environ Sci Pollut Res Int 27(15): 17671-17691.
-
Aujoux C, Kotera K, Blanchard O (2021) Estimating the carbon footprint of the GRAND project, a multi-decade astrophysics experiment. Astroparticle Physics 13: 102587.
-
Jia W, Chen TD (2021) Are Individuals’ stated preferences for electric vehicles (EVs) consistent with real-world EV ownership patterns?. Transportation Research Part D: Transport and Environment 93: 102728
-
Molla MF (2021) Assessment of the Carbon Footprint Across Urban Households in Kolkata. In Habitat, Ecology and Ekistics, pp: 115-131.
- Lessons to Learn: Trees are More than the Lungs of the World
- Community Forestry Enterprises as a Model for Sustainable Forest Development: The Case Of The "Baja Tarahumara" in Chihuahua, Mexico
- Ecological and Socio-Economic Impacts of Chromolaena odorata and Mesosphaerum suaveolens, Two Invasive Alien Species in Central and Southern Benin, West Africa
- Epigenetic Sustainability: Modeling the Human Factor as a Natural Resource through Science 4.0 and the NR3C1 Biological Pilot
- Growth-at-Risk: A Framework for Assessing Economic Vulnerability
- The Rural Territory as a Socioecological System for the Management of Public Policy for Sustainable Rural Development