Production Optimization of an Eruptive Well by Using Nodal Analysis
The objective of this paper is to optimize the eruptive well X-1 of field X so that it achieves an economically profitable production rate in order to be able to increase income. The completion data, pressure-volume-temperature (PVT) data and reservoir data are used to improve the production of the well X-1 by using the nodal analysis and PIPESIM software. Several optimization scenarios are considered by varying: The diameter of the tubing, the wellhead pressure, the diameter of the flow line and the water cut. The main results show that reducing the wellhead pressure from 350 to 100 psia and increasing the flowline diameter from 2.5 to 4 inches improve the production flow rate from 850 to 2030.472 bbl /d. In economic terms, this well gives the payback period after 1 year and 9 months and a net present value (NPV) of 193,546,524 $ after 8 years.
Introduction
Hydrocarbons are produced from well that penetrate the geological formations of oil and gas. Any oil well is drilled and completed, to move oil and gas from its original location in the field to the surface [1, 2, 3, 4, 5]. Considering the reservoir, the reservoir/well connection (completion), production casing/artificial lift, surface pipe and separation equipment as a system. Hydrocarbon production will only be possible at the expense of the pressure drop from the reservoir to the separator [6, 7]. It is therefore necessary to find the optimal drawdown pressure. Optimizing oil and gas well production using well models has contributed to improve completion techniques, better efficiency and higher production with many wells [8, 9, 10, 11, 12]. These wells can be analysed using modelling techniques to assess all elements of the production system. This procedure often identifies possible modifications to the well which, if carried out will result in higher flow rates [13, 14, 15]. Overall, optimization techniques can be a great tool to verify that a problem exists and indicate that further testing is needed. This paper is carried out in order to optimize the production of a newly drilled well X-I in the field X which was put into production immediately after completion. However, after putting the well into production its initial production rate was low this could possibly be due to a high pressure at the wellhead or because of a small flow line diameter.
The objectives of this paper are: Perform the nodal analysis of the initial well, perform a sensitivity analysis on each parameter to choose the optimal parameters, increase production and make an economic assessment. Hence to have a better understanding of this paper, it is sectioned into three sections. The first section deals with the introduction.
The completion, PVT and reservoir data are presented in the second section. The third section highlights the results obtained during the analysis. The fourth section deals with the conclusion.
Material and Methods
The well-used in this study is a newly drilled well which is designated X-1 in a field X for confidential reasons. The data available to perform this work are: Completion data, reservoir data and PVT data. Completion data are presented in Tables 1-3.
| Internal Diameter (inch) | External Diameter (inch) | Grade | Depth (ft) | |
|---|---|---|---|---|
| Conductor pipe | 19 | 20 | H44 | 800 |
| Surface casing | 14.625 | 16 | D90 | 3500 |
| Intermediate casing | 12.375 | 13 | H45 | 7000 |
| Production casing | 5.92 | 7 | L80 | 8000 |
| Liner | 3 | 4.04 | H40 | 8000 and 9000 |
| Production tubing | 3 | 4.04 | L80 | 8000 |
| Packer | 7950 | |||
| Perforation | 8500 | |||
| Choke | 3 | |||
| Flow line | 2.5 | |||
| Reservoir thickness | 150 | |||
| Hole diameter | 7 |
Table 1: Completion Data.
| Reservoir Pressure | 8500 psi |
| Temperature | 200 0F |
| Productivity Index | 1.5 STB/d/psi |
| Permeability | 50 md |
| Skin | 1 |
| Drainage Radius | 1500 ft |
Table 2: Reservoir Data.
| Oil Density | 0.8 |
| Bo | 1.25 |
| GOR | 500 SCF/STB |
| Water cut | 15% |
| Model | Black oil |
| Wellhead Pressure | 350 psi |
| OAPI | 32 |
Table 3: PVT Data.
The nodal analysis, the PIPESIM software and economic analysis are used to achieve the aims of this paper.
Results
The results obtained during the analysis of data of Tables 1 to 3 are presented in this section. For a better optimization of the production of the newly drilled well X-1 in a field X two key steps must be followed: Performing the nodal analysis on the well by varying different number parameters in order to check the optimum parameters leading to the improvement of the production and an economic assessment is done to evaluate the profitability and the feasibility of the project.
Nodal Analysis
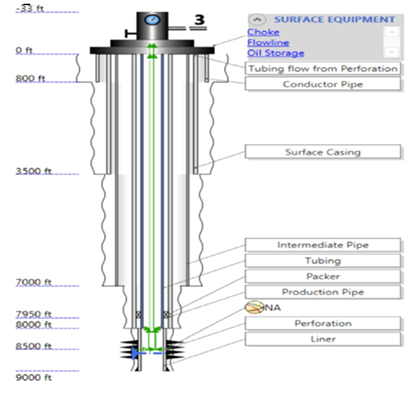
By using the completion data of Table 1, the well X-1 is designed as illustrated in Figure 1.
The flow rate produced by the well before its optimization is shown in Figure 2.
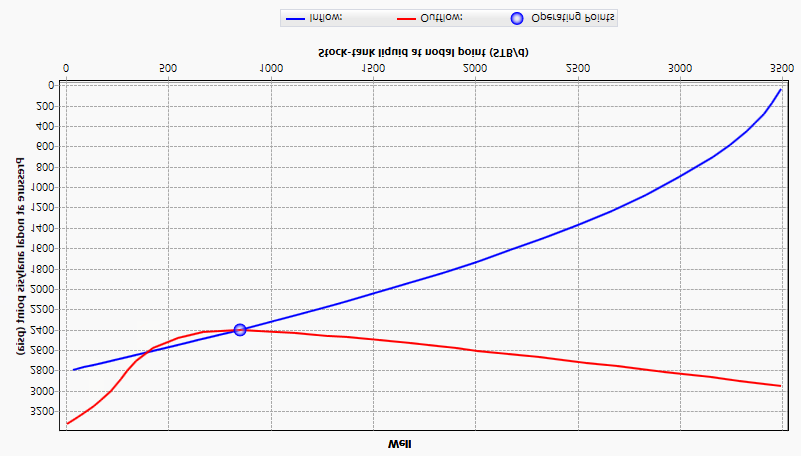
In Figure 2, the meeting point between the IPR and VLP curves gives precisely the flow rate of 850 STB/d. Table 4 shows the influence of the tubing diameter on the well.
| Flow rate (STB/d) | Pressure at the Bottom (psi) | |
|---|---|---|
| 2.5 | 778 | 2427 |
| 3 | 901 | 2365 |
| 3.5 | 969 | 2330 |
Table 4: Influence of the tubing Diameter.
In Table 4, according to the different diameter used and considering the cost of tubing and given that this variation has no great effect on the production, it is better to keep using the 3 inch tubing diameter. Figure 3 presents the influence of wellhead pressure.
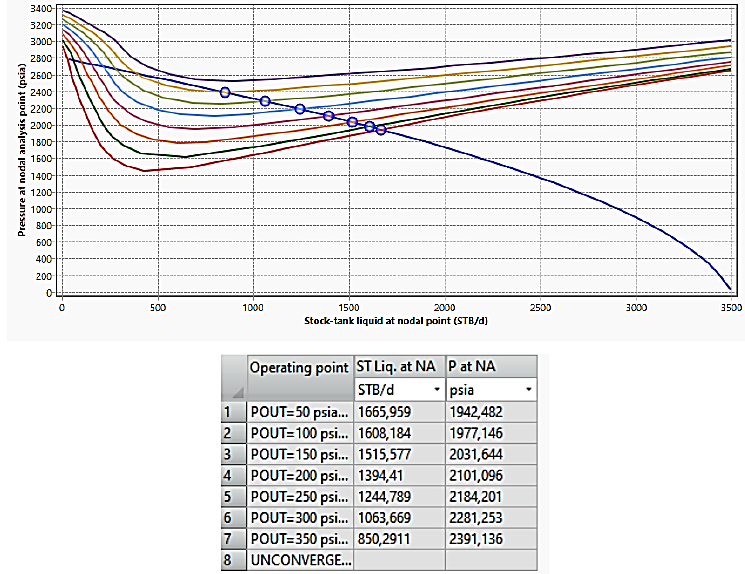
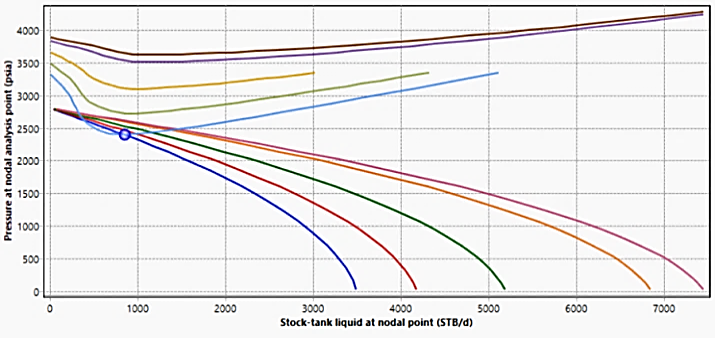
From Figure 3, the reduction of the wellhead pressure from 350 psia to 50 psia by step of 50 psia induces the increased of the production flow rate. Figure 4 shows the influence of the flow line diameter.
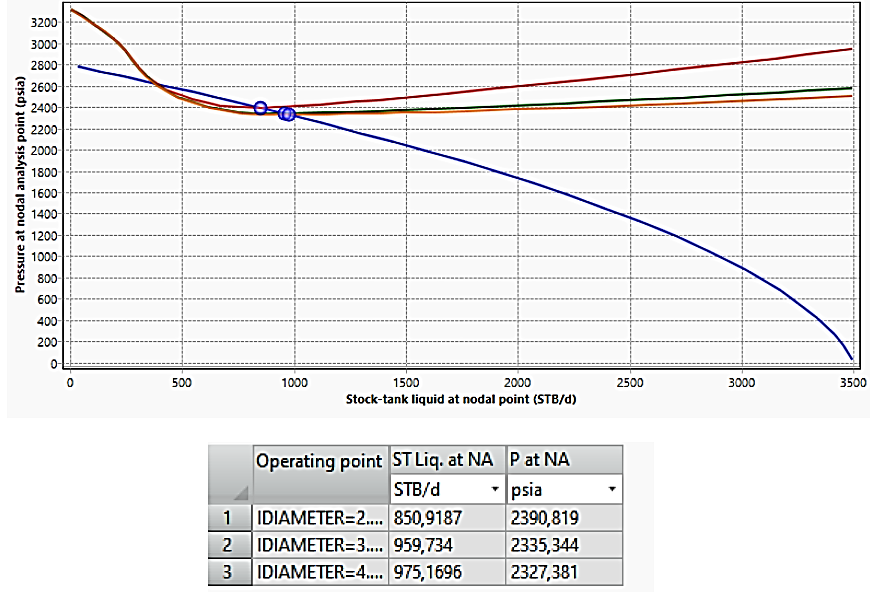
From Figure 4, the increased of the flow line diameter induces the increased of the production flow rate. Different percentages of water cut (15%, 35%, 55%, 75% and 80%) are used in Figure 5 to check its effects on the well production.
From Figure 5, it is clearly seen that as the percentage of water cut increases the production flow rate decreases. The well becomes non-eruptive when the water cut percentage reaches 35% which corresponds to a pressure of 2000 psi.
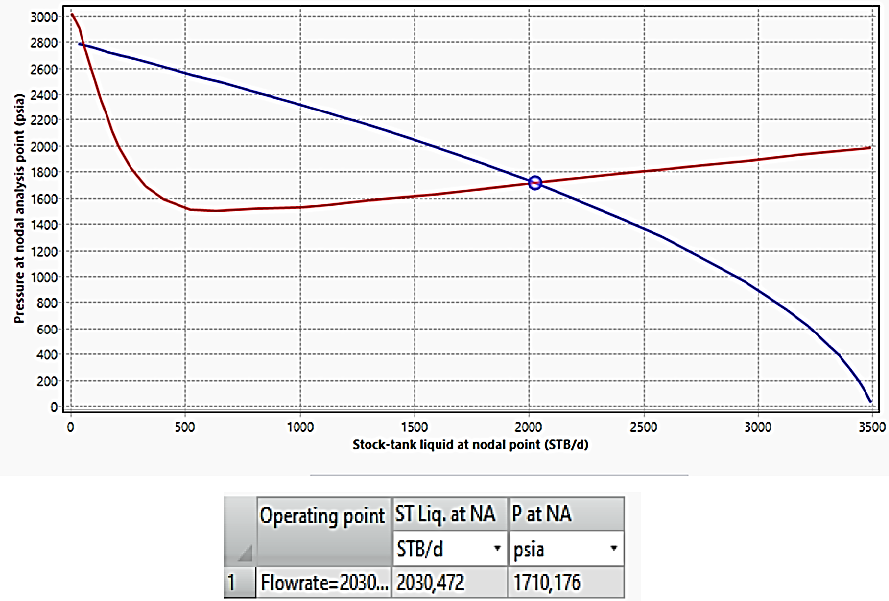
Based on Figures 3 to 5, the optimal values of the wellhead pressure of 100 psi and a flow line diameter of 4 inch used to reach the desired flow rate of 2030. 472 STB/d is illustrated in Figure 6.
Economic Analysis
The aim of this subsection is to see the profit that the company earns after performing the proposed optimization.
By using the decline model, prediction of production over the next nine years is presented in Table 5.
| T (year) | Quantity (STB/d) |
|---|---|
| 0 | 2030 |
| 1 | 1800.448487 |
| 2 | 1596.854558 |
| 3 | 1416.282942 |
| 4 | 1256..130285 |
| 5 | 1114087621 |
| 6 | 988.1070796 |
| 7 | 876.3723626 |
| 8 | 777.2725585 |
Table 5: Production flow rate values over eight years.
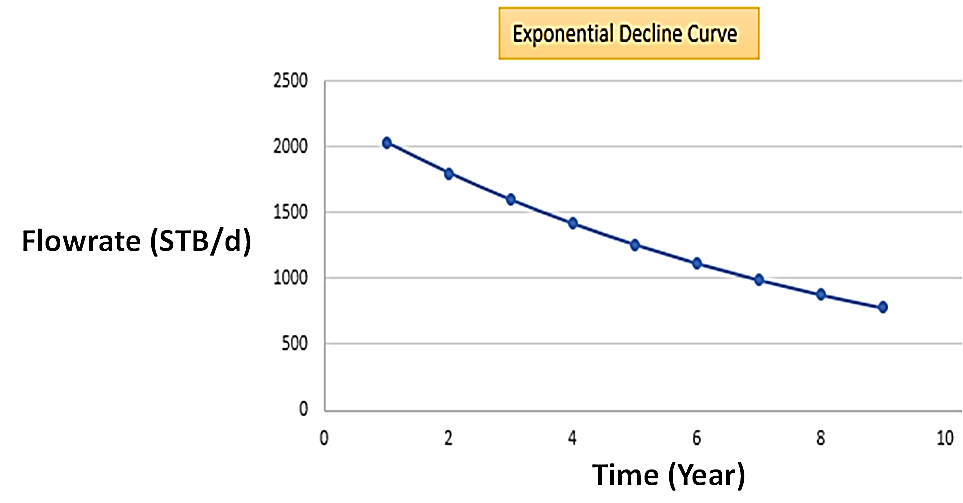
Based on the Table 5, the production flow rate prediction as function of the years is plotted in Figure 7.
Figure 7 reveals that after nine years the production flow rate moves from 2030 STB/d to 777.2725585 STB/d. It is known that for the flow rate of 850 STB/d, the well is no longer profitable. Table 6 shows the various revenues obtained from the selling price of a barrel of oil in days and years and the various expenses.
| t(Year) | Quantity (STD/d) | Revenue ($/d) | Revenue($/year) | Cost of oil ($/year) | Taxe (0.1) |
|---|---|---|---|---|---|
| 0 | 2030 | 142100 | 51866500 | 11114250 | 5186650 |
| 1 | 1800.448487 | 126031.3941 | 46001458.83 | 9857455.464 | 4600145.88 |
| 2 | 1596.854558 | 111779.8191 | 40799633.96 | 8742778.705 | 4079963.4 |
| 3 | 1416.282942 | 99139.80593 | 36186029.17 | 7754149.107 | 3618602.92 |
| 4 | 1256.130285 | 87929.11998 | 32094128.79 | 6877313.312 | 3209412.88 |
| 5 | 1114.087621 | 77986.13349 | 28464938.72 | 6099629.726 | 2846493.87 |
| 6 | 988.1070796 | 69167.49557 | 25246135.88 | 5409886.261 | 2524613.59 |
| 7 | 876.3723626 | 61346.06538 | 22391313.86 | 4798138.685 | 2239131.39 |
Table 6: Incomes and Expenses.
| Choke and flow line | Cost operation ($/year) |
|---|---|
| $500,000 | $45,000 |
Table 7: Incomes and Expenses.
The economic evaluation gives the total capex and open expenditure over the next eight years starting with year 0 which give a value of $ 89,503,615. The total income for the next eight years which gives a value of $283,050,139. The total NPV (income-expenses) on this difference which gives a value of $193,546,524 which is an economically profitable value. The payback period is equal to the expenses of the eight years on the income of one year (89,503,615/51,866,500) which gives 1.725653649 years. The company will therefore have a return on investment after a period of one year and nine months.
Conclusion
The purpose of this paper was to optimize the production flow rate of the well X-1 by using the nodal analysis method in order to have the desired flow rate. This analysis was carried out in the PIPESIM software where the completion data, reservoir data and pressure-volume-temperature data were simulated. The well X-1 being newly drilled first had a flow rate of 850 STB/d which was not sufficient and no more profitable for the company. It was then optimized in order to have a better production flow rate of 2030 STB/d desired by the company. From the results obtained, an observation is made that by increasing flow line diameter and decreasing wellhead pressure induced the increased of production flow rate. The optimal parameters found were the wellhead pressure and the flow line diameter. The wellhead pressure initially at 350 psi was dropped to 100 psi and the flow line diameter initially at 2.5 inch was increased to 4 inch in order to reach the desired flow rate of 2030 STB/d. The economic analysis revealed the payback period after 1 year 9 months and a net present value of 193,546,524$ after 8 years.
Conflicts of Interest
The authors declare that they have no competing interests.
References
-
Guo B, Lyons WC, Ghalambor A (2007) Petroleum production engineering_,_ Elsevier.
-
Sorrell S, Speirs J, Bentley R, Miller R, Thompson E (2012) Shaping the global oil peak: A review of the evidence on field sizes, reserve growth, decline rates and depletion rates. Energy 37(1): 709-724.
-
Oswald W, Harper K, Barickman P (2015) Using growth and decline factors to project VOC emissions from oil and gas production. J Air & Waste Manag Assoc 65(1): 64-73.
-
Miller RG, Sorrell SR (2014) The future of oil supply, Phil Trans R Soc A 372: 20130179-20130205.
-
Efendioglu Ergin A, Mendez J, Turkoglu H (2014) The numerical analysis of the flow and separation efficiency of a two-phase horizontal oil-gas separator with an inlet diverter and perforated plates. WIT Transactions on Engineering Sciences 82(10): 133-142.
-
Elbrir FA (2021) Sudanese Oil Field Production Performance by Nodal Analysis Technique. European Journal of Engineering and Technology Research 6(1): 95-99.
-
Sardam A, Khalid K, Las AM (2019) Optimization of Oil and Gas Production Using Nodal Analysis Technique, Design project in Engineering Department- Energy & Mechanical Engineering of The American University of Iraq, Sulaimani, As Sulaymānīyah, Iraq.
-
Beggs DH (2003) Production Optimization using Nodal Analysis_,_ 2nd (Edn.), (Tulsa, Okla: OGCI and Petroskills Publications: Tulsa).
-
Kostarev NA, Trufanova NM (2018) Simulation and automation of thermal processes in oil well. Conf Ser Mater Sci Eng 327: 052018-052023.
-
Tarom N, Hossain MM (2012) Using ANSYS to realize a semi-analytical method for predicting temperature profile in injection/production well. World Academy of Science, Engineering and Technology 72: 1006-1015.
-
Dmour HN (2013) Optimization of Well Production System by NODAL Analysis Technique. Petroleum Science and Technology 31(11): 1109-1122.
-
Gao J, Yao Y, Wang D, Tong H (2021) A Comprehensive Model for Simulating Supercritical-Water Flow in a Vertical Heavy-Oil Well. SPE J 26(6): 4051-4066.
-
Nyok EAA, Mostafa AME (2019) Production Optimization for Oil Wells Producing High Water Cut Using Nodal Analysis. Springer Series in Geo-mechanics and Geo- engineering.
-
Perez G, Kelkar BG (1990) A simplified Method to Predict Over-all Production Performance. Journal of Canadian Petroleum Technology 29(1): 78-85.
-
Alias NB (2012) A study of production optimization using prosper. Final year project, pp: 1-68.
- Lessons to Learn: Trees are More than the Lungs of the World
- Community Forestry Enterprises as a Model for Sustainable Forest Development: The Case Of The "Baja Tarahumara" in Chihuahua, Mexico
- Ecological and Socio-Economic Impacts of Chromolaena odorata and Mesosphaerum suaveolens, Two Invasive Alien Species in Central and Southern Benin, West Africa
- Epigenetic Sustainability: Modeling the Human Factor as a Natural Resource through Science 4.0 and the NR3C1 Biological Pilot
- Growth-at-Risk: A Framework for Assessing Economic Vulnerability
- The Rural Territory as a Socioecological System for the Management of Public Policy for Sustainable Rural Development