Optimization of Fermentation: Valorization of Vinasse: Case of the Nodiscam Distillery in Mbandjock (Cameroon)
The distillery molasses vinasse is an organo-mineral effluent which we have sought to recycle in fermentation to optimizing the fermentation and reducing its environmental impact. The vinasse produced by the NODISCAM distillery is directly discharged into the receiving environment at a daily flow rate of 120m3. The results of physicochemical analyzes show that it is acidic with a pH of 4.2; a temperature of 85.5oC at its outlet from the distillation columns. The conductivity, TDS, TA and degree Brix obtained are respectively 17349μS/cm, 8.37mg/l, 0.2oGL and 9oB; the interpretations of these parameters conclude that the vinasse is recyclable in fermentation. The five culture and fermentation tests carried out with yeast inoculum (0.1g, 0.2g, 0.3g and 0.4g) show that, for test 1 (yeast culture on vinasse) the vinasse is nutritional supplement for saccharomyces cerevisiae. Test 2 shows that the addition of a source of sugar to the previous test makes it possible to obtain an optimal yeast population necessary for fermentation, mainly for samples E6(0.3g) and E7, E8 (0.4g). Test 3 ,4 and 5 on the optimization of inputs: acid, DAP and urea show, for their part, that the addition of 0.9ml sulfuric acid during culture has the effect of prolonging the latency time of yeast the results of optimization of DAP (0.2g) without acid show that there is maximum consumption of sugar 18oB (E8) the yeast population and the rate of alcohol have values greater than or equal to the standard for all samples, a viability rate of 80,33% for sample E8 and alcohol rate after fermentation of 8oGL. Test 5 on optimization of urea show that the amount added does not really influence the results of previous test because urea is provided in part by DAP and there for optimal at 0.2g of DAP. Finally, we will say that, with recycling of the vinasse in fermentation, we optimize the fermentation in acid, DAP, urea and consequently we reduce the environmental impact of the vinasse.
Introduction
Agro-food industries around the world and in Cameroon in particular use and consume large quantities of drinking water in their processes. However, during the various production activities, large volumes of liquid effluents are generated. These effluents are wastewater, sometimes untreated and discharged in an uncontrolled manner into natural ecosystems, causing pollution in the receiving [1].
Environmental pollution, one of the major concerns today, has increased in developing countries where, unlike in industrialised countries, a large proportion of environmental pollutants are agricultural by-products considered as waste [2]. The characteristics of industrial discharge effluents vary greatly from industry to industry Wael, et al. In vinasse effluent, temperature, total dissolved solids are usually high, with levels that can be higher than those of domestic wastewater Benyakhlef M, et al. [3], with pH ranging from 4 to 13 [4]. In Mbandjock, where the NODISCAM distillery is located, we undertook to optimize the fermentation of NODISCAM by recycling the vinasse produced during fermentation in order to also reduce its environmental impact.
Materials and Methods
Physical and Chemical Analysis of Vinasse
The vinasse studied corresponds to the period between 10 May and 5 June of the 2020-2021 campaign. A daily sample (at the exit of the distillation columns) was taken and analyzed in order to monitor its variability. The quantity of vinasse rejected per day was estimated from the fermenters using the following formula: The physico-chemical parameters (temperature, pH, electrical conductivity, TDS, alcohol content and Brix degree) were measured on site according to the methodological requirements described by Rodier J, et al. [5]; Sablayrolles M, et al. [6] using A multifunction pH meter (pH/EC/TDS) of the brand HANNA series HI98129-HI98130; a probe thermometer of the brand HANNA, a boiler of the brand DUJARDIN-SALLERON and a refractometer of the brand alpha ATAGO.
4.2. Yeast Culture and Fermentation
Equipment: For the yeast cultures, 1.5liter glass beakers were used as fermentation tanks. They were cut at the top to promote oxygen supply during the process. Identical beakers were also used as fermenters. The fermenters are equipped with a small plastic pipe for the evacuation of the CO2 generated during fermentation.
The plant biomass (molasses) used came from the sugar refinery of the Cameroon Sugar Company (SOSUCAM); the biological material consisted of vinasse and PINNACLE DISTILLERS YEAST (S), the latter in freeze-dried form. The strain is Saccharomyces cerevisiae. The monitoring of the cultures and fermentations includes five parameters: the BRIX degree, the pH, the viability rate of the yeasts, the yeast population and the alcohol rate, which are measured using the following equipment A pH meter for measuring pH, a refractometer for determining Brix level, an electron microscope and the NAUBAUER hematimeter for cell count.
Methodology: Proportions of the different musts and initial concentrations of sugars in the CMs and fermenters. Two types of must were prepared: weak must for yeast culture and strong must for fermentation. The volume of must in each bioreactor being 1l, the proportions are summarized in the (below) Table 1.
| Weak must | Strong must | Tank foot | |
|---|---|---|---|
| Volume (ml) | 1000 | 625 | 375 |
| Molasses quantity (g) | 210 | 370 | / |
| Volume vinasse (ml) | 855 | 380 | / |
| Sugar concentration (oB) | 23 | 37 | 19 - 20 |
Table 1: Proportions of different musts for the tests.
Five (05) tests were performed with inoculums of 0.1g, 0.2g, 0.3g and 0.4g of yeast. The first test consisted solely of yeast culture and for tests 2, 3, 4 and 5 we carried out the culture and then the fermentation. For test 1, a single series of four samples (E1 to E4) was performed. Finally, we performed a series of 8 samples (E1 to E8) with a representative of two samples per yeast inoculum for tests 2, 3, 4, and 5.
After the preparation of the different musts, the culture was carried out in batch mode with the inputs. The yeast strain was acclimatized to the sugar substrate in each case. The cultures and fermentations took place at room temperature in the laboratory (26-29°C). The culture time was 16hours, which was necessary to obtain an optimal yeast population for fermentation. Fermentation lasted 24hours.
The different proportions and the different tests carried out for the cultures and fermentations are shown in Tables 2 & 3, respectively.
| Tests | Test 1 | Test 2 | Test 3 | Test 4 | Test 5 |
|---|---|---|---|---|---|
| Vinasse | 855ml | ||||
| Yeast | 0.1g ; 0.2 g ; 0.3g ; 0.4g | ||||
| Molasses | - | 210 g | 210 g | ||
| Acid | - | - | 0.9 ml | - | - |
| DAP | - | - | - | 0.2 g | 0.2 g |
| Urea | - | - | - | - | 0.2 g |
| pH | 4.2 | 4.5 | 4.1 | 4.5 | 4.5 |
Table 2: Composition of the culture wort for tests 1, 2, 3, 4 and 5.
| Sample N°. | E1 | E2 | E3 | E4 | E5 | E6 | E7 | E8 |
|---|---|---|---|---|---|---|---|---|
| VPC* (ml) | 375 | |||||||
| Volume of strong wort (ml) | 625 | |||||||
| Molasses quantity (g) | 370 | |||||||
| BRIX (°B) | 37 | |||||||
| pH | 4/5 |
Table 3: Composition of the Fermentation Wort from Tests 2, 3, 4 and 5.
Results and Discussions
Results
Physico-Chemical Characteristics of the Vinasse: Volume
of vinasse rejected. The average variations in the volume of vinasse produced for the period from 10 May to 5 June are presented in Figure 1-6 below:
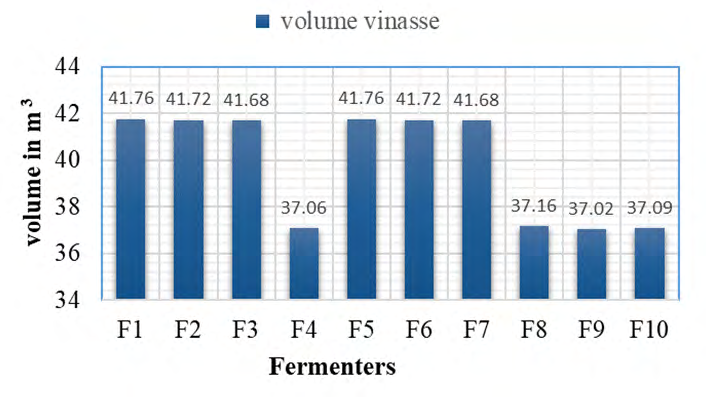
It appears from this Figure 1 that the volumes oscillate between 37m3 and 42m3. The lower value is 37.02m3 and the maximum value is 41.76m3. The fermenters F4, F8, F9 and F10 have lower volumes compared to the fermenters F1, F2, F3, F5, F6 and F7 this difference is due to the funtoning of the fermenters which is 35m3 for the fermenters F4, F8, F9, F10 against 40m3 the fermenters F1, F2, F3, F5, F6 and F7 Table 4.
Chemical characteristics of vinasse
| Parameters | Vinasse used in this study (average) | Analyses of vinasse literature |
|---|---|---|
| Temperature (°C) | 85.8 | 31 - 33 |
| pH | 4.2 | 4.3 |
| Conductivity (µS/cm) | 10930 | 4700 |
| TDS (mg/L) | 7.86 | / |
| BRIX (oB) | 9 | / |
| TA (oGL) | 0,2 | / |
Table 4: Physico-chemical analyses of the vinasses used during the study and data extracted from the following references [7-9].
Experimental Results:
- Test 1: Effect of not adding sugar
- Variation in Brix degree
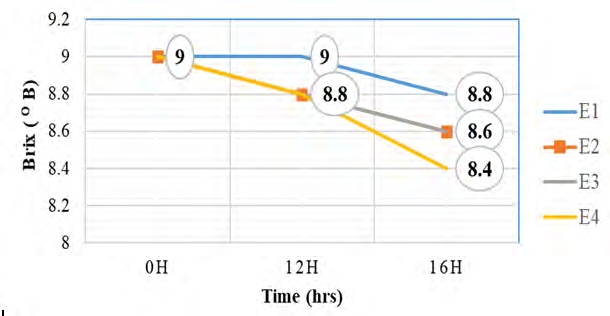
There is a slight decrease in Brix level overall (Figure 2). The Brix degree varies from 9°B to 8.8°B for sample E1, from 9°B to 8.6°B for samples E2, E3 and from 9 °B to 8.4 °B for sample E4. The yeast consumes sugar by the yeast.
• Variation in the yeast population
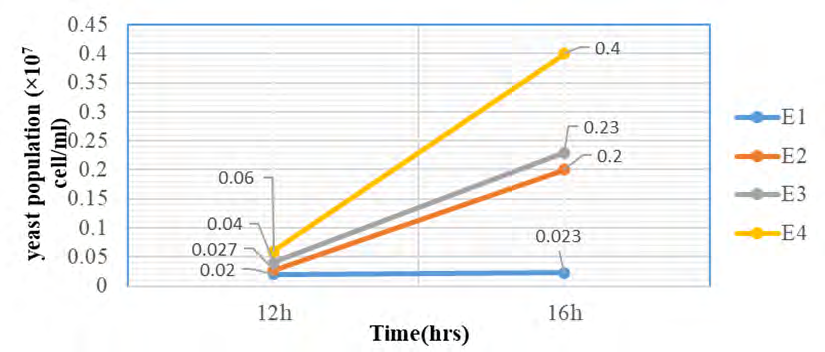
It can be seen from this Figure 3 that the population is almost stable for sample E1 (0.02×10⁷ to 0.023×10⁷) and varies considerably at E2, E3 and E4.
The low variation of the yeast population at E1 is due to the fact that its lag time is high. The variations observed at E2, E3 and E4 are due to the fact that the small fraction of sugar contained in the vinasse was consumed and the cells grew. • Test 2: Effect of adding a sugar source: molasses Figure 4
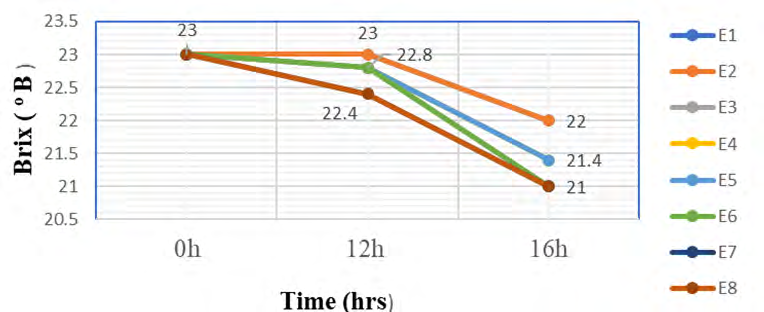
• Variation in Brix degree
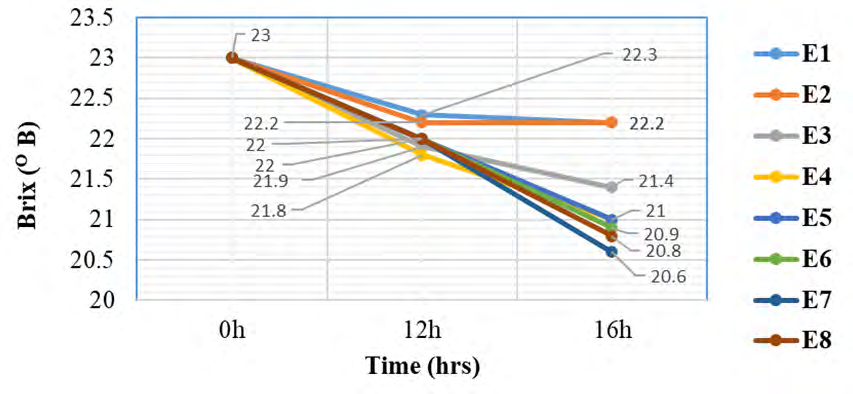
The maximum variation is from 23°B to 20.6°B for sample E7 and the minimum is observed for samples E1 and E2 (23°B to 22.2°B), followed by samples E8, E6, E4, E5 and E3 with consumptions ranging from 23 to 20.9°B, 20.8°B,
21.4°B, 21°B and 21.4°B respectively.
• Variation of the yeast population and alcohol level after culture Figure 5
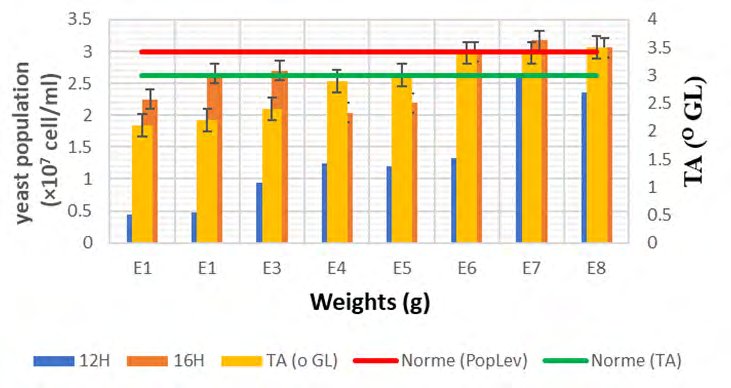
Samples E1, E2, E3, E4 and E5 have a yeast population below the norm at 16 hours of culture, i.e. 3×10⁷cells/ml, whereas samples E6, E7 and E8 have values above or equal to the norm, respectively 3× 10⁷cell/ml, 3.17× 10⁷ and 3.06× 10⁷. On the other hand, samples E1, E2, E3 and E4 have values below the standard for alcohol content, whereas samples E5 to E8 have values above or equal to the standard.
- Test 3: addition of sulphuric acid (Figure 6)
- Variation in Brix degree
The Brix values of all samples decreased slightly at 16 hours of cultivation and are lower than in the previous test. The low sugar consumption is due to the high lag time caused by the addition of sulphuric acid to the medium. • Variation in yeast population and alcohol content after culture (Figure 7).
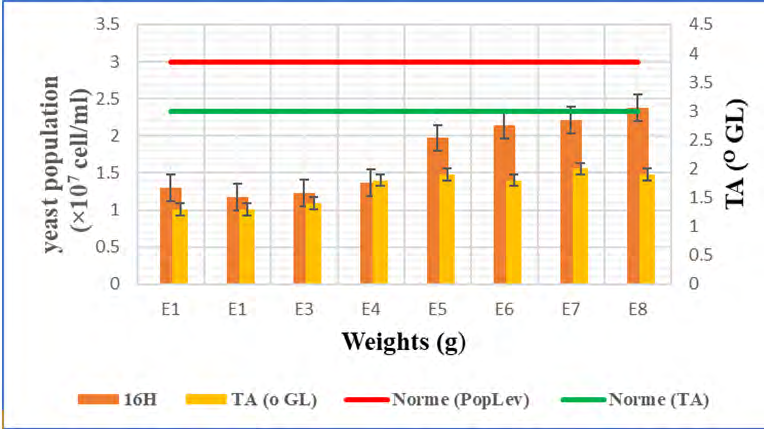
According to these results, all samples are below the standard for alcohol content (< 3°GL) and also below the standard for yeast population (< 3×10⁷cell/ml) at 16 hours of culture.
- Test 4: Addition of DAP 0.2g
- Change in viability rate

The results in Figure 8 show that the viability rate of the samples is increasing for all samples. With a maximum of 80.33% values within the standard for sample E8 and a minimum of 60.24% for sample E1 (0.1g).
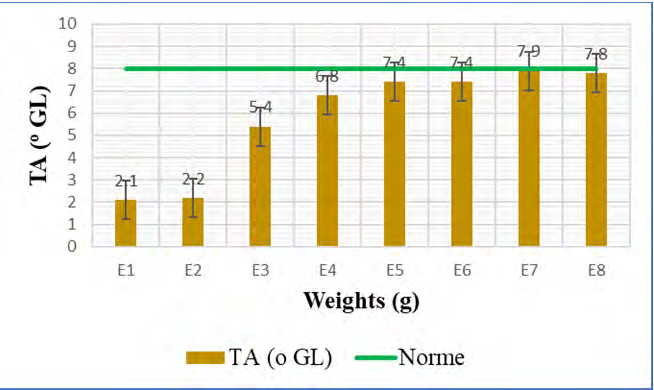
• Variation in alcohol content at the end of fermentation
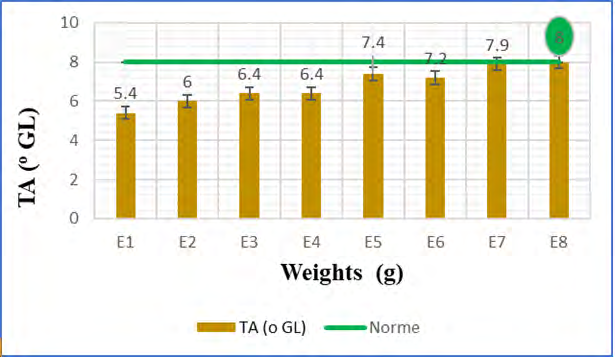
It can be seen from the Figure 9 that the maximum alcohol content is produced by sample E8 with a value of 8°GL which is within the norm (8°GL - 11°GL), whereas the rest of the samples produced an alcohol content below the norm.
• Test 5: Addition of urea 0.2g (Figure 10).
Discussions
Physico-Chemical Parameters: The quantity of vinasse is significant and justifies its recycling in fermentation: the total quantity of vinasse produced during the year is 4585.26m3 with an average of 39.83m3 per fermenter per day. This gives a daily volume of vinasse of 120m3 rejected for 3 fermenters produced per day. The high temperature of the vinasse is due to the steam (103°C) used in the wine distillation process. It does not harbour pathogenic micro-organisms and is therefore practically sterile at this temperature [2]. The acidity (Ph=4.2) of the vinasse is mainly due to the use of high amounts of concentrated sulphuric acid used in the preparation of the different musts Noukeu, et al. [9], but this pH is favourable to yeast growth and fermentation [10]. In our case, the alcohol content of the vinasse (average = 0.2°GL) is not a problem for yeast growth. The respective mean values for conductivity and TDS are 10930µS/cm and 7.86mg/L. The electrical conductivity results are different from those found by Nandy, et al. 2002 who analysed several effluents from the food processing industry in India. These results show a high mineralization due mainly to the organic load and the presence of many ions contained in the vinasse [8]. Finally, the variations in Brix degree can be explained by the fact that when the concentration of the strong must varies, this also leads to a variation in the Brix of the vinasse.
Experimental results: In test 1, it was found that the yeast found sugar and nutrients necessary for its growth in the medium (vinasse). Therefore, the vinasse was considered a nutritional supplement and a culture medium for the yeast. On the other hand, the small variations in Brix degree make it possible to assert that the proportion of fermentable sugar in the vinasse would not allow for optimal development of the yeast. [11]. For test 2, a clear difference can be observed compared to the previous test; in terms of Brix degree, the largest difference recorded is for samples E7 and E8, which contain 0.4 g of yeast. As for the yeast population, the maximum concentration allowed for fermentation was reached, as was the end-of-culture alcohol level. The addition of sulphuric acid to test 3 led to an inhibition of the yeast activity. This inhibition was reflected in the high lag time of the samples, in contrast to test 2. These results are in agreement with [10], who states that the lower the pH, the higher the production of sulphites: SO2=HSO3-=SO3 2- the equilibrium is then shifted towards the production of SO2 at low pH, SO2 being the most active against micro-organisms. Finally, the results of test 4 show that the use of DAP as a nutrient for the yeast is necessary for its metabolism and for its maximum activity. Phosphorus allows the yeast to produce cellular components such as nucleic acids but also to improve the productivity of Saccharomyces cerevisiae during ethanol production [12]. They also show that this quantity is optimal because the yeast is more productive with an alcohol content after fermentation of 8°GL and a viability rate of more than 80% for the E8 sample. Regarding the latter, the addition of urea CO(NH)2 as a nitrogen source is necessary for the cell metabolism of yeast, it is used in the synthesis of amino acids, nucleic acids as well as some vitamins, but it can react with ethanol and form ethyl carbamate, which decreases the yield [12, 13, 14, 15, 16].
Conclusion
At the end of this study, it appears that industries discharge their untreated effluents into the natural environment. It is in this context that this work, located at the heart of the problem of effluent discharges from agri- food industries, has the objective of optimizing fermentation by recovering the vinasse produced during fermentation in order to reduce the environmental pollution of waste. To achieve this overall objective, we have shown that the vinasse produced at the exit of the distillation columns and directly conveyed to the receiving environment has a daily flow rate of 120m3. The results of the physico-chemical analyses, mainly pH, conductivity, TDS, TA and alcohol content, led to the conclusion that these values are favorable to the activities of the fermenting yeast; these values are respectively 4.2, 17340µS/cm, 8.37mg/l, 0.2°GL and 9°B. The results of the different tests showed that recycling the vinasse during fermentation would first reduce the consumption of inputs (acid, DAP, urea, water) during the preparation of the different musts and also reduce the impact of the vinasse on the natural environment. The amount of inoculum that gives the best results is 0.4g/l; without the addition of acid, 0.2g/l of DAP during the yeast culture. With these values, the yeast population (values ≥3×10⁷cells /ml), the alcohol level (values ≥3°GL) and the cell viability rate (80.33%) after culture were reached; as well as the alcohol level 8°GL after 24 hours of fermentation. Overall, by recycling its vinasse produced during fermentation, the NODISCAM achieves a double gain: not only does it optimize the consumption of acid (0.0 l), DAP (0.2g/l during yeast culture; 0.26g/l during fermentation) and urea (0.2 during yeast culture). But also dispose of its waste (vinasse) wisely, reducing its environmental impact.
References
-
Noukeu N (2017) Effluents from some agri-food industries in Cameroon: characterization of the receiving environments of the coastal and central regions. Doctoral thesis. Biology of Plant Organisms. Doctoral School of Fundamental and Applied Sciences. University of Douala, Cameroon, pp: 139.
-
Phuong Thu Le (2013) Wet oxidation of alcohol distillery effluents from sugar cane in the presence of Ru and Pt catalysts supported on TiO2 or ZrO2. Catalysis, Claude Bernard University - Lyon I.
-
Benyakhlef M (2008) Study and characterization of discharges from agri-food industries with a view to saving and optimizing water circuits (Agadir Region). Thesis of Doctorate in Sciences, Faculty of Sciences of Kenitra, pp: 138.
-
Acharya BK, Mohana S, Jog R, Divecha J, Madamwar D (2010) Utilization of anaerobically treated distillery spent wash for production of cellulases under solid-state fermentation. J Environ Manage 91(10): 2019-2027.
-
Rodier J, Legube B, Merlet N, Brunet R (2009) L’analyse de l’eau : Eaux naturelles, eaux residuaires, eau de mer, 9eme Edition Dunod, Paris, France pp: 689.
-
Sablayrolles JM, Salmon JM (2005) Deroulement et contrôle de la fermentation. INRA, UMR Sciences pour L’œnologie, Montpellier, France, pp: 1-29.
-
Nandy T, Shastry S, Kaul SN (2002) Wastewater management in a cane molasses distillery involving Bioresource recovery. Journal of Environmental Management 65(1): 25-38.
-
Fonkou T (2007) Purification trials of agro-industrial wastewater by artificial swamps. Case of distillery effluents. Doctoral thesis in Plant Ecophysiology, University of Yaounde, pp: 197.
-
Noukeu NA, Gouado I, Priso RJ, Ndongo D, Taffouo VD, et al. (2016) Characterization of effluent from food processing industries and stillage treatment trial with Eichhornia crassipes (Mart.) and Panicum maximum (Jacq.). Water Resources and Industry (16): 1-18.
-
Hencke S (2000) Food use of yeasts. These de doctorat. Pharmaceutical sciences. Universite Henri Poincare - Nancy I.
-
Zerouali A, Hamami H (2019) Valorisation De La Mélasse De Canne A Sucre (raffinerie Groupe Berrahel) Pour La Production Du Bioéthanol. Mémoire de Master, Universite Abdelhamid Ibn Badis – Mostaganem.
-
Riess J (2012) Intensification of the “alcoholic fermentation” brick of beet substrates (and other substrates) for the production of ethanol.
-
Alguilera F, Peinado RA, Millan C, Ortega JM, Mauricio JC (2006) Relationship between ethanol tolerance (+)-ATPase activity and lipid composition of the plasma membrane indifferent win yeast strains; Int J food Microbiol 110(1): 34-42.
-
FAO (2012) The State of Food Insecurity in the World: Economic growth is necessary but not sufficient to accelerate reduction of hunger and malnutrition, Rome.
-
Fatima H (2020) Use of a plant resource for the production of bioethanol: case of beets. Master’s theses. Djilali Bounaama University, pp: 74.
-
Miniac De M (1988) Conduite des ateliers de fermentation alcoolique de produits (mélasses et égouts). Industries alimentaires et Agricoles 105: 675-688.
- Lessons to Learn: Trees are More than the Lungs of the World
- Community Forestry Enterprises as a Model for Sustainable Forest Development: The Case Of The "Baja Tarahumara" in Chihuahua, Mexico
- Ecological and Socio-Economic Impacts of Chromolaena odorata and Mesosphaerum suaveolens, Two Invasive Alien Species in Central and Southern Benin, West Africa
- Epigenetic Sustainability: Modeling the Human Factor as a Natural Resource through Science 4.0 and the NR3C1 Biological Pilot
- Growth-at-Risk: A Framework for Assessing Economic Vulnerability
- The Rural Territory as a Socioecological System for the Management of Public Policy for Sustainable Rural Development