Dynamic of Phosphorus in Soils Fertilized with different Phosphorus Sources and Phosphorus Acquisition by Lotus Corniculatus
The dynamic of the reaction between a clayey and sandy soil and three P-sources differing in P-solubility was study in a greenhouse experiment were Lotus corniculatus was cultivated and harvested several times during 287 days. The absorbed P by the plants with time was interpreted by an equation representing the P already present, added P, extracted P and the retained P even after the extraction by a soil-P test. The dry yield and P uptake differed between soils and for each soil among P-sources. In the clayey soil there was little difference with time between the two water soluble P-sources, both dry yield and P uptake, but in the sandy soil P uptake was significantly higher for poultry litter compared with triple superphosphate. Dry yield and P uptake were lower for phosphate rock with respect to both water soluble P-sources. In the clayey soil P uptake from the three P-sources with was mainly interpreted by the decrease of both the extracted and retained P, whereas in the sandy soil and for phosphate rock addition P uptake was described by the decrease of the retained P meanwhile extracted P was constant with time. Native P had little influence in both soil for all P-sources.
Introduction
Regular applications of phosphate (P) fertilizers are currently required to obtain maximum forage yield from most of the grassland all over the World. This is the case in Argentina where the quality and the quantity of forage yield is restricted by a marked deficiency of N, and mainly P in pasture soils [1, 2, 3]. Since P is one of the most immobile nutrients in soil, N is mobile and can be high at the beginning of the growing season when soil temperature increases.
In addition, the dependence of biological N fixation on adequate P supply makes P the principal limiting element of ecosystems [4]. Further, in P markedly deficient soils, forage plants may not respond to N fertilization [3].
The presence of legume plants increases the quality and quantity of forage [5], but they have a higher P requirement to growth comparing with the grasses [6]. Hence, a P deficiency in soil may affect legumes growth to a greater extends with respect to grasses [5].
The genus Lotus is employed for pasture around the World because its productivity and adaptability on a wide range of soils [7]. Additionally, condensed tannins in Lotus spp., prevent bloating and improve protein absorption in ruminants [8, 9]. Lotus corniculatus is important in USA [10] and New Zealand [10]. In Argentina, both L. tenuis and L. corniculatus constitute an important forage resource for beef and dairy cattle farms productions [12]. It was reported that these two Lotus species colonize the same areas and strongly respond to P addition in P deficient soils [12], but L. corniculatus has a lower expansion Vignolio [13] and requires more fertility in soils than L. tenuis that is present in a wider range of soils [12].
Much effort has been devoted to measure and to describe the relationship between plant yield and P uptake with the extracted P by soil test solutions to predict P requirements for approaching maximum plant yield. However, this relationship involves only two variables but in fact it is a multivariable problem [14]. The availability of P for plant growth is controlled by physical and chemical reactions, including sorption-desorption, precipitation-dissolution and biological processes such as immobilization and mineralization.
If P is added to a soil, a plant is then growth along a period of time and the soil is subsequently extracted by a soil test reagent, a basic equation can be written as follow pa +pn = pe+pr +pup (1) where Pa is the amount of P added, Pn is the amount of native P or P already present in soil by previous fertilizations, Pe is the amount of P extracted by the soil test reagent, Pr is the amount of added P retained by the soil and Pup is the amount of P removed from the soil by plant tissue.
The amount Pa is independent of the P-source but the solubility of the source drastically affects P availability for plant growth. Pn is affected by the elapsed time since P was added having different status associated to previous different applications with time. Pe is affected by the formulation of the soil test reagent used, time and vigor of contact between soil and P during the extraction. Pr is affected by two different reactions between soil and P. After the application of a P-source, a first rapid reaction between the soil and P in solution begins; P is adsorbed on soil clay and minerals, and its concentration in the soil solution decreases as a result of a balance between dissolved-P from the source and adsorbed-P even in presence of a soil test reagent [14]. After the first reaction a slow secondary reaction between the soil and adsorbed P takes place such that P continually diffuses into the soil solid phase [15]. Both reactions decrease the offer of P to plant roots by decreasing P-availability in the soil solution, and ultimately decreasing plant yield. Finally, Pup is affected simultaneously by the soil, the P-source applied and the plant characteristic and the period of plant growth.
The five components of Eq. (1) clearly indicate that predicting the amount Pup by a plant from a single relationship between two variables became almost impossible. There is no question that P fertilizers should be applied in most of the soils to increase pasture growth, especially in areas such as the Argentinean Pampa’s where a generalized deficient of P in soil for pasture growth is present. As the prices of P fertilizers increase, farmers tend to apply less P than is required for maximum pasture yield. Therefore, the application of other P-sources, such as phosphate rocks (PR) or poultry litter (PL) may be an economically attractive alternative to use more expensive manufactured soluble-P fertilizers such as triple super phosphate (TSP). Poultry litter (PL) is a water soluble P-source (WSP) that has been used as P-fertilizer source, both alone or composting with PR [16]. One of the disadvantages of using PL is that P concentration is variable and may be relative low (1-2 %) with respect to PR (12-16 %) or TSP (19-21 %) [17, 18], but the advantage is that is cheap and plenty available as a sub-product of poultry production.
The availability of a P-source to plants largely depends on the concentration of P and its rate of dissolution. However, the influence of soil, plant and P-source management factors may alter the availability of P to plants [19]. The rate of PR dissolution in a given soil mainly depends of the chemical composition of the PR used. Previous studies suggest that PR from Gafsa (Tunisia) is one of the more reactive PRs available in the World [19, 20]. For a single P fertilizer application with time, Perrott [21] reported that PRs of high dissolution and low P loss rates would be about the same residual value as that from WSP in the first year and then it would decrease with time.
In view of these interrelationships among variables we reported here a greenhouse experiment to study the dynamic of P applications in two soils -differing widely in properties- from three different P-sources where L. corniculatus was growth and harvested several times during 287 days after sowing. The Pup was interpreted in term of the four components of Eq. (2). Boschetti [18] used the same two soils of this work fertilized with TSP, PR and PL and reported that the labile and moderately labile inorganic P forms were markedly reduced by plant uptake, whereas the residual P forms had little changes with time. Lotus corniculatus was chosen because is currently used in Argentina and Uruguay in pastures [18], it considers one of the most important legumes after lucerne and white clover Singh [22] and its high productive and efficiency to take up P from the soil comparing with other legumes [11].
Materials and Methods
Soil collection and experimental set up
Two soils differing widely in chemical and physical properties, typically used for pastures were selected from Entre Ríos Province (Argentina). A fine neutral clayey thermic Acuic Hapludert (Vertisol) and a sandy thermic Fluvaquentic Eutrudept (Inceptisol), were surface collected (0–15 cm), air-dried, sieved by 5 mm and homogenized (Tab. 1). The criteria used to select these two soils were: L. corniculatus usually grows at field conditions, low P availability and wide difference between soils in P-sorption capacity and clay content; since these properties have a significant influence on the rate of reaction between soil and P with time.
| Soil No. | Classification | Clay (%) | Sand (%) | OM (%) | CEC (cm / (C) kg) | Exchangeable Ca Mg (cm /kg) (C) | pH H O 2 (1:2.5) | P Bray 1 (mgP/kg) | Amorphous Oxides (g/kg) Al Fe | P Sorption Capacity (mg/kg) |
|---|---|---|---|---|---|---|---|---|---|---|
| Soil 1 | Acuic Hapludert | 47 | 7 | 8.4 | 38.2 | 23.5 3.5 | 5.8 | 7.1 | 2.0 1.7 | 408 |
| Soil 2 | Fluvaquentic Eutrodept | 5 | 90 | 1.6 | 4.3 | 1.6 0.6 | 5.6 | 5.0 | 0.6 0.9 | 157 |
Table 1: Some properties of the soils used.
Pots of 1.2 L of capacity were filled and fertilized with different P-sources. Phosphorus was applied to soils at a rate of 240 mg P per pot as triple superphosphate (TSP; 20% P), phosphate rock (PR; 13% P), or poultry litter (PL; 2% P). A control treatment without P fertilizer was also included. Because of the soil density the pots contained 1.218 kg and 1.735 kg of soil for the Vertisol and Inceptisol respectively, and the doses were 197 mg P per kg of soil in the Vertisol and 138 mg P per kg of soil in the Inceptisol. The doses of P used were chosen because L. corniculatus reaches maximum yield around 100 ppm P in soil [12]. Phosphorus fertilizers were homogenously mixed with the soils and then incubated for 3 months near field capacity and at 25°C. The incubation procedure at appropriate temperatures increases the rate of reaction between soils and P permitting to study the reaction over periods that are equivalent to much longer periods at field temperatures [14]. After incubation, both fertilized and control pots were distributed in glasshouse as a completely randomized statistical design with three replications per treatment.
The PL source consisted of poultry manure and bedding material (rice hulls); this litter is widely used as P-fertilizer since Entre Ríos Province is a typical area of poultry production. The composition of PL was: N 1.8%, C 16.6%, Ca 2.1%, Mg 0.4%, and K 0.9%. The pH value of the poultry was 7.2 (water 1:2.5). The PR used was a natural rock from Gafsa (Tunez) with P 13% and Ca 32%.
Before sowing, each pot was fertilized with 180 mg K as KNO3 and K2SO4 (50/50), 60 mg Mg as MgCl.6H2O and MgSO4.7H2O (40/60), 32.2 mg N as KNO3, 0.4 mg B as H2BO3, 4.4 mg Mn as MnCl2.H2O, 4.8 mg Zn as ZnSO4.7 H2O, 1.6 mg Cu as CuCl2.7H2O, 2.4 mg Fe as FeCl3.6 H2O, and 0.1 mg Mo as Na2MoO4.2 H2O. This nutrient solution was previously used by Boschetti [18].
Lotus corniculatus was sown to have 20 plants per pot growing for 9 months. Eight cuts (the first was done 42 days after sowing and the others every 30 days) of the aerial biomass were harvested 1 cm over soil level, dried at 70°C during 48 hours, sieved and P concentration in plant tissue was determined by the following procedure: the sample of 0.5 g was ashed at 500°C for 4 h and dissolved in 1.0 mL of HCl; then, the solution was diluted to 100 mL with bi- distilled water and the concentration of P in the solution was determined by the method of Murphy and Riley [23]. We started the experience with 96 pots having 12 pots per treatment. In addition, for the second, fourth, sixth, and eighth cuts, we also harvested the root biomass in 3 of the pots per treatment; and similarly as for aerial biomass, P in roots were determined.
At sowing time and after the second, fourth, sixth and eighth cuts, the soil was sampled, air-dried, sieved (0.5 mm), and analyzed for pH and available P. Briefly, 0.5 g of soil was shaken for 16 h with 30 mL deonized water and with a strip of an anionic exchange membrane of 5 cm2 (AR204UZRA435 Ionic, Watertow, MA, USA) saturated with NaHCO3. After shaking, the membrane was cleaned with deionized water, and the P was desorbed with 10 ml 1 M NaCl for 1 h according to Coperband and Logan [24]. Inorganic P of soil extracts was determined colorimetrically by the molybdate-ascorbic acid procedure [23], and the P extracted by the anion exchange membrane (AEM) was referred to mg P by kg of soil.
Additionally, after the fourth cut and to ensure no limitations in soil for plant growth, B, Mn, Zn, Cu, Fe, and Mo were again added at the same doses as indicated above. Besides, 492 mg N, 360 mg Ca, 300 mg K, and 86 mg S per pot were added in 14 applications as Ca (NO₃)₂.4H₂O, NH₄NO₃, KNO₃, K₂SO₄, and MgSO₄.7H₂O throughout the growth period, respectively.
**Fitting the equation to the data**
Equation (1) can be rearranged to describe the results in terms of the changes of Pup with time
$$\text{pup} = \text{pa} + \text{pn} - \text{pr} - \text{pe}$$
with the exception of Pa, the terms of Eq. (2) may change with time. An appropriate function of time was used to describe the changes of Pn, Pr and Pe during the period of growth of *L. corniculatus* after each harvest. The functions were:
$$\text{pn} = a_n - b_n t^{Cn}$$
$$\text{pe} = a_e - b_e t^{Ce}$$
$$\text{pr} = a_r - b_r t^{Cr}$$
where Y represents the amount of Pn, Pe or Pr (mg P/kg of soil) after each period of growth (days) from sowing to each harvest (t); and a, b and c are parameters. The sub-indexes n, e and r identify the parameters for Pn, Pe and Pr respectively in Eqs. (3,4 and 5). This form of the equation permits to estimate by the intercept (a) the initial values of Pn, Pe or Pr at sowing (t = 0), b is a soil material-dependent coefficient and c is a coefficient that reflects the rate of change of Pn, Pe or Pr with time along the period of *Lotus* growth. The second term of the Eqs. (3,4 and 5) is negative because Pn, Pe and Pr are expected to be decreased with time due to both, the continuing reaction between soil and P, and the extraction of P by plant growth. Replacing Pn, Pe and Pr in Eq. (2) by the functions of Eqs. (3,4 and 5) respectively, the function used to describe the observed changes in Pup with time was:
$$\text{pup} = \text{pa} + \left( a_n - b_n t^{Cn} \right) + \left( a_e - b_e t^{Ce} \right) + \left( a_r - b_r t^{Cr} \right)$$
The response of accumulated dry yield with time was described by a rescaled version of the Mitcherlich equation,
$$Y = A \left( 1 - \exp \left( -C t^{m} \right) \right)$$
where Y is the accumulated total dry yield (shoot and root) with time, A is a coefficient representing the maximum yield approached, t is the period of growth in days, and C and m are coefficients that describe the curvature of the relationship between yield and time. The statistical properties of Eq. (7) were investigated by Ratkowsky [25] and used by Barrow and Mendoza [26] in legume plants where an initial region of low slope was observed in the response curve.
The concentration of P in shoot tissue to approach maximum shoot growth is currently called critical P-concentration [27]. When one level of P from different sources is added to soil and plant growth measured through time, the ability of a plant to transfer the absorbed P in shoot growth for a same period of growth can be also described by the rescaled version of the Mitcherlich equation such as Eq. (7)
$$y = a \left( 1 - \exp \left( -c x^{d} \right) \right)$$
where y is shoots dry weight (g); x is the concentration of P in shoots (%); and a, c and d are coefficients. The value of a, c and d coefficients has a similar meaning to the coefficients A, C and m of Eq. (7), respectively. Increasing the value of d at a constant value of c, makes the curve increasingly sigmoid and also determines that the maximum shoot yield is approached more quickly. The sigmoid response to added P was proposed by Bolan [28] to describe plant and soil factors, and mycorrhizal colonization causing this response form.
The responses of plant P uptake (Pup) for each P-source with were fitted separately for each soil by Eq. (6). Dry yield responses to P sources were compared by curves fitted to them. The statistical differences among curves were tested by a significant variation (P < 0.05) of the residual sum of squares of observed values. In the case that the equations to be compared differed in the number of coefficients, those with most coefficients were reduced to forms with fewer coefficients in so far the change brought about in the residual sum of squares was not statistically significant (P < 0.05). The simplex method of Nelder and Mead [29] was used to bring forth the values of the coefficients that gave the smallest residual sum of squares.
**Results**
*Lotus corniculatus* strongly responded to adding P from the three different sources increasing P uptake (Fig 1a,1d) and dry yield (Fig. 2a,2b) comparing with the control treatments.
The accumulated dry yield and P uptake responses differed between soils and for each soil among P-sources. In the clayey soil (soil 1) there was little difference with time between the two WSP-sources (TSP and PL) in both dry yield and Pup, whereas in the sandy soil (soil 2) Pup was significantly higher when PL was added compared with TSP. The response of Pup and dry yield to PR addition was always lower with respect to the WSP-sources in both soils (Figures 1a,1d & Figures 2a,2b).
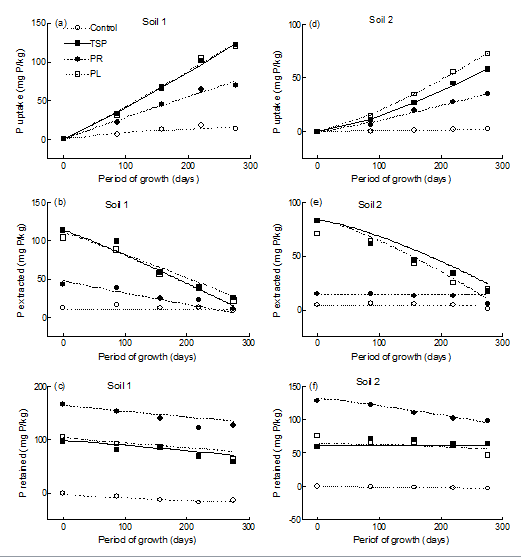
Figure 1: Fitting values obtained when Eq.(6) was used to describe changes with time in P uptake, P extracted and P retained along the period of growth in soil 1 and soil 2 after one level of P added from TSP, PR and PL sources. The lines drawn were obtained from fitting Eq.(6) from regression using all the observations rather than the points shown. Equation (6);
pup= pa +(an -bn tCn)+(ae-betCe)+(ar -br tCr) The increases of Pup by L. corniculatus with time were adequately fitted by Eq. (6). This model also described the availability of P (Pe) measured by AEM (Fig. 1b,1e) and
60 Soil 1 (a)
Control TSP PR PL
Total dry yield (g/pot)
Total dry yield (g/pot)
0 100 200 300 Period of growth (days) the retained P (Pr) by the soils (Fig. 1c, 1f). For the three P-sources in both soils, Pe and Pr decreased meanwhile Pup increased with time. Table 2 shows the values of the coefficients obtained when Eq. (6) was used to describe the changes of Pup, Pe and Pr with time.
60 Soil 2 (b)
Control TSP PR PL
0 100 200 300 Period of growth (days) Figure 2: Fitting values obtained when Eq.(7) was used to describe changes with time in total dry yield of Lotus corniculatus growth in soil 1 and soil 2 after one level of P added from TSP, PR and PL sources. The lines drawn were obtained from fitting Eq.(7) from regression using all the observations rather than the points shown.
Equation (7); Y=A(1-exp(-Ctm)) .
From the fitted values obtained by fitting Eq. (6), we estimated the soil P balance according to Eq. (1). We made two assumptions for estimating the soil-P balance. The first was that Pa + Pn is the total amount of P representing the 100% of soil P that is potentially available for plant growth (Pup), the second assumption was that the amount of Pe extracted from the control soils represents the total amount of native P potentially available for plant growth. Then, the changes of soil P according Eq. (6) can be calculated for each period of growth and plotted together in Figure 1.
At sowing, approximately 50 % of the added P from the WSP-fertilizers was retained by each soil (Pr) even after the extraction of P (Pe) by AEM methods. However, when PR was added, near 75 % and 90 % was retained in soil 1 and 2 respectively (Figres 1c, 1f).
For each soil and the two WSP-sources, the changes of Pup, Pe and Pr showed similar tendencies with time. However in soil 1, the proportion of soil P absorbed by the plants (Pup) and the end of the period of growth was 60 % of the total P potentially available for plants, whereas in soil 2 the proportion absorbed was 40 % and 50 % for TSP and PL respectively. In addition, for these P-sources, there was a clear decrease of Pr with time in soil 1 but it showed little changes in soil 2.
For each soil when PR was applied, the changes of the variables measured differed with respect to the WSP-sources (Figures 1c,1f). In soil 1, Pr decreased with period of growth from 74 - 67% but in soil 2 the decreased was more marked from 91-66% of the total soil P. The estimated values of the coefficients of Eq. (6) also give information regarding the reaction between soil and P that in turn influence Pup (Table 2). The coefficients ce and cr, both exponents of t in Eq. (4 and 5), describe the changes of Pe and Pr with time. A value of ce and cr higher or lower than unity indicates that the relationship between Pe and Pr with time is curved and the rate of change of Pe or Pr is not constant with time. Values of these coefficients close to unity suggest that the decrease of Pe and/or Pr is constant with time.
| Soil | P source | Parameters of Eq. (6) | R2 | ||||||||
|---|---|---|---|---|---|---|---|---|---|---|---|
| Native P | Extracted P | Retained P | |||||||||
| an | bn | cn | ae | be | ce | ar | br | cr | |||
| Soil 1 | Control | 10.69 | 2.63x10⁻¹⁴ | 0.081 | 10.84 | 1.17x10⁻¹² | 0.127 | 0.006 | 0.722 | 0.548 | 0.765 |
| TSP | 15.22 | 0.010 | 0.898 | 113.72 | 0.205 | 1.099 | 99.09 | 0.064 | 0.898 | 0.985 | |
| PR | 15.01 | 7.16x10⁻³ | 0.146 | 47.77 | 0.200 | 0.909 | 165.05 | 0.165 | 0.926 | 0.931 | |
| PL | 13.71 | 7.75x10⁻³ | 0.807 | 111.03 | 0.217 | 1.059 | 100.74 | 0.103 | 0.986 | 0.953 | |
| Soil 2 | Control | 3.95 | 3.75x10⁻¹³ | 0.133 | 4.059 | 7.51x10⁻¹³ | 0.042 | 0.012 | 0.018 | 0.859 | 0.635 |
| TSP | 8.66 | 9.04x10⁻⁴ | 0.925 | 83.48 | 0.029 | 1.352 | 63.63 | 3.52x10⁻³ | 1.005 | 0.981 | |
| PR | 7.78 | 4.90x10⁻⁴ | 0.958 | 14.34 | 5.10x10⁻⁵ | 0.987 | 132.32 | 0.051 | 1.017 | 0.959 | |
| PL | 7.04 | 3.40x10⁻⁴ | 1.026 | 91.16 | 0.048 | 1.306 | 54.26 | 4.40x10⁻⁴ | 0.972 | 0.996 |
Table 2: Coefficients obtained when Eq. (6) was used to describe the changes in phosphorus uptake by Lotus corniculatus plants al
For the WSP-sources applications in soil 1 the rate of increase of Pup was constant with time, whereas in soil 2 the rate of increase of Pup increased with time. These differences in the rates of Pup can be visualized comparing Fig. 1a and 1d, where the fitting curves of the relationships between Pup versus period of growth is gently upwards in soil 2 but almost straight in soil 1. The magnitude of these differences is reflected by the values of ce and cr coefficients (Table 2). These coefficients indicated that for the WSP-sources applications in soil 2, the rate of decrease of Pe increased with time (ce > 1) and the rate of decrease of Pr is constant with time (cr = 1). Consequently, in soil 2 the rate of increase of Pup with time after harvesting is because of the balance between the rate of decrease of Pe, which decreases with time, and the constant decrease with time of the retained P (Pr) by the soil. In soil 1 the situation differs and for the WSP- sources, the values of ce and cr coefficients were both close to unity suggesting that the rate of decrease of both, Pe and Pr, was constant with time. Hence, the rate of increase of Pup by Lotus was also constant along the periods of growth. Native P (Pn) had little changes and is expected to have little influence on Pup with time in both soils.
The amount of absorbed P by Lotus from the less soluble P-source (PR) showed little differences between soils and the rate of increase of Pup with time was almost constant in both soils and the fitted line close to linearity. Nevertheless, the increase of Pup with time for PR in soil 2 is mainly reflected by the decrease of Pr with time rather than the Pe removed from the soil by the P-soil test method, which was constant and around 14 ppm P along the period of growth.
The response of the total accumulated dry yield (shoot and roots) with time was closely described by Eq. (7) showing similar tendencies in both soils (Figures 2a,2b).
The responses to the WSP-sources were fitted together by only one curve because a separated fit for TSP and PL was not statistically justified. Hence, three separated curves were used to describe the responses of L. corniculatus to WSP, PR and control treatment in both soils (Figures 2a,2b). The coefficients obtained when fitting Eq. (7) are indicated in Table 3. The value of m higher than unity indicates that the fitting curve at early stages of growth is gently upwards.
| Soil | P source | Parameters of Eq. (7) | R2 | ||
|---|---|---|---|---|---|
| A | C | m | |||
| Soil 1 | Control | 11.55 | 5.35 x 10⁻⁵ | 1.997 | 0.999 |
| TSP - PL | 116.70 | 2.82 x 10⁻⁴ | 1.340 | 0.994 | |
| PR | 48.68 | 2.76 x 10⁻⁴ | 1.526 | 0.994 | |
| Soil 2 | Control | 8.34 | 2.42 x 10⁻⁵ | 1.760 | 0.990 |
| TSP - PL | 55.25 | 2.90x10⁻⁵ | 1.802 | 0.997 | |
| PR | 39.35 | 1.33x10⁻⁵ | 2.001 | 0.999 |
Table 3: The value of m higher than unity indicates that the fitting curve at early stages of growth is gently upwards.
The ability of L. corniculatus to transfer and use the absorbed P in shoot growth was sigmoid and adequately fitted by Eq. (8) in both soils (Figure 3). Separated responses curves were fitted for each period of growth and the dry yields of the control and the three P-sources treatments were together part of the same fitting curve and plotted against the concentration of P in shoot tissue (Figure 3). For each period of growth, the dry yield of the two WSP-sources treatments approached to the same yield in each soil. However, the concentration of P in shoot differed between plants growing in the two soils. In soil 1, % P in shoot was quite similar between PL and TSP treatments to obtain the same yield, however in soil 2 more P was absorbed by Lotus when PL was added compared to TSP to obtain the same yield (Figure 3). These results were similar to those observed when plotted dry yield of roots against % P in roots tissue (data not shown).
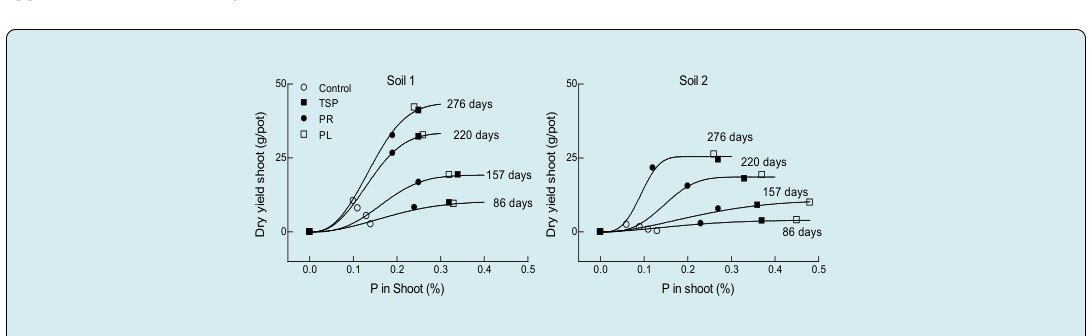
Figure 3: Fitting values obtained when Eq.(8) was used to describe changes with time in dry yield of Lotus corniculatus shoot growth in soil 1 and soil 2 after one level of P added from TSP, PR and PL sources as a function of the concentration of P in shoot tissue. The lines drawn were obtained from fitting Eq.(8) from regression using all the observations rather than the points shown.
Equation (8); ( ) y=a 1-exp(-c xd) When PR was added, the % P is shoot was lower with respect to the WSP-sources in both soils. At early periods of growth (86 and 157 days), the response to PR addition has approached to a same yield of WSP-sources (Fig. 3). At late harvests (220 and 276 days), the response of dry yield to PR was lower than the WSP-sources. For each P-source the accumulated dry yield of shoots increased with time but the concentration of P in shoot tissue decreased. The critical value of % P in shoot tissue required to obtain the 90 % of the maximum shoot yield also decreased with increasing the period of growth. For soil 1 was 0.33, 0.31, 0.20 and 0.20 % P for 86, 157, 220 and 276 days of growth respectively. For soil 2 was 0.35, 0.41, 0.22 and 0.14 % P respectively for the same period of growth as indicated for soil 1 (Figure 3).
Discussion
Lotus corniculatus strongly responded to adding P from the three P-sources of different solubility by increasing both P uptake and accumulated dry yield in both soils. The P uptake was described by Eq. (6), where the changes of Pup with time was reflected by the extracted P by AEM method (Pe), the retained P (Pr) by the soil and the native P (Pn).
The availability of a P-source to plants largely depends on its rate of dissolution but the reaction between soil and P, and plant species may alter the availability of P to plants growth [19]. TSP and PL are both water WSP-sources (87 % and 24 % w/w respectively) but differing in their rate of dissolution [18, 30]. The solubility test assessed by the P-fractionation method of Headley [31] has showed a low accumulation on the residual P fraction from the three P-sources (1.0, 2.1 and 5.0 % of the total P present in TSP, PR and PL respectively) which is expected to have no influence on Pup with time [18]. However, there was a significant proportion of P accumulated in a more chemically stable fraction associated to Ca [32], which was extracted by HCl 1 M (10.8, 97.7, 48.0 % of the total P present in TSP, PR and PL respectively), specially from the PR source composed by 32 % of Ca [18]. These stable forms may interact with the soil and may release P during the period of growth to more labile forms after long periods and then part of it may be absorbed by plant roots, extracted by a chemical method or still retained by the soil even after the extraction by the soil test reagent [33]. The P present in TSP-source can be rapidly released to labile P-forms (87 % of total P) and then absorbed by the roots or adsorbed by soils constituents. Similarly, P in the PL source can be also rapidly release but only 24 % of the total P, and PR does not release P rapidly and needs long periods of reaction to transfer P from the more chemical stable forms (98 %) to P-forms available for plant growth [18]. Soil 1 has 47 % of clay content, 4.2 % in organic carbon, and is 2.6 and 3.5 times higher in P-sorption capacity and P-buffering capacity than soil 2 respectively, which in turn only has 5 % of clay, 90 % of sand content and 0.8 % of organic carbon [18]. In addition, soil 1 is 15 higher in exchangeable Ca than soil 2, suggesting that soil 1 has a higher ability to react with P than soil 2.
The amount of absorbed P by the Lotus roots with time from TSP and PL applications differed between soils. The fitting model suggests that in soil 1 for the two WSP-sources, the constant rate of increase of the amount of P absorbed from the soil solution by L. corniculatus (Pup) with increasing the period of growth was explained by the constant rate of decrease of both Pe and Pr with time. In soil 2, the rate of increase of Pup increased with the period of growth and was mainly explained by an increase of the rate of decrease of Pe with time, because Pr decreased with little changes with time. For the less soluble P-source (PR), the dynamic balance of soil-P also differed between soils. Similarly as for the WSP-sources, in soil 1, the increase of Pup with time was associated with a decrease of Pe and P with time; but in soil 2 by a decrease of Pr meanwhile Pe was around 14 ppm P along the period of growth.
The P fractionation method showed that the “organic” PL-source contains 88.3 % of inorganic-P, which is more reactive with the soil than the organic-P [18]. Then, the organic-P is expected to have little influence on P balance in soil. Hence, differences in P availability between WSP- sources with time are likely to be associated with differences in the reaction between each soil and P during the period of growth and, the amount of labile and moderately labile forms that are susceptible to be desorbed by soil constituents to the soil solution and then absorbed by Lotus plants. In addition, soil 1 has a higher ability to retain P and then to release it with time to available P-forms comparing with soil 2 of a lower P-sorption and buffering capacity than soil 1 and low ability to release P with time as showed by the extraction of the same amount of P (around 14 ppm P) along the along the period of growth.
The P uptake in soil 1 from the WSP-sources was the same along the period of growth, but in soil 2 P uptake was higher in PL that in TSP. Moreover, the accumulated dry yield was similar between these two sources in both soils. This indicates that the ability of Lotus plants to transfer the absorbed P from the WSP-sources in growth was different for each soil, suggesting the presence of one or more limiting factors in soil 2 that impeded plant growth even when sufficient P absorbed from the PL-source is present in plant tissue.
In forage plants, the % P in tops with respect to its yield is an important plant property when P availability is not sufficient to reach maximum yield, which is the case for the most of the soils destined to pastures for plant growth [5]. The ability of Lotus plants to transfer the absorbed P in growth differed with increasing the concentration of P in shoot tissue determining a sigmoid response. The flexibility of Eq. (8) permitted to describe this sigmoid response in both soils with different periods of plant growth. A sigmoid form of a rescaled version of the Mitscherlich equation was used by Mendoza [12] and Mendoza [27] to estimate the critical value of P in shoot required to give 90 % of maximum shoot yield in L. corniculatus and L. tenuis. In the present work in soil 1, the critical P-concentration in shoots of L. corniculatus to reach the 90 % of maximum shoot yield decreased with increasing the period of growth ranged from 0.33 % at early stages of growth to 0.20 % at late stage of growth, and from 0.41 % to 0.14 % at a respectively stages of growth in soil 2. A critical value of 0.22 % P in shoot tissue of L. corniculatus after 35 days of growth at a range of added P reported by Mendoza [12] is within the range of the 0.20 % reported here.
Conclusion
The absorption of P from the soil by a plant is a multidimensional process. The response of L. corniculatus to adding P among soils, P-sources and periods of growth were successfully described by an equation where the dynamic of P in soil was interpreted by the changes with time of the extracted P by a soil-P test, the retained P by the soil constituents even after the extraction of P and the native P already present in soil. The added P increased Pe and Pr in the soil. However, the soluble sources increased more the Pe and the phosphate rock the Pr. The most available Pe was quickly consumed by the plants, showing a higher concentration of P in the tissues and better growth. A proportion of the added P reacted with the soil, showing more Pr. Especially the poorly soluble PR source, which slowly contributed P to the plants over time.
References
-
Ginzo HD, Collantes M, Caso OH (1982) Fertilization of a native grassland in the Depresion del Rio Salado, Province of Buenos Aires: Herbage dry matter accumulation and botanical composition. Journal of Range Management 35: 35-39.
-
Mendoza RE, Bailleres M, Garcia I, Ruiz O (2016) Phosphorus fertilization of a grass-legume mixture: effect on plant growth, nutrients acquisition and symbiotic associations with soil microorganisms. Journal of Plant Nutrition 39(5): 691-701.
-
Mendoza RE, Garcia I, Fernandez Lopez C, Depalma D (2016) Competition and growth of a grass-legume mixture fertilized with nitrogen and phosphorus: effect on nutrient acquisition, root morphology and symbiosis with soil microorganisms. Crop and Pasture Science 67(6): 629-640.
-
Tiessen H (2008) Phosphorus in the global environment. In: White PJ, et al. (Eds.), Ecophysiology of Plant- Phosphorus Interactions. Springer, New York, pp: 1-8.
-
Muir JP, Pitman WD, Foster JL (2011) Sustainable, low- input, warm-season, grass-legume grassland mixtures: mission (nearly) impossible? Grass and Forage Science 66(3): 301-315.
-
Paulson J, Jung H, Raeth Knight M, Linn J (2008) Grass vs. legume forages for dairy cattle. Dissertation presented at the Minnesota Nutrition Conference. University of Minnesota, pp: 119-133.
-
Seany RR, Henson PR (1970) Birdsfoot Trefoils. Adv Agron 22: 119-157.
-
Mc Mahon LR, Mc Allister TA, Berg BP, Majak W, Acharya SN, et al. (2000) A review of the effects of forage condensed tannins on ruminal fermentation and bloat in grazing cattle. Canadian Journal of Plant Science 80(3): 469-485.
-
Acuna H, Concha A, Figueroa M (2008) Condensed tannin concentrations of three lotus species grown in different environments. Chilean Journal of Agricultural Research 68(1): 31-41.
-
Grant WF, Marten GC (1985) Birdsfoot Trefoil. In: Heath ME, et al. (Eds.), Forages: The Science of Grassland Agriculture, 4th (Edn.), Iowa State Univ Press: Ames, pp: 98-108.
-
Davis MR (1991) The comparative phosphorus requirements of some temperate perennial legumes. Plant Soil 133: 17-30.
-
Mendoza R (2001) Phosphorus nutrition and mycorrhizal growth response of Lotus corniculatus and of Lotus glaber. J Plant Nutr 24(1): 203-214.
-
Vignolio OR, Maceira NO, Fernandez O (1995) Efecto del Anegamiento Sobre el poder Germinativo de las Semillas de Lotus tenuis y L. corniculatus. Implicancias para la Propagación Diferencial en la Depresion del Salado (Buenos Aires, Argentina). Ecologia Austral 5: 157-163.
-
Mendoza RE, Barrow NJ (1987) Characterizing the Rate of Reaction of Some Argentinean Soils with Phosphate. Soil Sci 143(2): 105-112.
-
Barrow NJ (1983) A mechanistic model for describing the sorption and desorption of phosphate by soil. J Soil Sci 34(4): 733-750.
-
Mahimairaja S, Bolan NS, Hedley MJ (1995) Agronomic effectiveness of poultry manure composts. Communications in Soil Science and Plant Analysis 26(11-12): 1843-1861.
-
Sample EC, Soper RJ, Racz GJ (1980) Reactions of phosphate fertilizers in soils. In: Khasawneh FE, et al. (Eds.), The Role of Phosphorus in Agricultures. American Society of Agronomy; Madison, Wisconsin, USA, pp: 263- 310.
-
Boschetti NG, Quintero CE, Giuffre L (2009) Phosphorus fractions of soils under Lotus corniculatus as affected by different phosphorus fertilizers. Biology and Fertility of Soils 45(4): 379-384.
-
Rajan SSS, Watkinson JH, Sinclair AG (1996) Phosphate rocks for direct application to soil. Adv Agron 57: 77-159.
-
Zapata F, Roy RN (2007) Utilización de las rocas fosforicas para una agricultura sostenible. Boletín FAO No 13, Roma, pp: 156.
-
Perrott KW, Sarathchandra SU, Dow BW (1992) Seasonal and fertilizer effects on the organic cycle and microbial biomass in a hill country soil under pasture. Aust J Soil Res 30(3): 383-394.
-
Singh RJ, Chung GH, Nelson RL (2007) Landmark research in legumes. Genome 50(6): 525-537.
-
Murphy J, Riley JP (1962) A modified single solution method for the determination of phosphate in natural waters. Anal Chim Acta 27: 31-36.
-
Cooperband LR, Logan TJ (1994) Measuring in situ changes in labile soil phosphorus with anion-exchange membranes. Soil Sci Soc Am J 58(1): 105-114.
-
Ratkowsky DA (1983) Principles of nonlinear regression modeling. Journal of Industrial Microbiology 12(3): 195- 199.
-
Barrow NJ, Mendoza RE (1990) Equations for describing sigmoid yield responses and their application to some phosphate responses by lupins and by subterranean clover. Fertilizer Research 22: 81-188.
-
Mendoza RE, Lamas MC, Garcia I (2009) How do soil P tests, plant yield and P acquisition by Lotus tenuis plants reflect the availability of added P from different phosphate sources. Nutrient Cycling in Agroecosystems 85(1): 17-29.
-
Bolan NS, Robson AD, Barrow NJ (1983) Plant and soil factors including mycorrhizal infection causing sigmoidal response of plant to applied phosphorus. Plant Soil 73: 187-201.
-
Nelder JA, Mead R (1965) A simple method for function minimization. Comput J 7(4): 308-313.
-
Kumar V, Gilkes RJ, Bolland MDA (1992) The residual value of rock phosphate and superphosphate from field sites assessed by glasshouse bioassay using three plant species with different external P requirements. Fertil Resolut 32: 195-207.
-
Hedley MJ, Stewart JWB, Chauhan BS (1982) Changes in inorganic and organic soil phosphorus fractions induced by cultivation practices and by laboratory incubations. Soil Sci Soc Am J 46(5): 970-976.
-
Cross AF, Schlesinger WH (1995) A literature review and evaluation of the Hedley fractionation: applications to the biogeochemical cycle of soil phosphorus in natural ecosystems. Geoderma 6(3-4): 197-214.
-
Cauhepe M (2004) Does Lotus glaber improve beef production at the Flooding Pampas? Lotus Newsletter 34: 38-43.
- Lessons to Learn: Trees are More than the Lungs of the World
- Community Forestry Enterprises as a Model for Sustainable Forest Development: The Case Of The "Baja Tarahumara" in Chihuahua, Mexico
- Ecological and Socio-Economic Impacts of Chromolaena odorata and Mesosphaerum suaveolens, Two Invasive Alien Species in Central and Southern Benin, West Africa
- Epigenetic Sustainability: Modeling the Human Factor as a Natural Resource through Science 4.0 and the NR3C1 Biological Pilot
- Growth-at-Risk: A Framework for Assessing Economic Vulnerability
- The Rural Territory as a Socioecological System for the Management of Public Policy for Sustainable Rural Development