Processed Wood Products Trade in Ethiopia; In Case of Paper and Paper Products Trade
Paper and paper products were one of the most imported processed wood products at different times of the years. Ethiopia has spent a huge amount of foreign currency to import paper and paper products. However, the income gained from the export of paper and paper products was very small and caused a trade deficit. This trade deficit has an impact on the economy of the country. However, the information on the status of the paper and paper product import-export in Ethiopia is lacking. The objective of this study was, therefore, to assess the status and trend of imported and exported paper and paper products between 1997 and 2016. To achieve the objective, the raw data on the international trade of paper and paper products in the period between 1997 and 2016 were collected from Ethiopia Revenue and Customs Authority (ECRA). Data were analyzed by SPSS version 16.0. The result indicated that on average Ethiopia spent US$ 29.85 million/year to import 23700 Tones/year of paper and paper products. The trend of total expenses to import different paper and paper products into Ethiopia and while, the quantities of paper and paper products imported between 1997 and 2016, has been grown by 12.6% and 8.7% yearly, respectively. Thus, Ethiopia spent a large amount of money to import paper and paper products than the money earned by exporting paper and paper products.
Introduction
The Trade of paper, paperboard, and pulp has gradually increased with the increase in global demand for the paper product. Between 2011 and 2015, the global production and trade of pulp and paper were annually grown by one percent [1]. Economic growth in Asia has led to an increase in demand for paper and paper products and has also changed global demand; While Europe is a net importer of pulp, the amount of paper exported has progressively grown over the last decade [2]. In contrast to the pulp, the exported paper from Europe was around 9 million tons more than imported to Europe [2]. The EU27 imports considerably more pulp and recovered paper products than it exports. Between 2005 and 2010, EU27 exported Coated paper and paperboard to its main trading destinations. On average, EU27 gained $US 1.1 billion from the USA, $US 632 million from Russian Federation, $ USD 425 million from Switzerland, and $US 280 million from china by exporting coated paper and paperboard products [3]. In the past five years, the USA which is the largest producer and importer, has reduced production and increased imports of paper and paper products [4].
The total paper and paper board production in European in 2014 was 91.1 million tons, and the leading paper producer countries were Germany, Sweden, and Finland [2]. Due to regional economic growth, Eastern Europe has advanced and become the net importer of pulp and paper [5]. The improvement in the global pulp, paper, and paperboard industry that started in 2014 fell in 2015 [6]. This could be happened due to decrease in export demand of Asian countries, mostly China and Russia as a result of trade sanctions [6].
Despite, tropical countries being in aggregate, a net importer of paper and paperboard, import substitution and export growth has been underway in some countries [7]. Paper production in Africa stagnated [1]. Except for Kenya, South Africa, Swaziland, Tanzania, and Zimbabwe, all countries of Africa import paper and paper products. Like other sub-Saharan Africa, Ethiopia has the problem of wood shortage and imports processed wood products including paper and paper products to supplement the limited supply of the product [8, 9, 10, 11].
The only paper producing factory in Ethiopia till 2016 is only Ethiopian Pulp and Paper Share Company which located at Wonji. The factory can produce about 10,000 tons of paper and 11,470 tons of corrugated paper per year [12]. Information on paper and paper product trade is imperative to know the cost incurred to import and income earned from exporting paper and paper products. However, information on paper and paper products imported and exported in Ethiopia remain scarce. The objective of this study was to assess the paper and paper product trade in Ethiopia. Specifically, the aim of this study was to assess
- The imported paper and paper products
- The origin of imported paper and paper products
- The paper and paper product export potential of Ethiopia and
- Trade balance of paper and paper products.
Methodologies
Raw data on the international trade of paper and paper products in the period 1997-2016 were collected from revenue and customs authorities. The paper and paper product data were carefully segregated. The export and import quantities in tons and value in $US were used. Trend analysis was the method of data analysis used both for value and quantities of traded major paper and paper products. Excel sheet and SPSS version 16.0 were applied for analysis. The value to quantities ratios show the trend and status of Ethiopia’s position in terms of value gained for exported and imported paper and paper products from the international market. For the imported paper and paper product, cost, insurance, and freight (CIF) values; while for the exported paper and paper product, free-on-board values were used in the analysis.
The trend of change percentage on expense for different paper and paper products imported was computed using the formula: a trend of change = (expense to import paper and paper products during the previous year – expense to import paper and paper product in the current period) / expense to import paper and paper product in the previous year) *100 [13].
Results
Import of Paper and Paper Products to Ethiopia
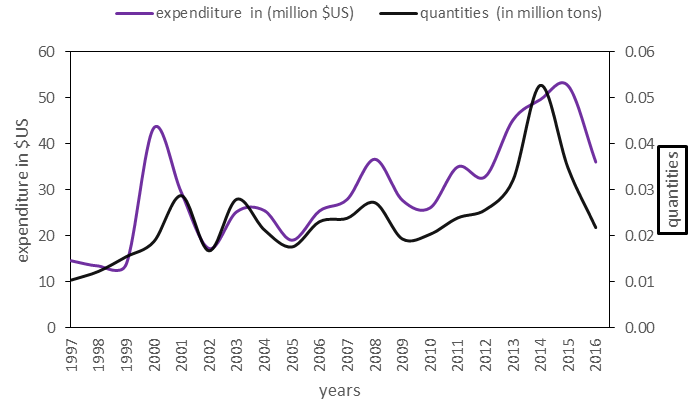
The quantities of imported paper and paper products along with their yearly expenditure are presented in Figure 1. The results indicated that between the years 1997 and 2016, Ethiopia imported on average 23700 tons of paper and paper products per year. To import such a quantity of paper and paper products the country spent on average US$ 29.85 million/year. Out of this yearly average expenditure about 8.7% for Folding cartons, boxes, and cases of non-corrugated paper and paperboard, 8.5% for Paper for writing and coated with kaolin, 6.5% for printed paper or paperboard labels of all kinds, 6.4% for Fluting paper, 6.2 for Sack Kraft paper, about 6% for Cartons, Boxes, and cases of corrugated paper and paperboard, 5.6% for Copying or transfer papers, 5.5% for photographic paper and paperboards, and about 46% for other paper and paper products types Table 1.
| Paper and paper product | Average quantities in (tons) | Average Expenditure in (Million $US) | Paper and Paper Product | Average Quantities in (tons) | Average Expenditure in (Million $US) |
|---|---|---|---|---|---|
| Printed paper or paperboard labels of all kinds | 3258.3 | 1.93 | Kraft paper | 328.2 | 0.5 |
| Paper for writing and coated with kaolin | 3143.2 | 2.55 | Fluting paper | 282.6 | 1.92 |
| Semi-chemical fluting paper | 2466.9 | 0.75 | Cigarette paper | 259.7 | 0.43 |
| Photographic paper and paperboards | 1629.9 | 1.65 | Gummed or adhesive paper and paperboard | 238.1 | 0.32 |
Table 1: The average quantity of paper and paper products imported to the country and their respective expense between the years
- Copying or transfer papers
- 1536.8
- 1.66
- Newspapers, journals and periodicals,
- 229.1
- 0.43
- Paper and paperboards
- 1400.9
- 1.19
- Envelopes of paper or paperboard
- 227.3
- 0.53
- Sack Kraft paper
- 1316.7
- 1.85
- Self-copy paper, in rolls or sheets
- 219.1
- 0.14
- Registers, account books, order and receipt books, of paper and paperboard
- 991.1
- 0.58
- Binders folders and file covers
- 214.2
- 0.44
- Unbleached Kraft and sack
- Kraft paper and paperboards
- 771.9
- 0.94
- Stationery paper
- 189.6
- 0.29
- New stamps; stamp impressed paper; bank notes revenue
- 724.4
- 0.67
- Handkerchiefs, cleaning or facial tissues and towels
- 174.2
- 0.49
- Toilet paper
- 591.3
- 0.91
- Paper and p-coated, surface decorated or printed
- 158.2
- 0.11
- Folding cartons, boxes and cases, of non-corrugated paper and paperboard
- 574.3
- 2.6
- Carbon or similar copying papers, in rolls or sheets
- 149.3
- 0.19
- Recovered paper and paperboard
- 473
- 0.73
- Bobbins, spools, cops and similar supports of paper or paperboard
- 144.5
- 0.39
- Ingrain paper
- 461.9
- 0.74
- Others
- 1092.4
- 3.16
- Cartons, boxes and cases, of corrugated paper or paperboard
- 452.5
- 1.78
Table 2: The average quantity of paper and paper products imported to the country and their respective expense between the
Trends of Paper and Paper Products in Ethiopia
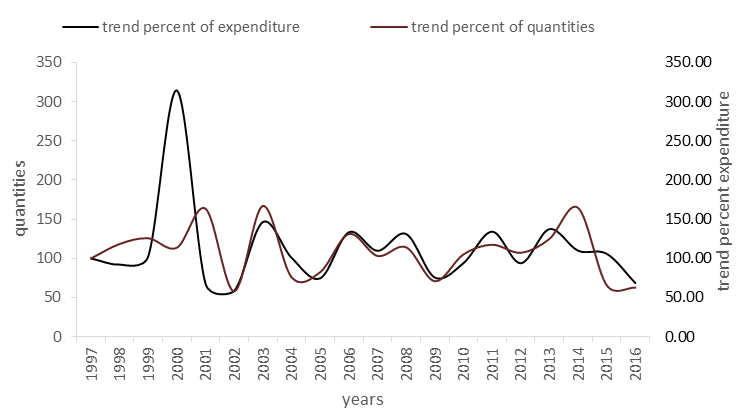
As the trend result indicated, the quantities of imported paper and paper products increased by 12.6% yearly.
Similarly, the expenditure to import paper and paper products increased by 8.7% yearly Figure 2.
The Export of Paper and Paper Product in Ethiopia
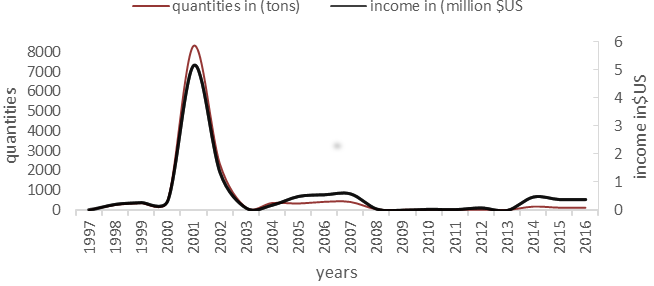
On average Ethiopia exported 130.6 tons of paper and paper product and earned $US 160246.5 yearly. The average quantities of paper and paper products that Ethiopia exported / year are presented in Table 2. Out of the exported paper and paper products, about 63.4% was covered by Felt paper and paperboard in rolls or sheets and 36.6 % was covered by other paper and paper products. Out of the generated income, about 2.6% from Felt paper and paperboard in rolls or sheets, 0.9% from paper and paperboard, 20.5% from Household sanitary or hospital articles of paper, 7.3% from Box files letter trays storage boxes of paper, 2.2% from Newspapers journals and periodicals, 1.8% from Floor coverings on a base of paper or paperboard, 2.9% from Cartons boxes and cases of corrugated and non-corrugated paper or paperboard,9.1% from Kraft paper, 9.3% from Toilet paper, 28.4% from Gummed paper and paperboard, 2.2% from Articles of paper and paperboards and 12.7% from others Figure 3.
| Average Quantities in (tons) | Average Income in($US) | |
|---|---|---|
| Felt paper and paperboard, in rolls or sheets | 84 | 4172.2 |
| paper and paperboard | 17.78 | 1486.1 |
| Household, sanitary or hospital articles of paper | 9.37 | 32907.7 |
| Box files, letter trays and storage boxes of paper | 4.27 | 11771.3 |
| Newspapers, journals and periodicals | 3.18 | 3587.3 |
| Floor coverings on a base of paper or paperboard | 3 | 2871 |
| Cartons, boxes and cases, of corrugated and non-corrugated paper or paperboard | 3.17 | 4589.1 |
| Kraft paper | 1.64 | 14615.5 |
| Toilet paper | 1.3 | 14954.3 |
| Gummed paper and paperboard | 1 | 45515.5 |
| Articles of paper and paperboards | 0.85 | 3486.7 |
| Others | 1 | 20289.8 |
Table 3: The different types of paper and paper products Ethiopia’s exported their quantities and generated income/year.
The Export Destination of Paper and Paper Products from Ethiopia
The countries’ destinations of paper and paper products exported from Ethiopia presented in Table 3. Ethiopia earned $US 606023.5 by exporting 688.97 tons of paper and paper products to different countries between 1997 and 2016. About 79.4% of paper and paper products were exported to Djibouti, and the rest of 20.6% were to other countries. About 68% of the total income has generated from Djibouti and 32% generated from other countries.
| Average Quantities In (Tons) | Average Values In ($Us) | |
|---|---|---|
| Djibouti | 547.5 | 411871.8 |
| United Arab Emirates | 72.1 | 90292.5 |
| Saudi Arabia | 48.5 | 46607.7 |
| Sweden | 9.1 | 15063.5 |
| united states | 6.5 | 22734.6 |
| India | 1 | 46.4 |
| Bahrain | 0.8 | 1302.4 |
| Somalia | 0.8 | 573.6 |
| United Kingdom | 0.8 | 3018.2 |
| Turkey | 0.7 | 1719.4 |
| Germany | 0.6 | 2278.8 |
| Canada | 0.3 | 1363.2 |
| Sudan | 0.2 | 1736.1 |
| Lebanon | 0.2 | 1440.9 |
| Others | 0.8 | 5974.5 |
Table 4: Country destination of paper and paper product exported from Ethiopia with their respective quantities and income genera
Origins of Paper and Paper Product Imported to Ethiopia
The origin of paper and paper products were summarized in Table 4. Between 1997 and 2016, Ethiopia imported paper and paper products from 141 countries. However, majority of paper and paper products were imported from 28 countries. Off all the total quantities, between 1997 and 2016, about 48% was originated from Indonesia. On the average, 2.3 million Kg of paper and paper products were imported to Ethiopia yearly from each supplier. About 2 million US$ was paid for each supplier yearly.
| Country (Origin) | Average Quantities/ Year (In Tons) | Average Values/ Year (Million $US) | Country ( Origin) | Average Quantities/ Year (In Tons) | Average Values/ Year (Million $US) |
|---|---|---|---|---|---|
| Indonesia | 32909.6 | 12.39 | Malaysia | 420.4 | 0.5 |
| India | 9436.4 | 9.81 | USA | 415.4 | 0.96 |
| China | 6980.5 | 8.81 | France | 388.4 | 0.76 |
| UAE | 2803.3 | 2.54 | South Korea | 367.4 | 0.38 |
| Sweden | 2064.6 | 1.78 | Bulgaria | 367.1 | 0.42 |
| Saudi Arabia | 1462.5 | 0.94 | Slovenia | 304.6 | 0.28 |
| Thailand | 1047.8 | 1.18 | Denmark | 285.7 | 0.22 |
| Singapore | 1047.8 | 0.5 | UK | 273.2 | 1.94 |
| Germany | 1016.2 | 2.89 | Estonia | 271 | 0.39 |
| South Africa | 847.9 | 1.17 | Swaziland | 253.1 | 0.23 |
| Egypt | 778 | 0.93 | Netherlands | 250.9 | 0.87 |
| Russia | 652.9 | 0.48 | Kenya | 212.6 | 0.48 |
| Italy | 516.2 | 0.76 | Great Britain | 209.9 | 0.63 |
| Finland | 514.7 | 0.5 | Others | 2090.1 | 4.64 |
| Spain | 424.1 | 0.59 |
Table 5: The average quantities and income per year of the supplier of paper and paper product.
Trade Balance
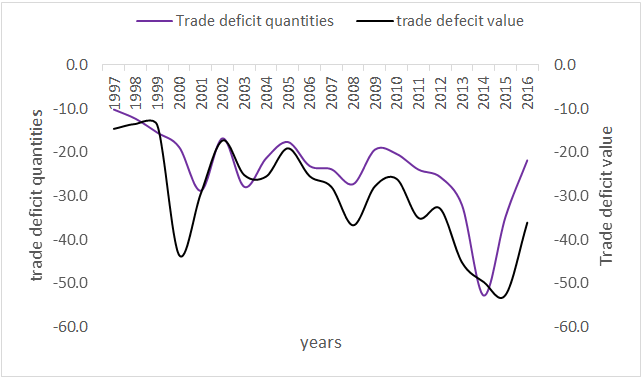
Ethiopia earned $US 297832.0 by exporting 383 tons of paper and paper products, whereas, Ethiopia spent $US 597.0 million to import 0.5 million tons of paper and paper products between 1997 and 2016. The yearly trade deficit in quantities of paper and paper products was 23678.4 tons, and the yearly trade deficit value was $US 29.8 million. Therefore, the imported paper and paper product to Ethiopia is higher than the exported by 99.8%. Similarly, the amount of expenditure that Ethiopia spent to import different paper and paper products is higher than the income generated from the export by 99.9% Figure 4.
Discussion
The finding suggested that Ethiopia spent millions of USD to import different paper and paper products. This result is in line with Alem S [13] who indicated that Ethiopia spent a million USD to import paper and paper products between 2005 and 2013. This showed that the demand for paper and paper products in Ethiopia has increased from time to time, whereas there was a limitation of paper processing industries and raw materials in the country. The big expense of the country to import paper and paper products could also be related to the lack of raw materials and the presence of very few wood processing industries in the country. This study claimed with Bekele [9] who stated that, even if the wood processing is very few, it can fill the gap of the demand for the product; however, the main problem is lack of raw material. Ethiopia exported a small amount of paper and paper products between 1997 and 2016, except in 1998 and 2013. This result opposed the finding of Alem S [13], which stated that Ethiopia has not exported any paper and paper products between 2005 and 2013.
The trend of expense to import different paper and paper products, and at the same time, the trend of the quantities of paper products imported was increasing from 1997 to 2016. On average, the expense to import paper and paper products into Ethiopia and the quantities of paper products imported were increased from year to year. Bekele [9] and FAO [14] stated that the paper-producing industries in Ethiopia are based on imported wood pulp and chemical wood pulp. FAO [14] suggested that in the years 2008-2012, Ethiopia imported Bleached Sulphate pulp, Semi chemical wood pulp, Wood pulp, and chemical wood pulp that cost an average of 3.2, 1.2, 5.2, and $US 0.37 million /year respectively.
Ethiopia imported paper and paper products from different countries of the world. The major exporter of the products was Indonesia, India, China, United Arab Emirates, Sweden, Saudi Arabia, Thailand, Singapore, Germany, South Africa, Egypt, and the Russian federation. This study also in covenant with Alem S [13], which showed the most processed wood product including paper and paper products were imported from Indonesia, China, India, Egypt, Sweden, South Africa, Thailand, Spain, the Russian Federation, and Germany. Even though most of Africa’s countries are the net importer of paper and paper products, some of them export a small amount of paper and paper products to different countries of the world. Except for South Africa, Ethiopia, Egypt, Kenya, and Swaziland, all African countries are net importers of paper products. This study is again in agreement with the finding of larinde et al. which stated that, except for Kenya, South Africa, Swaziland, Tanzania, and Zimbabwe, all countries in Africa import nearly their entire paper requirement. Ethiopia exported a small amount of paper and paper products to different countries in different years. The major paper and paper products exported were: - Felt paper and paperboard in rolls or sheets, paper and paperboard, Household sanitary or hospital articles of paper, Box files letter trays storage boxes of paper, Newspapers journals, and periodicals. Mostly, Ethiopia exported these products to Djibouti, United Arab Emirates, Saudi Arabia, Sweden, the United States, India, Bahrain, Somalia, the United Kingdom, and Turkey.
Ethiopia spent a too much higher amount of money to import paper and paper products than the income generated from exporting them. According to this finding, Ethiopia faced a trade deficit in the paper and paper product trade, because the amount of paper product imported was too much higher than the exported paper product and at the same time the cost incurred to import paper and paper products were much higher than that of generated income from the exported one. This finding aligned with FAO [14] which indicated that between 2008 and 2012, the average price to import forest products including paper products in Ethiopia was higher than generated income from exporting the products. Again, this finding is in corresponds with Alem S [13] who stated that the expense to import paper and paper products was much higher than the income generated from the exported paper and paper products. Overall, there was a trade unbalance between the imported and exported paper and paper products in Ethiopia.
Conclusion
This study has a contribution to full fill the gap of information regarding the import and export of paper and paper products in Ethiopia. The paper and paper product consumption in Ethiopia has been increased from time to time. However the supply of these products in country is not comparable with the demands. As a result such kind of assessment might be show where is the gap and has to be solved. This study also an important to robust the forestry sector to overcome the challenges with forest products trade. It is also an important input for policy recommendation in related to forest product trade across Ethiopia. To satisfy the demand in the country and increase export of paper and paper product, establishing commercial plantation which can be raw material for production of paper and paper product and planting different paper manufacturing industries are the best measure should be taken. Availability of raw material has the potential to attract the investors, who are able to plant paper manufacturing industries. Therefore, focus should be on the expansion of raw material for paper manufacturing industries.
Acknowledgement
I would like to acknowledge the Ethiopian Revenues and Custom authority (ERCA) for their generous support and delivery of the import and export data.
References
-
FAO (2016) 2015 Global Forest Products Facts and Figures.
-
Roth S, Zetterberg L, AcWorth W, Neuhoff K, Zipperer V, et al. (2016) The pulp and paper overview paper, pp: 1-46.
-
Healy S (2012) Product Classification And Its Implication On Competitiveness And Carbon Leakage Pulp, Paper And Paperboard Contributing Authors, pp: 1-37.
-
FAO (2004a) FAOSTAT forestry data. Rome.
-
UNECE/FAO (2004) Forest Products Annual Market Review 2003-2004. Timber Bulletin 57: Ece/tim/ bull/2004/3.
-
ECE-UN (2016) Trends and perspectives for pulp and paper. Ge 16: 12465E-12465.
-
ITTO (2004a) Annual review and assessment of the world timber situation.
-
Nigatu A (2004) Sawn wood market of Addis Ababa (master thesis) Wondo Genet College of forestry, Awassa, Ethiopia and the Swedish university of agricultural sciences, Skinnskatteberg, Sweden.
-
Bekele M (2011) Forest plantation and woodlots in Ethiopia. Nairobi, Kenya: African forest forum 1(12): 1-56.
-
Lemineh M, Kasa H (2014) Regreening Ethiopia: history, challenge and lessons. Forests 5(8): 1896-1909.
-
Alem S (2015) International trade of different forest products in Ethiopia. African journal of economic and sustainable development 4(4): 353-361.
-
Asmare G (2015) Addis Ababa Institute of Technology School of Chemical and Bio Engineering Pulp Production from Cotton Stalks using Kraft Pulping School of Graduate Studies.
-
Alem S (2016) Status and trends of the processed wood products trade in Ethiopia. Journal of sustainable forestry 35(4): 251-260.
-
Food and agriculture organization of United Nations (FAO) (2014) Forest product year book (FAO forestry series No.470). Rome, Italy: FAO forestry department.
-
Bojnec, Ferto (2011) Trade in raw and semi-finished wood product of Hungary and Slovenia with Austria. Austrian journal of forestry science 128(3): 157-156.
-
Economic commission of Africa (ECA) (2012) Governing and harnessing of natural resources for Africa’s development. Addis Ababa, Ethiopia: economic commission for Africa/African development forum.
-
Erb KH, Krausmann Lucht W, Haberl H (2009) embodied HANNPP: Mapping the spatial disconnect between global biomass production and consumption. Ecological economies 69: 328-344.
-
Food and agriculture organization of the united nations (FAO) (2007) State of the world’s forests report. Rome, Italy: FAO forestry department.
-
Food and agriculture organization of United Nations. (FAO) (2012) State of the world’s forest 2012. Rome, Italy: FAO forestry department.
-
Paivinen R, Lindner M, Rosen R, Lexer MJ (2012) a concept for assessing sustainability impacts of forestry wood chains. European journal of forestry research 131(1): 7-19.
- Lessons to Learn: Trees are More than the Lungs of the World
- Community Forestry Enterprises as a Model for Sustainable Forest Development: The Case Of The "Baja Tarahumara" in Chihuahua, Mexico
- Ecological and Socio-Economic Impacts of Chromolaena odorata and Mesosphaerum suaveolens, Two Invasive Alien Species in Central and Southern Benin, West Africa
- Epigenetic Sustainability: Modeling the Human Factor as a Natural Resource through Science 4.0 and the NR3C1 Biological Pilot
- Growth-at-Risk: A Framework for Assessing Economic Vulnerability
- The Rural Territory as a Socioecological System for the Management of Public Policy for Sustainable Rural Development