Impact of Sewage Water Plant Seepage on Water Quality of Abu Simbel khor’s in Abu Simbel City
The aim of the present study is to examine the water quality of Abu Simbel khor’s, Nasser Lake during the period of flooding and receding water to explores the potential pollution hazards coming from these Khors to the whole Lake through several physico-chemical and bacteriological analyses. Results obtained from calculated water quality index (WQI) showed that the drop in Lake Nasser water's levels led to a decline in the water quality of the Lake and Abu Simbel Khor, from the order of good (period of flooding) to medium (period of receding water). This impact may in turn influence the whole Lake due to water rebounce from the Abu Simbel Khor, to the main channel. Total dissolved solids (TDS), biological oxygen demand (BOD), turbidity and recognizable depletion in dissolved oxygen (DO) were observed in sewage station and affected on Lake Nasser water area adjacent seepage water area. Pollution from total and fecal coliforms as well as fecal streptococci didn't exceed permissible limits except for sewage station basin that discharge agricultural and sewage wastes are the key factors in this environmental problem, particularly in period of receding water. Therefore, it is further concluded that the Abu Simbel Khor, could be considered as potential pollution sources during low water levels of the lake.
Introduction
Worldwide, water resources problems will be one of the most significant economic and social issues of the century.
As there are limited water resources due to its fixed share of the Nile water, Egypt is one of the countries that will face great challenges, and limitation of groundwater, rainfall and desalination water. Climate change plays an important role in imposing an additional burden on water availability and accessibility in Egypt [1]. The upper Nile basin countries’ increased competition on water (The Grand Ethiopian Renaissance Dam) may lead to water shortage. Although, Lake Nasser budget of water represents the national freshwater bank of Egypt, depending on the water inflow through the Nile discharge and the water outflow through the High dam, there is still water loss by the evaporation and limited water seepage from Lake Nasser [2].
The Toushka project is part of a national scheme to reform this pattern of skewed population potentials distribution. Lake Nasser is the beginning of the Nile and it is one of the largest artificial lake in the world, (the length of the lake approximately 500 km, while the area of the lake is about 5250 square km with an average width of about 12 km, with the maximum width 35 km and the total storage capacity is about 162 billion cubic meters, and the dead storage capacity is around 32 billion cubic meters at the depth of 180 m).Lake Nasser located in the south of Egypt at the city of Aswan, and northern Sudan. The largest part of Lake Nasser located within the borders of Egypt (83% of the total area of the lake). Lake Nasser has a number of khors. Their mean length increases from south to north owing to the northwardly declining ancient riverbed [3, 4].
Some khors represent lakes (Khors Allaqi, Kalabsha and Toshka are the largest) [5], however the remaining part located within the borders of Sudan is called the Nuba Lake. The water levels in the lake vary from year to year, according to the period of flooding or receding water. This fluctuation of water level from year to year affects water quality status of the Lake and Abu Simbel Khor [6]. Therefore, the main goal for the present study is to assess the quality of water in the Lake Nasser and Abu Simbel Khor, during period of flooding and receding water.
Microbial pollution is considered one of the most important factors governing water quality. The presence and level of pathogenic bacteria and viruses in water can have a profound impact on the lives of people around the world.
Pathogen-contaminated water resources can impact human health through drinking water, agricultural produce, and even body contact [7]. Symptoms of waterborne diseases may include gastrointestinal disorders such as severe diarrhea, nausea, vomiting and possibly jaundice as well as associated skin inflammations, respiratory and urinary tract infections. Bearing in mind that, not all people will be affected to the same extent; young children, immune compromised patients and the elderly are usually more susceptible [8].
The aim of this study is to examine the water quality of Lake Nasser, sewage station basin, seepage water area and Lake Nasser water area adjacent seepage water area through several physico-chemical, bacteriological and advanced molecular biology analyses to evaluate how drains discharge may influence water quality. The correlations between different tested parameters were also discussed.
Material and Methods
Study Area and Sampling Procedures
The study was started with samples collection from 2016 to 2022, during the flood period which begins every year from August to till October and the period of receding which begins from November to till June from the next year as shown in Figure 1. Fourteen water samples were collected in duplicates, from Lake Nasser and near locations affected by sewage station outfall as described below Table 1. Samples collection was processed according to Standard Methods for Examination of Water and Wastewater [9]. All collected samples were stored in an iced cooler box and delivered for analysis.
![Figure 1: Fourteen water samples were collected in duplicates, from Lake Nasser and near locations affected by sewage station outfall as described below Table 1. Samples collection was processed according to Standard Methods for Examination of Water and Wastewater [9]. All collected samples were stored in an iced cooler box and delivered for analysis.](/fulltextimages/9630/fig_1.png)
| Site | Description | Coordinates | Type | Samples |
|---|---|---|---|---|
| A | Lake Nasser which is far 1Km from seepage area. | N: 22° 21° 26° | Control | Lake |
| E: 31° 36° 26° | ||||
| B | Sewage station basin. | N: 22° 21° 40° | Possibility Pollution | sewage |
| E: 31° 35° 38° | ||||
| C | Seepage water area. | N: 22° 21° 11° | Possibility Pollution | surface |
| E: 31° 35° 38° | ||||
| D | Lake Nasser water area adjacent seepage water area. | N: 22° 21° 15° | Possibility Pollution | surface |
| E: 31° 35° 41° |
Table 1: Location of the study sites in Lake Nasser.
Physical-Chemical Analyses
The water analysis was carried out using conventional methods for water and wastewater inspection [9]. Field parameters including temperature, pH, dissolved oxygen (DO), and total dissolved solids (TDS) were measured in-situ by the multi-probe system, model WTW 350i (the device were calibrated before using) and all results were verified in laboratory. Turbidity was measured by a Nephelometric turbidity meter (model Thermo Orion AQ4500). Biological (BOD) were determined by ORION BOD fast respiratory system (model 890), while nitrate (NO3-) was determined using ion chromatography (model Dionex ICS5000). Total phosphorous (TP) was measured by HACH model 3900 spectrophotometer at 690 nm and compare with a calibration curve.
Bacteriological Analysis
Samples were examined within 6 h after collection according to Standard Methods for Examination of Water and Wastewater [9]. For counting total coliforms (TC), fecal coliforms (FC) and fecal streptococci (FS), the membrane filter technique was applied according to standard method Nos. 9222B, 9222 D and 9230C on M-Endo agar LES, M-Fc agar and M-Enterococcus agar media, respectively. All media used were obtained in a dehydrated form, Difco-USA. Results were recorded as colony forming unit (CFU /100 ml) using Eq. (1):
$$ \mathrm {C o l o n i e s} / 1 0 0 \mathrm {m l} = \frac {\mathrm {C o u n t e d c o l o n i e s}}{\mathrm {m l} \mathrm {o f s a m p l e f i l t e r e d}} \times 1 0 0 $$
Molecular Identification and Analysis
Genomic DNA were extracted using Bacterial Genomic DNA Isolation Kit RKT09 (Chromous Biotech Pvt. Ltd., Bangalore, India) and visualized on 0.8% (w/v) agarose gel. Gene amplification was carried out using a Thermal cycler (ABI 2720) in 100 µl reaction volume containing 2.5 mM of dNTP, 10x PCR buffer, 3U of Taq DNA polymerase, 10 ng template DNA, and 400 ng of primer (F) 5’-GGGGGATCTTCGGACCTCA-3’, and primer (R) 5’-TCCTTAGAGTGCCCACCCG-3’ which were designed for G-negative bacteria according to Azzam, et al. [10]. The amplification program was set as an initial denaturation at 94°C for 5 min., followed by 35 cycles of 94°C for 30 s, 55°C for 30 s, 72°C for 2 min and a final extension at 72°C for 5 min. The sequencing was performed according to manufacturer’s protocol using Big Dye Terminator Cycle Sequencing Kit (V. 3.1, Applied Bio-system) and analysed in an Applied Bio-system analyzer. The sequences of 16S-rDNA for these strains were finally submitted to the NCBI GenBank database, USA, and compared to other available sequences using an automated alignment tool blast program, and assigned their accession numbers. Phylogenetic tree showing the genetic relationship between the Egyptian strains obtained in this study and other recorded strains was constructed using Clustalw with the help of MEGA software version 6.0.
Water Quality Index (WQI)
Geometrical Water Quality Index (WQIg) which was proposed by Ott, [11] was used to evaluate the Lake water quality during the period of flooding and receding water. This index depends on nine parameters in its calculation. These parameters are dissolved oxygen, fecal coliform, pH, BOD, nitrate, total phosphate, temperature deviation from 20°C, turbidity and total solids. Each parameter has known weight and functional curve according to its importance and significance. The geometrical water quality index was shown by the following equation:
n WQIg IiWi
= =∏ { 1
1 i = Where Ii is the water quality rating (sub index) corresponding to the value of the parameter from the functional curve, Wi is the parameter′s weight. The quality values produced from applying this index are classified into five categories as follows: 0-25 (very poor), 26-50 (poor), 51- 70 (medium), 71-90 (good) and 91-100 (excellent).
Results and Discussion
The data of water quality variables, WQI, was presented in Tables (2,3 and 4) and illustrated in Figures (1 and 2).
Physico-Chemical Characteristics of Water
Water Temperature: Our results showed that during period of receding water, the temperature values of water at Lake Nasser, sewage station basin, seepage water area and Lake Nasser water area adjacent seepage water area were recorded (33.1-33.3-33.2 and 33.1°C), respectively. While during period of flooding water were recorded (19.3-19.8- 19.6 and 19.4°C), respectively as shown in Tables 2 and 3. All values were within the normal limits established by Law 48 of 1982 indicating that the water temperature of all collected samples was affected only by the ambient air temperature with no thermal pollution [12]. Correlation coefficient matrix revealed that temperature was positively correlated with pH (r = 0.58). This is due to the increase in temperature is usually accompanied by hydrolysis of HCO3- and CO32- ions, leading to the appearance of hydroxyl (OH-) ions that increase pH value, similar relationship was reported by Elbahnasawy MA [13]. Hydrogen Ion Concentration (pH): As shown in Tables (2 and 3) during period of receding water, the pH values of water at Lake Nasser, sewage station basin, seepage water area and Lake Nasser water area adjacent seepage water area were recorded (8.24-7.29-8.25 and 8.01), respectively. While during period of flooding water were recorded (7.6-6.51- 7.45 and 7.74), respectively. The pH affects biological and chemical reactions in aquatic environment. Photosynthesis and aquatic plant growth may raise pH in river, because photosynthesis absorbs CO2 and resulting in pH values rise [14]. Dissolved Oxygen (DO): All DO values during receding water at Lake Nasser, sewage station basin, seepage water area and Lake Nasser water area adjacent seepage water area were recorded (7.4 - 0.8 - 7.01 and 7.3 mg/l), respectively (Tables 2, 3). On the other hand, during period of flooding water were recorded (8.7 - 1.8 - 8.0 and 8.5 mg/l), respectively. DO values were within allowed limits for law 48∕1982 (not decrease than 6) except in sewage station basin outlet affected by high pollution load and discharge. High levels of DO indicate high metabolic rates of aerobic bacteria and vice versa. The depletion of DO indicates unfavorable environmental conditions in which anaerobic bacteria metabolism leads to production of ammonia and H2S gases, in addition to decomposition of organic matters [15].
Biological Oxygen Demand (BOD): BOD values (Tables 2, 3) recorded higher values during period of receding water than that during period of flooding water. These values at Lake Nasser, sewage station basin, seepage water area and Lake Nasser water area were recorded (1-139.0-3 and 2 mgL-1), respectively. On the other hand, during period of flooding water were recorded (1.02- 24.5-1.9 and 1.05 mgL-1), respectively. BOD revealed high positive correlations with all bacteriological parameters (r = +0.82) and a significant positive correlation to temperature (r = 0.65) and pH (r = 0.57) especially due to removal of oxygen by bacteria during decomposition of organic matter which is usually accompanied by increase in BOD levels. [16]. Recorded high BOD values (10.5 – 7.9 mgL-1) in the water samples collected from Bahr El-Baqar drain, Port Said governorate, Egypt similarly with [16]. Total Suspended Solids (TDS): The recorded concentrations of TDS Tables 2 & 3 at Lake Nasser, and Lake Nasser water area adjacent seepage water area showed little variations between period of flooding and period of receding. The highest concentrations of TDS during period of receding water were recorded (1953.1 - 897.5 - 187 and 165 mgL-1), respectively at seepage water area, Sewage station basin, Lake Nasser water area adjacent seepage water area and Lake Nasser. On the other hand, the lowest concentrations of TDS during period of flooding water were recorded (148 – 171 - 627 and 1919 mgL-1), respectively, at Lake Nasser, Lake Nasser water area adjacent seepage water area, sewage station basin and seepage water area. All TDS values were within limits (not to exceed 500 mgL-1) except for seepage water area and sewage station basin which affected by organic pollutants from sewage discharge and human activities. Azzam and Ibrahim [17] found that, high TDS values ranged from 514 to 1038 mgL-1 at El-Rahawy drain, Giza Governorate, Egypt. Nitrates (NO3-): The nitrate concentration at Lake Nasser, Lake Nasser water area adjacent seepage water area, seepage water area and sewage station basin were recorded (0.2 to1- 0.2 to1- 0.8 to 2.5 - and 12 to 20 mgL-1) during period of receding and period of flooding, respectively as shown in Tables 2 & 3. Statistical analysis showed positive correlations between NO3– and BOD and bacteriological parameters (r = +0.45), while there’s a negative correlation with DO. It proves the effect of wastewater leakage and agricultural runoff in this region [18]. Turbidity: The highest values of turbidity (Tables 2,3) were recorded during period of receding water were recorded (0.34 - 5.6 - 4.98 - 0.24 NTU), respectively at Lake Nasser, sewage station basin, seepage water area and Lake Nasser water area adjacent seepage water area. While, higher the values of turbidity were recorded during period of flooding water (8.54-3.84-1.76 NTU), respectively at Lake Nasser water area adjacent seepage water area, and sewage station basin. The minimum value of turbidity during period of flooding water was recorded (3.17 NTU) at Lake Nasser. Such high values of turbidity in our sites may cause by urban runoff, wastewater. Increased turbidity has a negative effect on aquatic life by raising the need for light penetration used for photosynthesis. In terms of human consumption, increased turbidity needs more processes to clean water [19]. There was positive correlation between turbidity values and all parameters studied. Turbidity values are negatively correlated with dissolved oxygen (DO) (r=-0.68).
| Parameters | Unit | A | B | C | D* | LAW 48/1982** |
|---|---|---|---|---|---|---|
| Temperature | C° | 33.1±1.24 | 33.3±2.41 | 33.2±1.87 | 33.1±1.72 | 5 degrees above normal |
| pH | Unit | 8.24±0.24 | 7.29±0.14 | 8.25±0.21 | 8.01±0.11 | 6.5 -8.5 |
| DO | mg/l | 7.4±1.22 | 0.8±0.74 | 7.01±1.21 | 7.3±1.87 | not less than 5 |
| BOD | mg/l | 1±2 | 139±50 | 3±2 | 2±2 | not exceed than 10 |
| TDS | mg/l | 165±6 | 187±12 | 1953±122 | 897.5±35 | not exceed than 500 |
| NO3- | mg/l | 0.2±0.04 | 12±0.21 | 0.8±0.27 | 0.22±0.08 | not exceed than 45 |
| Turbidity | NTU | 0.34±0.2 | 5.6±0.56 | 4.98±0.42 | 0.24±0.2 | - |
| TP | mg/l | 0.10±0.04 | 0.34±0.54 | 1.24±0.21 | 1.75±0.01 | - |
Table 2: Values of physico-chemical parameters (mean ± SD) of water samples collected during receding water period.
* A, B, C and D are location sites from lake Nasser, Sewage station basin, seepage water area and Lake Nasser water area adjacent seepage water area. LAW 48/1982: Egyptian Law for protection of the river Nile and water ways from pollution article 49; : No guideline available. Table 2:** Values of physico-chemical parameters (mean ± SD) of water samples collected during receding water period.
Total Phosphorus (TP)
Nitrogen and phosphorus compound are considered essential nutrients for living organisms [20]. Results in Tables 2 and 3 showed that highest concentrations of TP during period of flooding water were recorded (0.15 - 2.5 - 0.17 and 0.15 mgL-1) at sewage station basin, seepage water area, Lake Nasser water area adjacent seepage water area and Lake Nasser, respectively. On the other hand, TP concentrations during period of receding water were ranged (0.10 – 1.75 -
1.24 and 0.34 mgL-1) at Lake Nasser, Lake Nasser water area adjacent seepage water area, seepage water area and sewage station basin, respectively and all values were within the permissible limits according to Law 48/1982. The decrease in orthophosphate and nitrate values during period of receding water is mainly due to flourishing of phytoplankton that consumes these nutrients [21, 22]. There was positive correlation between TP and turbidity values (r = +0.55) [23].
| Unit | A | B | C | D* | LAW 48/1982** | |
|---|---|---|---|---|---|---|
| Temperature | °C | 19.3±1.11 | 19.8±2.01 | 19.6±1.54 | 19.4±1.42 | 5 degrees above normal |
| pH | Unit | 7.6±0.19 | 6.51±0.12 | 7.45±0.17 | 7.74±0.10 | 6.5 -8.5 |
| DO | mg/l | 8.7±1.42 | 1.8±0.18 | 8.0±1.42 | 8.5±1.14 | not less than 5 |
| BOD | mg/l | 1.05±1 | 24.5±9 | 1.9±1.0 | 1.05±1 | not exceed than 10 |
| TDS | mg/l | 148±1 | 627±14 | 1919±20 | 171±2 | not exceed than 500 |
| NO3- | mg/l | 1.0±0.24 | 20±0.31 | 2.5±0.28 | 1.0±0.29 | not exceed than 45 |
| Turbidity | NTU | 3.17±0.27 | 1.76±0.42 | 3.84±1.1 | 8.54±0.52 | - |
| TP | mg/l | 0.15±0.04 | 0.15±0.1 | 2.5±0.03 | 0.17±0.01 | - |
Table 3: Values of physico-chemical parameters (mean ± SD) of water samples collected during flooding water period. * A, B, C and
Table 3: Values of physico-chemical parameters (mean ± SD) of water samples collected during flooding water period. * A, B, C and D are location sites from lake Nasser, Sewage station basin, seepage water area and Lake Nasser water area adjacent seepage water area. ** LAW 48/1982: Egyptian Law for protection of the river Nile and water ways from pollution article 49; -: No guideline available.
Bacteriological Characteristics of Water Samples
Total Coliforms (TC)
Coliforms group is defined as those aerobic and facultative anaerobic, Gram-negative, non-spores forming, rod shaped bacteria that can ferment lactose within 24 h at 35 °C and produce CO2 gas within 48 h. It includes multiple bacterial genera such as Escherichia, Klebsiella, Enterobacter and Citrobacter [9]. The results of TC counts showed that the highest counts were recorded (89 x 105 - 27 x 103 -6300 and 4500 CFU/100 ml), respectively at sewage station basin, seepage water area, Lake Nasser water area adjacent seepage water area and Lake Nasser during receding water which represent low water levels in khors of the Nasser Lake. As well as, the lowest counts were recorded (98 - 110 – 15 x 102 and 27 x 103 CFU/100 ml) at Lake Nasser, Lake Nasser water area adjacent seepage water area, seepage water area and sewage station basin during flooding water, respectively as shown in Tables 4 and 5. About 75% of water samples collected from raw water samples from our sites during receding period exceeded the international recommended standard limits [24] (TC should not exceed 5000 CFU100/ mL). On the other hand, all samples collected during flooding period were within the permissible limits.
Fecal Coliform (FC)
Fecal coliforms are facultatively anaerobic, rod-shaped, gram-negative, non-spore forming bacteria. They are capable of growth in the presence of bile salts or similar surface agents, oxidase negative, and produce acid and gas from lactose within 48 h at 44 ± 0.5 °C [25]. The results of FC counts showed that the highest counts were recorded (6 x 10⁵ - 5 x 10³ -1100 and 1000 CFU/100 ml), respectively at sewage station basin, seepage water area, Lake Nasser water area adjacent seepage water area and Lake Nasser during receding water which represent low water levels in khors of the Nasser Lake. As well as, the lowest counts were recorded (42 - 49 - 200 and 4 x 10³ CFU/100 ml) at Lake Nasser, Lake Nasser water area adjacent seepage water area, seepage water area and sewage station basin during flooding water, respectively as shown in Tables 4 and 5. About 50.2% of water samples collected from our sites exceeded the limits of international standard recommended by Tebbutt [24] (FC should not increase than 2000 CFU/100mL). Azzam, et al. [10] record a seasonal variation of FC ranged between 400, 1000, 30 x 102 and 43 × 102 CFU100/mL in four surface waters at El-Rayah El-Menofy, El Menofeya Governorate, Egypt during 2019–2020.
Fecal Streptococci (FS)
Fecal streptococci are a group of gram-positive Lance- field group D streptococci. The genus Enterococcus includes all streptococci that differed from other streptococci by their ability to grow in 6.5% sodium chloride, pH 9.6, and 45ºC and include E. avium, E. faecium, E. durans, E. faecalis and E. gallinarium. In the water industry the genus is often called Streptococcus for this group. These two species of Streptococcus are primarily present in animals; E. faecalis and E. faecium are more specific to the human gut [7]. The results of FS counts showed that the highest counts were recorded (4 x 10⁵ - 2 x 10³ - 500 and 200 CFU/100 ml), respectively at sewage station basin, seepage water area, Lake Nasser water area adjacent seepage water area and Lake Nasser during receding water which represent low water levels in khors of the Nasser Lake. On the other hand, lowest counts were recorded (11 - 20 -150 and 700 CFU/100ml), respectively at Lake Nasser, Lake Nasser water area adjacent seepage water area, seepage water area and Sewage station basin during flooding water as shown in Tables (4 and 5). FS must not increase than 1000 CFU/100mL for surface water supply that will be used for drinking purposes. Ezzat and Azzam [26] found a fluctuated range of FS (16 - 6x10³ CFU/100mL) for drainage water and Rosetta branch water samples in Egypt.
| Parameters | Unit | A | B | C | D* | LAW 48/1982** |
|---|---|---|---|---|---|---|
| Total coliform | CFU/100ml | 98 | 27 X 103 | 15 X 102 | 110 | - |
| Fecal coliform | CFU/100ml | 42 | 4 X 10³ | 2 X 10² | 49 | - |
| Fecal streptococci | CFU/100ml | 11 | 7 X 10² | 150 | 20 | - |
Table 4: Values of bacteriological parameters of water samples collected during receding water period.
* A, B, C and D are location sites from lake Nasser, Sewage station basin, Seepage water area and Lake Nasser water area adjacent seepage water area. LAW 48/1982: Egyptian Law for protection of the river Nile and water ways from pollution; -: No guideline available. Table 4:** Values of bacteriological parameters of water samples collected during receding water period.
| Parameters | Unit | A | B | C | D* | LAW 48/1982** |
|---|---|---|---|---|---|---|
| Total coliform | CFU/100ml | 45 X 102 | 89 X 105 | 27 X 103 | 63 X 102 | - |
| Fecal coliform | CFU/100ml | 10 X 102 | 6 X 10⁵ | 5 X 10³ | 11 X 102 | - |
| Fecal streptococci | CFU/100ml | 2 X 10² | 4 X 10⁵ | 2 X 10³ | 5 X 10² | - |
Table 5: Values of bacteriological parameters of water samples collected during flooding water period. * A, B, C and D are locati
Table 5: Values of bacteriological parameters of water samples collected during flooding water period. * A, B, C and D are location sites from lake Nasser, Sewage station basin, Seepage water area and Lake Nasser water area adjacent seepage water area. ** LAW 48/1982: Egyptian Law for protection of the river Nile and water ways from pollution; -: No guideline available.
According to SPC, TC, FC and FS values obtained during this study, the investigated plants inlets (Intakes in El- Rayah El-Menofy) could be ranked from higher to lower pollution levels as follows; El-Bagor, Menof, Shibin El-Kom and Ashmon, respectively. Our results were compatible with those obtained by Shash, et al.; who reported the average count of FC was 102 CFU/100mL in the Nile water at Great Cairo reaching.
Statistical analysis indicated highly positive significant correlation (r = +0.92) between different bacteriological parameters (TC, FC and FS). The same results were concluded by El-Dougdoug [8] who investigated the bacteriological quality of River Nile Damietta branch. Regarding the correlation between bacteriological and physico-chemical parameters, positive strong correlation (r > 0.79) was observed with BOD and nitrate, while intermediate positive correlation (r > 0.55) was recorded with TDS and turbidity. It is worth mentioning that, there is a strong negative significant relationship between different bacterial indicators and DO (r = -0.71). This indicates that decrease in DO is clear evidence for bacterial water degradation [23, 27, 28].
Water Quality Index (WQI)
The values obtained from calculations of water quality index (Figure 2) at Lake Nasser and Lake Nasser water area adjacent seepage water area during flooding water ranged from (74 and 71), respectively. These values indicated good water quality level, while during receding water they ranged from (56 and 56) and these values indicated medium quality level (Table 6).
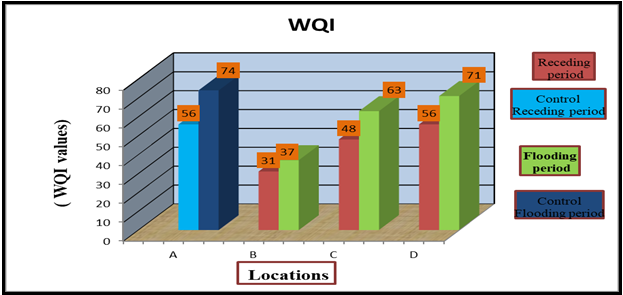
The water quality index is one of the simplest methods used in assessing the overall water quality status. It allows the reduction of vast amount of data on a range of parameters to a single number in a simple reproducible manner [29]. The results of the water quality index (WQI) calculations during this study showed that the drop in Lake water levels led to a decline in the water quality of the Lake and Khors from the order of good to medium. Nader [30] found that this drop in the lake water levels had led to a reduction in the surface areas of the Khors (selected during the present study) with a ratio ranged from 16% to 55%. According to Entz [3] the khors of Lake Nasser covers about 79% of the total Lake surface, while their volume represents 55% of the total Lake volume. Therefore, the drop in lake water levels leads to a continual rebounce of large quantities of water from the khors to the main channel of the lake. This rebounce water is characterized by its poor-quality level as indicated by the results obtained during the study. So, the rebounce of khor`s water to the main channel may have a negative impact on the whole lake. Accordingly, the khors could be considered as potential pollution sources.
| Locations | Season | Quality Index | WQI Quality Scale |
|---|---|---|---|
| A* | Receding Water | 56 | Medium or average water quality |
| A* | Flooding Water | 74 | Good water quality |
| B | Receding Water | 31 | Fair water quality |
| B | Flooding Water | 37 | Fair water quality |
| C | Receding Water | 48 | Fair water quality |
| C | Flooding Water | 63 | Medium or average water quality |
| D | Receding Water | 56 | Medium or average water quality |
| D | Flooding Water | 71 | Good water quality |
Table 6: Average values of water quality variables for four locations during period of flooding and receding water.
* A, B, C and D are location sites from lake Nasser, Sewage station basin, Seepage water area and Lake Nasser water area adjacent seepage water area. Table 6: Average values of water quality variables for four locations during period of flooding and receding water.
Molecular Identification of Bacterial Isolates
Genotype-based identification systems are becoming the method of choice in aquatic microbiology, owing to circumvent the problems of phenotypes variability and species misidentification. Based on prevalence of microbial pollution in collected water samples we selected both of E.coli and E.faecalis isolates for molecular verification of detection and identification protocol of E.coli and E.faecalis in water traced through this study involved selection of two strains (MSA01 and MSA02) for 16S-rDNA sequence analysis, based on their recognizable positive results in biochemical tests and showed high prevalence in collected water samples as well as purity of DNA and PCR amplified products. Concentrations of extracted DNA were checked using spectrophotometer at wave length A260/A280 giving values 1.7 and 1.85 for MSA01 and MSA02, respectively. The PCR amplified products were run on 2% agarose gel electrophoresis to ensure purity giving three distinct fragments with different molecular weights; MSA01 (254 bp) and MSA02 (270 bp) (Figure 3).
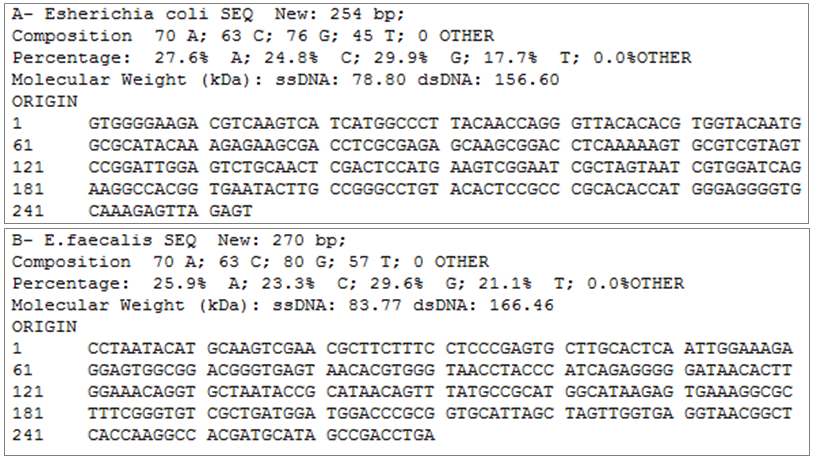
Multiple sequence alignment (MSA) was displayed to compare the nucleotide sequences of the two Egyptian strains with other strains from different localities.
Nucleotide sequences were submitted to the NCBI GenBank database, USA, and were assigned the accession numbers OP412380.1and OP412380.1, respectively. Interestingly, these strains were 100% confirmed by16S-rDNA-based PCR assay. Our results agree with those reported by Azzam, et al. [10] who mentioned that, the potential for misidentification of E.coli, E.faecalis, S.aureus and P.aeruginosa in water using molecular techniques were nearly negligible. Meanwhile, conventional cultural methods could hamper identification of contamination sources and implementation of effective control measures. Molecular methods mediated superior specificity and sensitivity than phenotypic diagnostic tests with percentages reaching 90-100% accuracy in similar studies [16, 31, 32].
The above results indicate observable genetic variability among E.coli and E.faecalis strains detected by 16S rRNA gene sequencing analysis. This definitely reflects the broad- spectrum ability of bioinformatics analysis tools using universal mix primers employed in this study to target a wide array of bacterial pathogen E.coli and E.faecalis strains in water as much as possible, and supports its high specificity (94.0%) concluded from earlier statistical analysis. Thus, it is more advantageous to get benefit from the specificity effect of more than one primer rather than using them individually [33]. Although the initial purified bacterial concentration is considered a major contributing factor governing the likelihood of a significant and variable results, yet the number of input primers established in this study was maximized to increase the probability of genetic material yield and high concentration of purified extract product. Accordingly, our future vision and efforts are depicted to maximize the number of newly isolated and molecular characterized aquatic bacterial strains especially in drainage and surface water that highly polluted with chemical and biological factors. This approach could open new prospects for direct detection of pathogens from water specimens without the need to isolate pure bacterial cultures. Our vision is consistent with Alsaffar and Jarallah; Ezzat and Azzam [26, 34].
Conclusion
The use of sewage water plants without treatments could be regarded as potential pollution sources in the water quality of Lake Nasser khor, in addition to edible plants and the entire Lake, due to water rebounded from the Khor to the main channel in the future. It is therefore possible to draw the conclusion that with the growth of the population, sewage water treatments became increasingly important to apply. After applying sewage treatments, with consideration for the potential to reuse sewage water plant to irrigate soluble plants.
References
-
Abd Ellah RG (2020) Water Resources in Egypt and their Challenges, Lake Nasser Case Study. The Egyptian Journal of Aquatic Research 46(1): 1-12.
-
Abd Ellah RG (2009) Thermal Stratification in Lake Nasser (Egypt) Using Field Measurements. World Applied Sciences Journal 6(4): 546-549.
-
Entz BA (1973) Morphometry of Lake Nasser. Project RPH UNEP SF, FAO.
-
Abd Ellah RG, El-Geziry T (2016) Bathymetric study of some khors in Lake Nasser, Egypt. Lakes, Reservoir and ponds 10(2): 139-158.
-
El-Shabrawy GM, Dumont HJ (2009) The Toshka Lakes. In HJ Dumont (Ed.), The Nile. Monographiae Biologicae, Springer, Dordrecht. 89: 157-162.
-
Abdel-Maksoud BM (2018) Estimation of Air Temperature and Rainfall Trends in Egypt. Asian Journal of Advanced Research and Reports 1(4): 1-22.
-
Azzam MI, Ezzat SM, Othman BA, El-Dougdoug KA (2017) Antibiotics Resistance Phenomenon and Virulence Ability in Bacteria from Water Environment. Water Science 31(2): 109-121.
-
El-Dougdoug N, Nasr Eldin M, Azzam MI, Mohamed A, Hasaa M (2020) Improving Wastewater Treatment Using Dried Banana Leaves and Bacteriophage Concktial. Egyptian Journal of Botany 60(1): 199-212.
-
APHA (American Public Health Association) (2017) Standard Methods for Examination of Water and Wastewater. 23rd (Edn.), Washington, DC.
-
Azzam MI, Korayem AS, Othman SA, Mohammed FA (2022) Assessment of Some Drinking Water Plants Efficiency at El-Menofeya Governorate, Egypt. Environ Nano Monit Mang 18: 1-11.
-
Ott WR (1987) “Environmental indices”: Theory and Practice. United States: N.P pp: 230.
-
WHO (World Health Organization) and UNICEF (United Nations International Children’s Emergency Fund) (2010) Progress on Sanitation and Drinking-Water: Update. Geneva: WHO/UNICEF.
-
Elbahnasawy MA, ElSayed EE, Azzam MI (2021) Newly Isolated Coliphages for Bio-Controlling Multidrug- Resistant Escherichia Coli Strains. Environ Nanotechnol Monit Manage 16: 1-12.
-
Golterman HL (1975) Physiological Limnology, Development in Water Science. Elsevier Scientific Publishing Company.
-
Allan JD (2001) Stream Ecology: Structure and Function of Running Waters. Chapman and Hall, New York, pp: 388.
-
Soliman RM, Othman BA, Shoman SA, Gado MM, Azzam MI (2022) Assessment of Bahr El-Baqar Drain and Its Environmental Impact on Manzala Lake in Egypt. J Ecol Nat Resour 6(3): 1-14.
-
Azzam MI, Ibrahim SS (2021) Novel and Rapid Technology for Dissecting and Removing Microbial Community in Aquatic Environment. Egypt J Appl Sci 36(7-8): 185-204.
-
Yousry MM (2017) Total and Bio-Available Phosphorus in Sediments and Its Contribution to Lake Nasser Eutrophication, Egypt. Egyptian Journal of Aquatic Biology Fisheries 21(3): 29-44.
-
Azzam MI (2010) Application of Enteric Viruses in the Detection of Water Pollution. MSc, Thesis. Fac Agric, Ain Shams Univ., Cairo, Egypt.
-
Ravindra K, Meenakshi A, Rani M, Kaushik A (2003) Seasonal Variations in Physicochemical Characteristics of River Yamuna in Haryana and Its Ecological Best- Designated Use. Environ Monit 5(3): 419-426.
-
Becher KD, Schnoebelen DJ, Akers KB (2000) Nutrient Discharged to the Mississippi River from Eastern Iowa Watersheds, 1996- 1997. J Americ Wat Res Ass 36(1): 161-173.
-
Yousry MM, Salem TA, Yuosry KM (2013) Heavy Metals Pollution Origin in the Bed Sediments of Aswan High Dam Reservoir: Lithogenic or Anthropogenic Sources. Egypt J Aquat Biol Fish 17(2): 63-72.
-
Wang L, Liang T (2015) Distribution Characteristics of Phosphorus in the Sediments and Overlying Water of Poyang Lake. PLOS ONE 10(5): e0125859.
-
Tebbutt T (1998) Principles of Water Quality Control 5th (Edn.), Hallam University.
-
Doyle MP, Erickson MC (2006) Closing Door on the Fecal Coliform Assay. Microbiology 1: 162-163.
-
Ezzat SM, Azzam MI (2020) An Approach Using a Novel Phage Mix for Detecting Pseudomonas Aeruginosa in Water. Wat Environ J 34(2): 189-202.
-
Mahmoud SA (2002) Evaluation of Toxicity of Some Pollutant on Histological and Biochemical Features of Orcachomis Niloticus in River Nile, PhD thesis. fac of science Banha Branch, Zagazig University pp: 23-25.
-
Tayel SIM (2002) Histological biochemical and hematological studies on Ttilipia zilli and Clarios lazera in relation to water quality criteria at different locations in Delta Barrage. Ph.D. Thesis, Fac. of Sci. Banha Branch Zagazig Univ, Egypt pp: 134.
-
Chapman D (1992) Water Quality Assessments: A Guide to the Use of Biota, Sediments and Water in Environmental Monitoring. Chapman & Hall pp. 585.
-
Nader S (2004) Study of Evaporation Losses in Lake Nasser, PhD thesis. Faculty of Engineering, Ain Shams University.
-
Khattab MA, Nour MS, El Sheshtawy NM (2015) Genetic Identification of _Pseudomonas Aeruginosa_ Virulence Genes among Different Isolates. Journal of Microbial and Biochemical Technology 7(5): 274-277.
-
Deshmukh RA, Joshi K, Bhand S, Roy U (2016) Recent Developments in Detection and Enumeration of Water Born Bacteria: A Retrospective Minireview. Microbiology Open 5(6): 901-922.
-
Cui X, You J, Sun L, Yang X, Zhang T, et al. (2016) Characterization of Pseudomonas Aeruginosa Phage C11 and Identification of Host Genes Required for Virion Maturation. Scientific Reports 6: 39130.
-
Alsaffar M, Jarallah EM (2016) Isolation and Characterization of Lytic Bacteriophages Infecting Pseudomonas Aeruginosa from Sewage Water. International Journal of PharmTech Research 9(9): 220- 230.
- Lessons to Learn: Trees are More than the Lungs of the World
- Community Forestry Enterprises as a Model for Sustainable Forest Development: The Case Of The "Baja Tarahumara" in Chihuahua, Mexico
- Ecological and Socio-Economic Impacts of Chromolaena odorata and Mesosphaerum suaveolens, Two Invasive Alien Species in Central and Southern Benin, West Africa
- Epigenetic Sustainability: Modeling the Human Factor as a Natural Resource through Science 4.0 and the NR3C1 Biological Pilot
- Growth-at-Risk: A Framework for Assessing Economic Vulnerability
- The Rural Territory as a Socioecological System for the Management of Public Policy for Sustainable Rural Development