Altitudinal Variations in Leaf Functional Traits of some Woody Species in the Savannahs of Ngaoundere (Adamaoua, Cameroon)
In order to contribute to the sustainable management of the Ngaoundere savannahs, experiments in natural environments were carried out to assess interspecific and altitudinal variations in leaf functional traits. To do this, 20 leaves per plant were collected from 7 individuals per species, giving a total of 140 leaves per species for each of the three sites (Dang, Tchabbal and the Cliff) in the Ngaoundere Cameroon savannahs. The leaves were photographed and the images were processed using image j software to estimate leaf area. The data obtained related to certain traits such as dry mass, leaf area, thickness, leaf specific area, specific mass, dry matter content and leaf density. For each of the three sites, dry mass decreased significantly with increasing altitude, from 1.12 g at the Dang site to 0.68 g at the Cliff site. Overall, the water content is higher at the Cliff (47.33%) and lower at Tchabbal (41.93%). Thickness increases with altitude, rising from 0.20 mm at low altitudes (Dang) to 0.30 mm at high altitudes (at the Cliff) and intermediate (0.25 mm) at medium altitudes (Tchabbal). Leaf area decreased significantly with increasing altitude, from 70.45 cm2 at low altitudes (Dang) to 53.05 cm2 at high altitudes (at the Cliff) and intermediate (57.70 cm2) at medium altitudes (Tchabbal). The leaf specific area decreases significantly with altitude, from 115.95 cm2/g at the Dang site to 78.16 cm2/g at the Cliff. Dry matter content increased with altitude, rising from 0.30 g/g at Dang to 0.58 g/g at the Cliff. Specific mass increased with altitude, rising from 0.00 g/cm2 at Dang to 0.02 g/cm2 at the Cliff. Leaf density increased with altitude, from Dang (0.06 g/mm3) to the Cliff (0.10 g/mm3). Finally, the height of the woody plants decreased with altitude, from 5.08 m at Dang to 3.80 m at the Cliff. Overall, leaf traits decreased with altitude, except for thickness and density. These results would thus contribute to an understanding of the functioning of savannah ecosystems in general, and those of Ngaoundere in particular, with a view to their sustainable management.
Introduction
Savannas are vast heterogeneous complexes covering about 20 to 30 % of the earth’s surface [1], where the ratio of woody to herbaceous densities varies according to climate, soil type and human pressure [2, 3]. These vast areas play a major role in the socio-economic life of local populations, providing them with food and water, firewood, timber, energy, medicines, etc. They also provide many other ecosystem services, such as water supply and sanitation. They also provide many other ecosystem services to mankind by regulating the climate, the water cycle, the air, erosion, and as a place for recreation and tourism. However, at present, anthropogenic pressures and climatic hazards, through bush fires, poor agricultural practices, overgrazing, and anarchic felling of wood, due to demographic growth, and the increase in temperature and decrease in terrestrial rainfall, are leading to a degradation of forest ecosystems, particularly savannah ecosystems [4, 5]. This degradation can be seen in the fragmentation of savannah formations, the reduction in biodiversity, the depletion of soil organic matter and mineral elements, biological productivity and the release of carbon into the atmosphere [6, 7]. They also affect ecosystem functioning, which in fact includes the ecosystem services on which humans depend for their survival. The savannahs of Adamaoua-Cameroon, and in particular those of Ngaoundere, like other savannahs around the world, are not spared the human pressures that are leading to their degradation. Their population is expected to grow from 884.289 in 2005 to 1.308.866 in 2010. This population growth, combined with climate change, is leading to overgrazing, an increase in extensive farming practices and the exploitation of forest products, and uncontrolled urbanisation of more than 38.80% [7, 8, 9, 10].
This situation, which has prevailed for many years in the midst of general indifference, is currently provoking numerous reactions [11], particularly from the scientific community, which agrees on the urgency of the measures to be taken to coordinate the exploitation of savannahs and develop a policy for the sustainable management of these ecosystems [12, 13], in order to avoid disturbances to their functioning. Ecosystem functioning, which is the set of biotic and abiotic properties and/or processes within ecosystems, such as the recycling of organic matter and nutrients or the production of biomass, is determined through functional diversity, which represents the range and distribution of functional trait values in the community [14]. These traits exhibit intra- and interspecific and environmental variations [15, 16].
Functional traits, which may be categorical (e.g. reproductive type) or continuous (e.g. size), are morphological, biochemical, physiological, structural, phenological or behavioural characteristics expressed as phenotypes that can be measured at the scale of the individual, from the cell to the whole organism, without reference to the environment or any other level of organisation [17]. The study of biological traits is a complementary approach to taxonomic classification, making it possible to interpret the effects of human disturbance [18]. It enables us to understand how ecosystems function, as well as the adaptive strategies and responses of species to these pressures. During secondary succession, species are replaced [19], and this is often explained in terms of species adapting to changing light environments [20]. However, it is these adaptive strategies that ensure the maintenance of the species in addition to conservation actions. In addition, the term functional trait is used in many disciplines of biology such as quantitative genetics, physiology, functional ecology, demography and evolutionary biology to measure the performance of organisms [17, 21, 22, 23, 24] and it can also be used to explain many ecological processes such as photosynthesis, herbivory, etc [20].
The majority of studies on functional traits focus on herbaceous plants, as all compartments are easily accessible [25, 26, 27]. To the best of our knowledge, very few studies in this field, which has been successful in Europe or West Africa [28, 29, 30, 31, 32] have been carried out on plant traits and the links between foliar traits of woody species in the savannas of Adamaoua, Cameroon, with the exception of Mapongmetsem [33], who studied the interspecific variation in foliar traits of a few woody species in the Sudano-Guinean savannas of Ngaoundere. A better understanding of the functional traits and their variations would make it possible to understand the functional relationships between these plant species and their adaptation strategies in order to improve their conservation and the restoration programmes for these environments, which are constantly being disturbed. The aim of this study is to assess the environmental variation in the leaf traits of a number of woody species at three sites in the savannahs of Ngaoundere 3, in order to contribute to the conservation of their biodiversity and the restoration of this ecosystem.
Methodology
Presentation of the Study Area
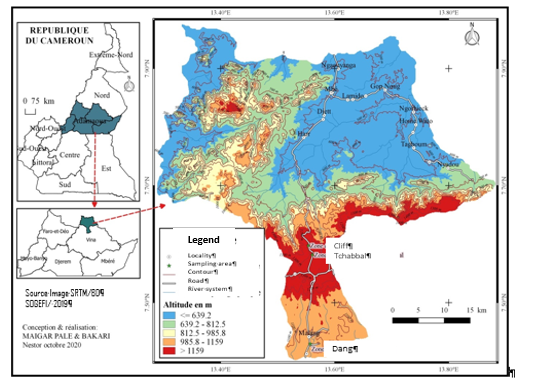
The study sites (Figure 1) are located in the Adamaoua region of Cameroon (6 - 8°N and 10 - 16°E), which covers an area of approximately 7200 km2 and is largely made up of a vast plateau with an average altitude of 1200 m, with peaks sometimes reaching 1800 m. The study area is very rugged with numerous rivers and streams.
| Altitude (m) | Disturbance | Soil | Vegetation | |
|---|---|---|---|---|
| Dang | 1060 | Pastoral activities; Crops | Acidic sandy-clay Nyasiri [34] | Presence of numerous target plant species; shrub and grass savannahs, forest galleries [35] |
| Tchabbal | 1300 | Pastoral activities; Crops | Clayey and slightly lateritic at the surface [34,36] | Absence or scarcity of some target plant species; shrub savannahs and gallery forests |
| Cliff | 1600 | Pastoral activities leading to an absence of crops and strong pressure on vegetation [37] | Covered with many stones on its surface Young and not very thick [36] | Highly heterogeneous environment [34] Savannah trees, shrubs and forest galleries [34] |
Table 1: Characteristics of the study sites.
Choice of Species
Twelve (12) socio-economically important species of the Sudano-Guinean savannahs of Ngaoundere Tchobsala [35] were selected. They are Annona senegalensis (Annonaceae), Croton macrostachyuis (Euphorbiaceae), Ficus sycomorus and Ficus thonningii (Moraceae), Harungana madagascariensis (Clusiaceae), Hymenocardia acida (Hymenocardiaceae), Piliostigma thonningii (Caesalpiniaceae), Psorospermum febrifigum (Clusiaceae), Syzigium guineense var. guineense (Myrtaceae), Terminalia glaucescens (Combretaceae), Vitellaria paradoxa (Sapotaceae), and Ximenia americana (Olacaceae). These are contrasting species comprising trees and shrubs, with evergreen and deciduous leaves. They were found in savannahs, forest galleries and cultivated areas or plantations. All individuals whose height was greater than or equal to 8 metres were considered to be trees Arbonnier [38] and the other individuals whose heights were below this value were considered to be shrubs. These species were chosen because they are a source of food for people and livestock, a source of income for farmers [39], an indicator of soil fertility Ibrahima [40, 41] and are threatened by human activities [7].
Choice of organ to be sampled
The study focuses on the leaves of ligneous trees rather than other plant organs because leaves are easily measurable and, according to Garnier and Navas [42], have closer links with the ecosystem and its functioning. The impact on trees after harvesting is not significant, because the number of leaves removed is very small compared with the total foliage. These leaves are all simple.
Effect of Sites (Environmental Effect) on Leaf Traits
To estimate leaf traits, seven mature, healthy individuals of each of the 12 species were randomly selected from three habitats (savannah, forest gallery and cultivated areas or plantations) in February 2018. A transect 50 metres wide and 500 metres long was used so that the savannah and gallery could meet. The leaf collection method recommended by Cornelissen [43] was adopted. This consisted of collecting at least ten (10) leaves per plant in a well-ventilated or sun-exposed environment. The plants selected must be mature, robust and show no signs of disease. These leaves should also be taken from all compartments of the canopy in a North-South-East-West direction, preferably 2 - 3 hours after sunrise or 3 - 4 hours before sunset. On each of the seven (07) individuals in our study, twenty (20) mature, healthy and unaltered leaves were taken at random from the four (04) cardinal points (North, South, East and West) and from the centre of the canopy, in the morning before sunrise to maintain turgidity. The experimental design was a split-plot with 7 replications. The main treatment consists of the species, the secondary treatment consists of the study sites, the replication consists of the individuals and the experimental unit consists of the leaves. A total of 5040 (12 species × 3 sites × 7 individuals × 20 leaves) were sampled.
Determining the Physical Characteristics of the Leaves
All samples of healthy and damaged leaves, stored in slightly damp, hermetically sealed plastic bags, were transported to the laboratory immediately after harvesting. After photographs had been taken (Figure 5) and the fresh mass determined by weighing with a balance, the leaf samples were placed in a Memmert oven at 60°C for at least 48 hours until a constant dry mass was obtained. The fresh mass (FF) and dry mass (DM) of the leaves were determined by weighing with a precision balance before and after oven drying. Leaf area (S) was estimated on fresh leaves using the digital imaging method (Image j). Leaf thickness (E) was determined between the veins of each leaf using an electronic caliper. Leaf length (LO) and width (LA) were determined using a graduated ruler. The water content (TE), leaf Specific area (SS), density (DE), specific mass or sclerophyll index (MSF) and dry matter content (TMS) were calculated using the following formulae:
TE (%) = ((MF-MS)/MS) × 100; SS (cm2/ g) = S/MS; DE (g/mm3) = MS/S × E; MSF (g/cm2) = MS/S TMS (g. g-1) = MS/MF. Where TE is water content (%), SS, leaf specific area (cm2/ g), DE, density (g/ mm3), MSF, specific mass (g/cm2), MF, fresh mass (g), MS, dry mass (g), S, leaf area (cm2), E, leaf thickness and TMS, leaf dry matter content (g/g).
Data Analysis
The data obtained were stored and processed using Excel spreadsheets. Two-factor analyses of variance were used to determine the effect of interaction between species, and between species and the different sites. All these tests were carried out using Statgraphic 5.0 software.
Results
Variation of Leaf Length
The leaf length of the 12 woody plants in the Ngaoundere savannahs varied significantly (P<0.05) between the study sites depending on the species (Table 2). Overall, with a mean of 12.21 cm, leaf length was longest in H. madagscariensis (17.09 cm), shortest in H. acida (5.86 cm) and intermediate in the other species.
For each of the three sites, leaf length is highest in H. madagscariensis (21.23 cm) and lowest in H. acida (6.42 cm) at the Dang site; it is highest in T. glaucescens (17.50 cm) and V. paradoxa (17.23 cm) and lowest in H. acida (5.96 cm) and X. americana (6.48 cm) at Tchabbal, and highest in H. madagascariensis (14.71 cm) and T. glaucescens (14.89 cm) and lowest in X. americana (4.60 cm) at Cliff.
Leaf length varied significantly (P<0.001) between sites (Table 5). It decreased with increasing altitude, from 13.82 cm at the Dang site to 10.73 cm at the Cliff site. The Tchabbal site is in an intermediate position with a value of 12.07 cm. For each of the 12 species, leaf length is highest at Dang (lowest site) and lowest at the Cliff (highest site), with intermediate values for the Tchabbal site, except for T. glaucescens, whose length does not differ between Dang and Tchabbal, and for F sycomorus, P. febrifugum and S. guineense var. guineense, whose length does not differ between Tchabbal and the Cliff. The interaction between sites and species was significant (Table 3), with F = 28.88 and P < 0.001.
| Species | Dang | Tchabbal | Cliff | Average | F |
|---|---|---|---|---|---|
| AS | 13.43± 1.97 e γ | 12.11± 3.22 de β | 10.2± 2.22 d α | 11.91±2.85 E | 57.62*** |
| CM | 16.22± 2.35 g γ | 14.87± 2.29 f β | 12.65±2.96 g α | 14.58± 2.94 G | 69.43*** |
| HM | 21.23± 2.90 j β | 15.34± 2.35 f α | 14.71± 2.93 f α | 17.09± 4.01 I | 239.98*** |
| FS | 13.54± 2.48 e β | 12.45± 2.34 e α | 12.40± 2.25 fg α | 12.79± 2.41 F | 10.37*** |
| FT | 11.63± 2.53 d γ | 10.6± 2.99 c β | 8.78± 1.82 c α | 10.34± 2.75 D | 46.62*** |
| HA | 6.42± 1.28 a γ | 5.96± 0.97 a β | 5.19± 0.79 b α | 5.86± 1.15 A | 50.12*** |
| PT | 14.71± 2.62 f β | 12.37± 2.95 e α | 11.91± 1.77 f α | 13.00± 2.77 F | 50.53*** |
| PF | 9.14± 1.81 b β | 8.32± 1.52 b α | 8.27± 1.75 c α | 8.58± 1.74 C | 11.48*** |
| SG | 13.08± 1.90 e β | 11.6± 1.41 d α | 11.24± 1.78 e α | 11.97± 1.88 E | 45.60*** |
| TG | 17.76± 3.04 h β | 17.50± 2.50 g β | 14.89± 2.50 f α | 16.72± 2.98 H | 48.43*** |
| VP | 18.35± 4.11 i γ | 17.23± 2.64 g β | 13.92± 3.28 e α | 16.50± 3.88 H | 64.31*** |
| XA | 10.35± 1.96 c γ | 6.48± 1.82 a β | 4.60± 1.26 a α | 7.14± 2.94 B | 41.57*** |
| Average | 13.82± 4.71 C | 12.07± 4.71 B | 10.73± 3.96 A | 12.21± 4.53 | |
| F | 385.50*** | 368.45*** | 333.71*** |
Table 2: ** Interspecific and inter-site variation in leaf Length (cm).
Numbers followed by different Arabic letters (a, b, c, d, e, f, g, h) in columns, different Greek letters (α, β and γ) and capital Arabic letters (A, B, C,) in rows (means), are significantly different at * P< 0.001. AS= Annona senegalensis ; CM= Croton macrostachyus ; HM = Harungana madagascariensis ; FS = Ficus sur; FT = Ficus thonningii ; HA = Hymenocardia acida ; PT =Piliostigma thonningii, PF = Psorospermum febrifugum; SG= Syzygium guineense var. guineense ; TG = Terminalia glaucescens ; VP= Vitellaria paradoxa; XA= Ximenia Americana. Table 2:** Interspecific and inter-site variation in leaf Length (cm).
| Source | SC | DL | MC | F |
|---|---|---|---|---|
| Species | 63852.7 | 11 | 5804.79 | 1036.15*** |
| Sites | 8070.84 | 2 | 4035.42 | 720.32*** |
| Species × sites | 3559.09 | 22 | 161.77 | 28.88*** |
Table 3: Two-factor analysis of variance (species and sites) for leaf length.
Sum of squared differences (SC), Degree of freedom (DL), Mean of squared differences (MC), significant difference at *** P < 0.001. Table 3: Two-factor analysis of variance (species and sites) for leaf length.
Variation of Leaf Width
Leaf width of the 12 woody plants varied significantly between species and sites (Table 4). Broadly speaking, with an overall mean of 6.91 cm, leaf width was highest in P. thonningii (13.25 cm), lowest in H. acida (2.85 cm) and the other species were intermediate. For each of the three sites, leaf width varied significantly between species (Table 4). It was highest in P. thonningii, with values of 13.55 cm, 13.27 cm and 12.86 cm respectively for Dang, Tchabbal and cliff; the lowest value was observed in H. acida, with values of 2.75 cm, 3.27 cm and 2.53 cm respectively for Dang, Tchabbal and the Cliff. The other species had intermediate values for each of the three sites.
Leaf width varied significantly (P<0.001) between study sites (Table 7). It decreased with increasing altitude, from 7.40 cm at Dang to 6.57 cm at the Cliff, but this value at Dang (7.40 cm) was significantly higher than those observed at Tchabbal (6.75 cm) and at the Cliff (6.57 cm), which did not differ significantly between the latté two sites. For all 12 species, there was no clear trend in leaf width variation between sites. However, for C. macrostachyus; H. madagascariensis and V. paradoxa, leaf width decreased from the Dang site to the Cliff site. For A. senegalensis, F. thonningii, P. febrifugum and S. guineense var. guineense, the value of leaf width at Dang is greater than at the other two sites (Tchabbal and at Cliff), which do not differ significantly. Finally, for P. thonningii, Dang and Tchabbal do not differ from each other and their values are higher than those of the Cliff. The interaction between sites and species is also significant (Table 5), with F = 33.66 and P< 0.001.
| Species | Dang | Tchabbal | Cliff | Average | F |
|---|---|---|---|---|---|
| AS | 7.12± 1.46 β e | 6.52± 2.29 α d | 6.68± 1.33 α e | 6.77± 1.75 G | 4.36* |
| CM | 12.71± 2.29 γ g | 11.80± 2.02 β g | 9.85± 2.41 α h | 11.46± 2.54 K | 59.17*** |
| HM | 9.87± 1.59 γ f | 8.15± 1.42 β f | 7.50± 1.70 α g | 8.51± 1.86 J | 84.65*** |
| FS | 7.73± 1.64 β e | 4.95± 1.63 α b | 9.86± 2.17 γ h | 8.11± 2.25 I | 106.63*** |
| FT | 6.27± 1.55 β d | 4.95± 1.49 α b | 4.97± 0.99 α c | 5.40± 1.50 E | 42.23*** |
| HA | 2.75± 0.45 β a | 3.27± 0.57 γ a | 2.53± 0.52 α a | 2.85± 0.60 A | 74.46*** |
| PT | 13.55± 1.88 β h | 13.32± 2.64 α β h | 12.86± 2.45 α i | 13.25± 2.36 L | 3.13* |
| PF | 4.42± 1.10 α b | 4.83± 1.03 β b | 4.67± 1.36 α β c | 4.64± 1.18 D | 4.25* |
| SG | 6.85± 0.92 β d | 5.86± 4.28 α c | 6.08± 1.29 α d | 6.26± 2.66 F | 5.41** |
| TG | 7.43± 1.72 γ e | 7.99± 1.22 β e | 7.07± 1.55 α f | 7.50± 1.55 H | 13.21*** |
| VP | 4.79± 0.82 γ b | 4.59± 0.64 β b | 3.57± 0.98 α b | 4.32± 0.98 C | 86.86*** |
| XA | 5.31± 1.31 γ c | 3.01± 0.48 α a | 3.21± 0.47 β b | 3.84± 1.34 B | 309.73*** |
| Average | 7.40± 3.43 B | 6.75± 3.60 A | 6.57± 3.35 A | 6.91± 3.48 | |
| F | 247.46*** | 374.06*** | 541.19*** |
Table 4: ** Interspecific and inter-site variation in leaf width (cm).
Numbers followed by different Arabic letters (a, b, c, d, e, f, g, h) in columns, different Greek letters (α, β and γ) and capital Arabic letters (A, B, C,) in rows (means), are significantly different at * P< 0.001. AS= Annona senegalensis ; CM= Croton macrostachyus ; HM = Harungana madagascariensis ; FS = Ficus sur; FT = Ficus thonningii ; HA = Hymenocardia acida ; PT =Piliostigma thonningii, PF = Psorospermum febrifugum; SG= Syzygium guineense var. guineense ; TG = Terminalia glaucescens ; VP= Vitellaria paradoxa; XA= Ximenia Americana. Table 4:** Interspecific and inter-site variation in leaf width (cm).
| Source | SC | DL | MC | F |
|---|---|---|---|---|
| Species | 44372.6 | 11 | 4033.87 | 1434.43*** |
| Sites | 640.08 | 2 | 113.81 | 113.81*** |
| Species × sites | 2082.57 | 22 | 33.66 | 33.66*** |
Table 5: Two-factor (species and site) analysis of variance for leaf width.
Sum of squared differences (SC), Degree of freedom (DL), Mean of squared differences (MC), significant difference at ***: P < 0.001. Table 5: Two-factor (species and site) analysis of variance for leaf width.
Variation of Leaf Fresh Mass
The fresh mass of the leaves of the 12 woody plants varied significantly between species and sites (Table 6). With an overall mean value of 1.87 g, leaf fresh mass was highest in P. thonningii (4.92 g) and lowest in H. acida (0.29 g), with the other species showing intermediate values. For each of the three sites, the fresh mass of the leaves varied significantly between species (Table 6). It was highest in P. thonningii at all sites, with values of 5.39 g, 5.24 g and 4.14 g respectively for Dang, Tchabbal and the Cliff; the lowest value was observed in H. acida, with values of 0.37 g, 0.27 g and 0.22 g respectively for Dang, Tchabbal and the Cliff, but also in X. americana (0.21g) at the Cliff. The other species showed intermediate values for each of the three sites.
Fresh leaf mass varied significantly between sites (P < 0.001) (Table 6). Overall, it decreased significantly (P < 0.01) with increasing altitude, from 2.37 g at the Dang site to 1.46 g at the Cliff site. Tchabbal is in an intermediate position with a value of 1.78 g. For A. senegalensis, C. macrostachyus, H. acida, T. glaucescens and Ximenia americana the fresh mass of the leaves is highest at Dang and lowest at the Cliff, with intermediate values for the Tchabbal site. For H. madagascariensis, F. sur, F. thonningii and S. guineense var. guineense, the value for fresh leaf mass at Dang was higher than at the other sites (Tchabbal and Cliff), which did not differ significantly. On the other hand, for P. thonningii, P.
febrifugum and V. paradoxa, the fresh mass value of leaves from Dang and Tchabbal, which do not differ from each other, is significantly higher than those from the Cliff. The interaction between sites and species is significant (Table 7), with an F value of 24.80 and P < 0.001.
| Species | Dang | Tchabbal | Cliff | Average | F |
|---|---|---|---|---|---|
| AS | 3.57±1.39 γ f | 1.90±0.70 β d | 1.49±0.82 α de | 2.32± 1.36 G | 162.74*** |
| CM | 3.37±0.92 γ e | 3.11±1.09 β f | 2.36±0.88 α f | 2.95± 1.05 H | 40.01*** |
| HM | 4.15±1.20 β g | 2.55±1.00 α e | 2.34±1.47 α f | 3.01±1.48 H | 89.20*** |
| FS | 1.92±0.67 β d | 1.33±0.99 α c | 1.16±0.62 α c | 1.47±0.84 E | 36.42*** |
| FT | 1.71±0.97 β d | 0.87±0.49 α b | 0.77±0.36 α b | 1.11±0.78 D | 84.48*** |
| HA | 0.37±0.14 γ a | 0.27±0.07 β a | 0.22±0.05 α a | 0.29±0.11 A | 85.18*** |
| PT | 5.39±1.84 β h | 5.24±1.66 β g | 4.14±1.56 α g | 4.92±1.78 I | 22.74*** |
| PF | 0.84±0.59 β b | 0.80±0.47 β b | 0.68±0.28 α b | 0.77±0.47 C | 4.70*** |
| SG | 1.82±0.58 β d | 1.39±0.37 α c | 1.32±0.36 α cd | 1.51±0.50 E | 51.09*** |
| TG | 2.14±0.70 γ d | 1.90±0.64 β d | 1.63±0.94 α e | 1.89±0.79 F | 19.49*** |
| VP | 1.78±0.64 β d | 1.74±0.86 β d | 1.18±0.57 α c | 1.57±0.75 E | 31.34*** |
| XA | 1.41±0.67 γ c | 0.31±0.14 β a | 0.21±0.14 α a | 0.64±0.67 B | 370.52*** |
| Average | 2.37± 1.69 C | 1.78±1.55 B | 1.46±1.32 A | 1,87±1.58 | |
| F | 319.09*** | 386.27*** | 248.24*** |
Table 6: ** Interspecific and inter-site variation in fresh leaf mass (g).
Numbers followed by different Arabic letters (a, b, c, d, e, f, g, h) in columns, different Greek letters (α, β and γ) and capital Arabic letters (A, B, C,) in rows (means), are significantly different at * P< 0.001. AS= Annona senegalensis ; CM= Croton macrostachyus ; HM = Harungana madagascariensis ; FS = Ficus sur; FT = Ficus thonningii; HA = Hymenocardia acida; PT =Piliostigma thonningii, PF = Psorospermum febrifugum; SG= Syzygium guineense var. guineens; TG = Terminalia glaucescens ; VP= Vitellaria paradoxa; XA= Ximenia Americana. Table 6:** Interspecific and inter-site variation in fresh leaf mass (g).
| Source | SC | DL | MC | F |
|---|---|---|---|---|
| Species | 7623.13 | 11 | 693.01 | 905.82*** |
| Sites | 722.81 | 2 | 361.40 | 472.39*** |
| Species × sites | 417.38 | 22 | 18.97 | 24.80*** |
Table 7: Analysis of fresh mass variance between species and sites.
Sum of squared differences (SC), Degree of freedom (DL), Mean of squared differences (MC), significant difference at ***: P < 0.001. Table 7: Analysis of fresh mass variance between species and sites.
Variation of Leaf Dry Mass
Leaf dry mass of the 12 woody species varied significantly (P< 0.001) between species and between study sites (Table 8). With an overall mean value of 0.88 g, leaf dry mass was highest in P. thonningii (2.02 g), lowest in H. acida (0.19 g) and intermediate in the other species. In each of the three sites, leaf dry mass varied significantly between species (Table 8). It was highest for P. thonningii at all sites, with values of 2.32 g, 1.91 g and 1.84 g respectively for Dang, Tchabbal and the Cliff; the lowest value was observed for H. acida, with values of 0.24 g, 0.17 g and 0.16 g respectively for Dang, Tchabbal and the Cliff, but also for X. americana at Tchabbal (0.22 g) and at the Cliff (0.18 g). The other species had intermediate values at each of the three sites. Leaf dry mass varied significantly between sites (P<0.001) (Table 8). Overall, it decreased significantly (P<0.01) with increasing altitude, from 1.12 g at the Dang site to 0.68 g at the Cliff site. Tchabbal is in an intermediate position with a value of 0.85 g. For C. macrostachyus, H. madagascariensis, T. glaucescens and X. americana, leaf dry mass is highest at Dang and lowest at the Cliff, with intermediate values for the Tchabbal site. For A. senegalensis, F. sur, H. acida and P. thonningii, the leaf dry mass value at Dang is higher than those at the other sites (Tchabbal and Cliff), which do not differ significantly. On the other hand, for F. thonningii, P. febrifugum and S. guineense var. guineense, the leaf dry mass values for Dang and Tchabbal, which do not differ from each other, are significantly higher than those for Cliff. The interaction between sites and species is significant (Table 9), with F = 25.87 and P < 0.001.
| Species | Dang | Tchabbal | Cliff | Average | F |
|---|---|---|---|---|---|
| AS | 1.73± 0.61 β g | 1.01±0.50 α e | 1.00±0.41 α e | 1.25±0.61 G | 90.49*** |
| CM | 1.44±0.40 γ f | 1.22±0.45 β f | 0.93±0.26 α e | 1.20±0.43 FG | 62.21*** |
| HM | 1.63±0.48 γ g | 1.00±0.34 β e | 0.48±0.32 α c | 1.04±0.61 E | 301.82*** |
| FS | 1.09±0.58 β e | 0.71±0.38 α c | 0.70±0.36 α d | 0.83±0.49 D | 33.33*** |
| FT | 0.48±0.25 β b | 0.44±0.14 β b | 0.36±0.20 α b | 0.43±0.21 C | 11.71*** |
| HA | 0.24±0.7 β a | 0.17±0.07 α a | 0.16±0.04 α a | 0.19±0.07 A | 61.61*** |
| PT | 2.32±0.77 β h | 1.91±059 α g | 1.84±0.94 α f | 2.02±0.81 H | 15.07*** |
| PF | 0.55±0.29 β b | 0.49±0.24 β b | 0.37±0.16 α b | 0.47±0.25 C | 20.28*** |
| SG | 0.91±0.24 β d | 0.91±0.27 β d | 0.70±0.16 α d | 0.84±0.25 D | 38.98*** |
| TG | 1.44±0.44 γ f | 1.18±0.41 β f | 0.96±0.37 α e | 1.19±0.45 F | 47.90*** |
| VP | 0.98±0.54 β d | 0.93±0.25 β de | 0.50±0.21 α c | 0.80±0.42 D | 71.03*** |
| XA | 0.67±0.27 γ c | 0.22±0.11 β a | 0.18±0.06 α a | 0.36±0.28 B | 341.36*** |
| Average | 1.12±0.73 C | 0.85±0.58 B | 0.68±0.58 A | 0.88±0.66 | |
| F | 247.46*** | 264.91*** | 217.95*** |
Table 8: ** Interspecific and inter-site variation in leaf dry mass (g).
Numbers followed by different Arabic letters (a, b, c, d, e, f, g, h) in columns, different Greek letters (α, β and γ) and capital Arabic letters (A, B, C,) in rows (means), are significantly different at * P< 0.001. AS= Annona senegalensis ; CM= Croton macrostachyus ; HM = Harungana madagascariensis ; FS = Ficus sur; FT = Ficus thonningii; HA = Hymenocardia acida; PT =Piliostigma thonningii, PF = Psorospermum febrifugum; SG= Syzygium guineense var. guineense; TG = Terminalia glaucescens; VP= Vitellaria paradoxa; XA= Ximenia Americana. Table 8:** Interspecific and inter-site variation in leaf dry mass (g).
| Source | SC | DL | MC | F |
|---|---|---|---|---|
| Species | 1174.05 | 11 | 106.73 | 678.32*** |
| Sites | 166.37 | 2 | 83.18 | 528.69*** |
| Species × sites | 89.53 | 22 | 4.06 | 25.87*** |
Table 9: Analysis of variance with two factors (species and sites) concerning dry mass.
Sum of squared differences (SC), Degree of freedom (DL), Mean of squared differences (MC), significant difference at : *** : P < 0.001. Table 9: Analysis of variance with two factors (species and sites) concerning dry mass.
Variation of Moisture Content
Table 10 shows the interspecific and intersite variations in leaf water content for the 12 woody species surveyed. This moisture content varies significantly (P < 0.001) between sites and between species, except in the case of C. macrostachyus and F. sur. With an overall mean value of 44.85%, leaf water content was highest in H. madagascariensis (73.99%), lowest in H. acida (23.91%) and intermediate in the other species.
In each of the three sites, leaf water content varied significantly (P<0.001) between species (Table 10). It was highest in F. thonningii (88.48%), H. madagascariensis (71.31%) and H. madagascariensis (92.26%) at Dang, Tchabbal and at the Cliff respectively. The lowest values were observed for T. glaucescens (21.81%) and H. acida (22.52%) at the Dang site, for S. guineense var. guineense (21.69%), X. americana (23.60%) and H. acida (25.39%) at the Tchabbal site and for X. americana (15.07%) and H. acida (23.82%) at the Cliff site. The other species showed intermediate values for each of the three sites.
Leaf water content varied significantly (P<0.001) between sites, except for C. macrostachyus and F. sur (Table 13). Overall, it was highest at the Cliff (47.33%), lowest at Tchabbal (41.93%) and intermediate at Dang (45.31%). No
clear trend emerged for any of the 12 woody species studied. Variation in leaf water content between sites is influenced by species. The interaction between sites and species is significant (Table 11), with an F value of 23.76 and P < 0.001.
| Species | Dang | Tchabbal | Cliff | Average | F |
|---|---|---|---|---|---|
| AS | 42.97 ±5.02αβ cd | 40.40 ± 4.88 β cd | 33.81 ± 4.08 α bc | 39.06± 4.72C | 4.30* |
| CM | 50.44±6.74α def | 65.58 ± 8.76 β e | 62.16 ± 8.30αβ d | 59.39± 7.94E | 2.51ns |
| HM | 58.42 ± 13.47α f | 71.31 ± 16.45 α e | 92.26 ± 21.28 β e | 73.99± 17.07G | 46.01*** |
| FS | 38.06 ±4.91α bc | 46.74 ± 6.03 α d | 37.28 ± 4.81 α c | 40.69±5.25CD | 1.53ns |
| FT | 88.48 ± 36.32 γ g | 37.59 ± 15.43 α bcd | 60.22 ± 24.72 β d | 62.09 ± 25.49F | 33.57*** |
| HA | 22.52 ± 1.34β a | 25.39 ± 1.51 β a | 23.82 ± 1.42 α ab | 23.91 ± 1.43 A | 5.75* |
| PT | 52.85 ± 9.02α ef | 74.25 ± 12.85 β e | 61.69 ± 10.53αβ d | 62.93 ± 10.75E | 3.05 * |
| PF | 27.96 ± 5.38 α ab | 38.35 ± 7.38 β bcd | 41.02 ± 7.90 β c | 35.77± 6.89BC | 2.05* |
| SG | 39.44±11.69β bcd | 21.69 ± 6.43α a | 37.74 ± 11.18 β c | 32.95 ± 9.79 BC | 14.48*** |
| TG | 21.81 ± 5.63 α a | 28.39 ± 7.34 αβ ab | 36.78 ± 9.51 β c | 28.99 ± 7.50 B | 2.80* |
| VP | 45.49±17.50α cde | 29.95 ± 11.53 α abc | 66.22 ± 25.48 β d | 47.22± 18.19D | 11.27*** |
| XA | 55.37 ±37.50 β ef | 23.60 ± 15.98 α a | 15.07 ± 12.19 α a | 31.34 ± 21.23 B | 26.65*** |
| Average | 45.31 ± 18.30 B | 41.93 ± 18.75 A | 47.33 ± 21.50 C | 44.85 ± 20.37 | |
| F | 29.76*** | 13.61*** | 48.79*** |
Table 10: ** Inter-specific and inter-site variation in leaf water content (%).
Numbers followed by different Arabic letters (a. b. c. d. e. f. g. h) in columns, different Greek letters (α. β and γ) and capital Arabic letters (A. B. C.) in rows (means), are significantly different at * P< 0.001. AS= Annona senegalensis ; CM= Croton macrostachyus ; HM = Harungana madagascariensis ; FS = Ficus sur; FT = Ficus thonningii ; HA = Hymenocardia acida ; PT =Piliostigma thonningii. PF = Psorospermum febrifugum; SG= Syzygium guineense var. guineense ; TG = Terminalia glaucescens ; VP= Vitellaria paradoxa; XA= Ximenia Americana. Table 10:** Inter-specific and inter-site variation in leaf water content (%).
| Source | SC | DL | MC | F |
|---|---|---|---|---|
| Species | 2.16 | 11 | 1.96 | 58.15*** |
| Sites | 798120.00 | 2 | 399060.00 | 11.82*** |
| Species × sites | 1.76 | 22 | 802394.00 | 23.76*** |
Table 11: Two-factor analyses of variance (species and sites) for leaf water content.
Sum of squared differences (SC). Degree of freedom (DL). Mean of squared differences (MC), significant difference at : *** : P < 0.001 Table 11: Two-factor analyses of variance (species and sites) for leaf water content.
Variation of Leaf Thickness
Table 12 shows the leaf thickness values for the ligneous plants studied. They vary significantly (P < 0.001) between sites and species. With a mean value of 0.25 mm, leaf thickness was highest overall for H. madagascariensis (0.35 mm), lowest for A. senegalensis (0.19 mm) and F. sur (0.19 mm) and intermediate for the other species.
In each of the three sites, leaf thickness varied significantly (P<0.001) between species (Table 12). It was lowest in S. guineense var. guineense (0.12 mm) and highest in A. senegalensis (0.32 mm) at the Dang site; it was lowest in A. senegalensis at the Tchabbal (0.13 mm) and at the Cliff (0.13 mm) sites and highest in H. acida (0.33 mm) at the Tchabbal sites and in H. madagascariensis (0.55 mm) at the Cliff. The other species had intermediate values at each of the three sites.
Leaf thickness varied significantly (P<0.001) between sites (Table 15). Overall, it increased with altitude, rising from 0.20 mm at low altitudes (Dang) to 0.30 mm at high altitudes (Cliff) and intermediate (0.25 mm) at medium altitudes (Tchabbal). For C. macrostachyus. H. madagascariensis. T. glaucescens and X. americana, leaf dry mass is highest at Dang and lowest at the Cliff, with intermediate values for the Tchabbal site. For H. madagascariensis. S. guineense var. guineense and T. glaucescens, the value of leaf thickness increases with altitude from Dang to Cliff. On the other hand, for P. thonningii. V. paradoxa and X. americana, the leaf thickness value at Cliff is significantly higher than those at Tchabbal and Dang, which do not differ significantly from each other. The interaction between sites and species is significant (Table 13), with an F value of 339.19 and P < 0.001.
| Species | Dang | Tchabbal | Cliff | Average | F |
|---|---|---|---|---|---|
| AS | 0.30± 0.02 β i | 0.13±0.02 α a | 0.13±0.03 α a | 0.19±0.08 A | 1482.48*** |
| CM | 0.22± 0.02 α f | 0.30±0.03 β g | 0.21±0.04 α c | 0.24±0.05 D | 234.70*** |
| HM | 0.18±0.04 α d | 0.31±0.04 β gh | 0.55±0.05 γ h | 0.35±0.15 I | 1871.61*** |
| FS | 0.14±0.04 α b | 0.23±0.05 γ c | 0.21±0.02 β c | 0.19±0.05 A | 188.95*** |
| FT | 0.26±0.03 α h | 0.31±0.03 β h | 0.31±0.03 β e | 0.29±0.04 H | 117.60*** |
| HA | 0.20±0.03 α e | 0.33±0.05 β i | 0.20±0.03 α b | 0.24±0.07 D | 443.15*** |
| PT | 0.23±0.02 α g | 0.23±0.02 α c | 0.33±0.02 β f | 0.26±0.05 F | 659.61*** |
| PF | 0.26±0.03 β b | 0.24±0.03 α d | 0.28±0.05 γ d | 0.22±0.07 C | 457.22*** |
| SG | 0.12±0.02 α a | 0.27±0.03 β e | 0.36±0.12 γ g | 0.25±0.12 E | 366.72*** |
| TG | 0.21±0.02 α f | 0.28±0.05 β f | 0.31±0.03 γ e | 0.27±0.05 F | 237.08*** |
| VP | 0.15±0.03 α c | 0.15±0.03 α b | 0.31±0.05 β e | 0.20±0.08 B | 678.46**** |
| XA | 0.25±0.03 α h | 0.23±0.03 α cd | 0.36±0.15 β g | 0.28±0.10 G | 96.26*** |
| Average | 0.20±0.06 A | 0.25±0.07 B | 0.30±0.12 C | 0.25±0.09 | |
| F | 418.73*** | 351.60*** | 328. 86*** |
Table 12: ** Interspecific and inter-site variation in leaf thickness (mm).
Numbers followed by different Arabic letters (a. b. c. d. e. f. g. h) in columns, different Greek letters (α. β and γ) and capital Arabic letters (A. B. C.) in rows (means), are significantly different at * P< 0.001. AS= Annona senegalensis ; CM= Croton macrostachyus ; HM = Harungana madagascariensis ; FS = Ficus sur; FT = Ficus thonningii; HA = Hymenocardia acida; PT =Piliostigma thonningii. PF = Psorospermum febrifugum; SG= Syzygium guineense var. guineense; TG = Terminalia glaucescens; VP= Vitellaria paradoxa; XA= Ximenia Americana. Table 12:** Interspecific and inter-site variation in leaf thickness (mm).
| Source | SC | DL | MC | F |
|---|---|---|---|---|
| Species | 9.75 | 11 | 0.88 | 360.27*** |
| Sites | 7.89 | 2 | 3.94 | 1603.02*** |
| Species × sites | 18.37 | 22 | 0.83 | 339.19*** |
Table 13: Two-factor analyses of variance (species and sites) for leaf thickness.
Sum of squared differences (SC). Degree of freedom (DL). Mean of squared differences (MC), significant difference at : *** : P < 0.001 Table 13: Two-factor analyses of variance (species and sites) for leaf thickness.
Leaf Area Variation
The leaf area of the 12 species studied varied significantly (P < 0.001) between study sites and species (Table 14). With an overall mean value of 60.40 cm2, leaf area was highest in P. thonningii (13.30 cm2), lowest in X. americana (10.36 cm2) and H. acida (13.30 cm2) and intermediate in the other species.
In each of the three sites, leaf area varied significantly (P<0.001) between species (Table 14). Leaf area was highest in P. thonningii at all study sites, with values of 119.12 cm2,
117.40 cm2 and 107.90 cm2 at Dang, Tchabbal and at the Cliff respectively. It was lowest in X. americana, with values of 12.14 cm2, 9.59 cm2 and 9.35 cm2 respectively at Dang. Tchabbal and at the Cliff, but with H. acida at Dang (15.31 cm2) and at the Cliff (9.46 cm2). The other species had intermediate values at each of the three sites.
Leaf area varied significantly between sites (Table 14). Overall, it decreased significantly with increasing altitude, from 70.45 cm2 at low altitudes (Dang) to 53.05 cm2 at high altitudes (Cliff) and intermediate (57.70 cm2) at medium altitudes (Tchabbal). For S. guineense var. guineense and T. glaucescens, the leaf area value is significantly highest at Dang and lowest at the Cliff, with intermediate values for the Tchabbal site. For C. macrostachyus. H. acida. P. thonningii and P. febrifugum. This leaf area value at the Cliff site is significantly lower than those at Dang and Tchabbal, which do not differ significantly from each other. On the other hand, for the rest of the species, the leaf area at Dang is significantly higher than those at Tchabbal and at the Cliff, which do not differ significantly between them. The interaction between sites and species was also significant (Table 15), with an F value of 10.31 and P < 0.001.
| Species | Dang | Tchabbal | Cliff | Average | F |
|---|---|---|---|---|---|
| AS | 87.82 ±31.91β e | 66.05± 19.19 α g | 62.81± 18.17α f | 72.22± 26.33 F | 45.23*** |
| CM | 114.10 ±81.38 β g | 110.46 ± 20.39 β i | 93.04 ±25.40 α h | 105.87 ±51.32 I | 6.92** |
| HM | 79.41 ±25.12 β d | 67.15± 17.76 α g | 66.55± 22.32 α f | 71.03± 22.68 F | 15.30*** |
| FS | 87.83± 50.11 β ef | 54.21 ±23.27 α f | 53.03 ±22.62 α e | 65.02± 37.99 E | 45.99*** |
| FT | 46.37± 31.04 β c | 34.98± 9.74 α d | 34.38 ±13.82 α c | 38.58 ±21.09 C | 15.33*** |
| HA | 15.31± 4.98 β a | 15.15 ±4.84 β b | 9.46 ±3.10 α a | 13.30± 5.16 A | 80.29*** |
| PT | 119.12 ±40.35 β g | 117.40± 50.85 β j | 107.90 ±21.77 α i | 114.81 ±39.74 J | 3.27* |
| PF | 32.25 ±17.11 β b | 29.29± 11.44 β c | 23.10± 8.70 α b | 28.21 ±13.43 B | 18.33*** |
| SG | 50.15± 12.94 γ c | 43.07 ±9.36 β e | 39.95± 6.41 α d | 44.39± 10.79 D | 38.69*** |
| TG | 101.99± 30.34 γ f | 77.28 ±19.27 β h | 71.42 ±14.46 α g | 83.56 ±25.96 H | 73.66*** |
| VP | 98.87 ±23.26 β f | 67.82± 13.87 α g | 65.60± 17.37 α f | 77.43 ±23.97 G | 140.30*** |
| XA | 12.14 ±4.35 β a | 9.59± 3.47 α a | 9.35± 5.18 α a | 10.36± 4.56 A | 17.36*** |
| Average | 70.45± 50.74 C | 57.70± 38.49 B | 53.05± 34.04 A | 60.40 ±32.33 | |
| F | 155.81*** | 376.36*** | 488.53*** |
Table 14: ** Inter-specific and inter-site variation in leaf area.
Numbers followed by different Arabic letters (a. b. c. d. e. f. g. h) in columns, different Greek letters (α. β and γ) and capital Arabic letters (A. B. C.) in rows (means), are significantly different at * P< 0.001. AS= Annona senegalensis ; CM= Croton macrostachyus ; HM = Harungana madagascariensis ; FS = Ficus sur; FT = Ficus thonningii; HA = Hymenocardia acida; PT =Piliostigma thonningii. PF = Psorospermum febrifugum; SG= Syzygium guineense var. guineense; TG = Terminalia glaucescens; VP= Vitellaria paradoxa; XA= Ximenia Americana. Table 14:** Inter-specific and inter-site variation in leaf area.
| Source | SC | DL | MC | F |
|---|---|---|---|---|
| Species | 5.29 | 11 | 481808.81 | 728.81*** |
| Sites | 272522.00 | 2 | 136261.00 | 206.12*** |
| Species × sites | 149890.00 | 22 | 6813.18 | 10.31*** |
Table 15: Two-factor analyses of variance (species and sites) for leaf area.
Sum of squared differences (SC). Degree of freedom (DL). Mean of squared differences (MC), significant difference at ***: P < 0.001. Table 15: Two-factor analyses of variance (species and sites) for leaf area.
Specific Leaf Area Variation
Table 16 shows the specific leaf area values for the species studied. They vary significantly (P < 0.001) between study sites and species, except in the case of P. febrifugum where there is no significant difference. With an overall mean value of 87.55 cm2/g. specific leaf area was highest in V. paradoxa (142.90 cm2/g), lowest in X. americana (44.92 cm2/g) and intermediate in the other species.
In each of the three sites, specific leaf area varied significantly (P<0.001) between species (Table 16). It was highest in V. paradoxa (268.09 cm2/g) and lowest in X. americana (22.32 cm2/g) at the Dang site, highest in F. sur (97.37 cm2/g) and lowest in S. guineense var. guineense (52.02 cm2/g) for the Tchabbal site and the highest for F. thonningii (135.99 cm2/g), the lowest for H. madagascariensis (44.19 cm2/g) for the Cliff site. The other species had intermediate values at each of the three sites.
Specific leaf area varied significantly (P<0.001) between sites (Table 16). Overall, it decreased significantly with increasing altitude, from 115.95 cm2/g for Dang to 78.16 cm2/g for Cliff, and intermediate (68.56 cm2/g) for Tchabbal. For P. febrifugum, the specific leaf area did not differ significantly between the three study sites. On the other hand, for H. madagascariensis. F. sur. H. acida and T. glaucescens, the value of specific leaf area is significantly highest at Dang and lowest at the Cliff, with intermediate values for the Tchabbal site. For C. macrostachyus. S. guineense var guineense and V. paradoxa. This value of specific leaf area at Dang is significantly higher than those at Tchabbal and at the Cliff, which do not differ significantly between them. For the other species, there was no clear trend in the variation in specific leaf area between study sites. The interaction between sites and species was also significant (Table 17), with an F value of 43.02 and P < 0.001.
| Species | Dang | Tchabbal | Cliff | Average | F |
|---|---|---|---|---|---|
| AS | 56.03 ±26.29 α b | 82.16 ±53.63β def | 74.23 ±38.30 β c | 70.20 ±42.31 C | 14.97*** |
| CM | 136.09± 119.70β ef | 83.94 ±33.01 α def | 86.31 ±38.98 α d | 102.11±78.73 E | 21.50*** |
| HM | 231.34± 152.70γ g | 77.34 ±42.54 β cd | 44.19 ±20.28 α a | 117.62±103.03 F | 164.01*** |
| FS | 149.93± 110.94 γ g | 97.37± 68.89 β g | 60.27 ±42.62 α b | 102.53± 87.27 E | 45.17*** |
| FT | 117.91± 93.54 β de | 88.77± 39.37 α efg | 135.99± 96.24 β e | 114.23 86.84 F | 11.04*** |
| HA | 94.34 ±39.74 γ cd | 68.94± 39.29 β bc | 60.60± 23.82 α b | 74.62± 37.82 CD | 35.14*** |
| PT | 69.53± 36.31 β bc | 83.11± 60.77 γ def | 51.39 ±19.57 α ab | 68.01± 44.26 BC | 19.1*** |
| PF | 70.04 ±42.65 α bc | 75.21± 45.87 α cd | 72.37 ±39.24 α c | 72.56 ±46.41 CD | 0.45ns |
| SG | 74.30 ±22.80 β bc | 52.02 ±26.41 α a | 47.48± 14.73 α a | 57.93± 24.77 B | 60.30*** |
| TG | 101.48± 60.53 γ d | 91.41± 40.39 α fg | 54.38± 21.32 β ab | 82.42 ±48.15 D | 44.92*** |
| VP | 268.09 ±103.93 β h | 78.38± 28.88 α cde | 82.22± 43.30 α cd | 142.90±108.51 G | 51.93*** |
| XA | 22.32± 16.05 α a | 59.19± 31.62 β ab | 53.26± 33.92 β ab | 44.92± 36.32 A | 51.66*** |
| Average | 115.95± 104.47 C | 78.16 ±46.82 B | 68.56± 40.26 A | 87.55 ± 79.53 | |
| F | 54.14*** | 11.60*** | 45.52*** |
Table 16: ** Interspecific and inter-site variation in specific leaf area (cm2/g).
Numbers followed by different Arabic letters (a. b. c. d. e. f. g. h) in columns, different Greek letters (α. β and γ) and capital Arabic letters (A. B. C.) in rows (means), are significantly different at * P< 0.001. AS= Annona senegalensis ; CM= Croton macrostachyus ; HM = Harungana madagascariensis ; FS = Ficus sur; FT = Ficus thonningii; HA = Hymenocardia acida; PT =Piliostigma thonningii. PF = Psorospermum febrifugum; SG= Syzygium guineense var. guineense ; TG = Terminalia glaucescens ; VP= Vitellaria paradoxa ; XA= Ximenia Americana. Table 16:** Interspecific and inter-site variation in specific leaf area (cm2/g).
| Source | SC | DL | MC | F |
|---|---|---|---|---|
| Species | 3.73 | 11 | 339436.00 | 58.46*** |
| Sites | 2.10 | 2 | 1.05 | 181.62*** |
| Species × sites | 5.49 | 22 | 249776.00 | 43.02*** |
Table 17: Two-factor analyses of variance (species and sites) for specific leaf area.
Sum of squared differences (SC), Degree of freedom (DL), Mean of squared differences (MC) significant difference at ***: P < 0.001. Table 17: Two-factor analyses of variance (species and sites) for specific leaf area.
Leaf Dry Matter Content Variation
The dry matter content of the 12 woody species studied varied significantly between study sites and species (Table 18), with the exception of F. sur and H. acida where the difference between sites was not significant (P>0.05). With an overall mean value of 0.63 g/g. leaf dry matter content was highest in P. febrifugum (0.80 g/g) and X. americana (0.83 g/g), lowest in H. madagascariensis (0.40 g/g) and intermediate in the other species.
In each of the three sites, the dry matter content varied significantly (P<0.001) between species (Table 18). It was highest in P. febrifugum (0.85 g/g) and lowest in C.
macrostachyus (0.30 g/g) and H. madagascariensis (0.32 g/g) at the Dang site, highest in X. americana (1.05 g/g) and lowest in H. madagascariensis (0.45 g/g) at the Tchabbal site, and the highest values for X. americana (0.85 g/g) and T. glaucescens (0.87 g/g) and the lowest for H. madagascariensis (0.43 g/g) at the Cliff site. The other species had intermediate values for each of the three sites.
Dry matter content varied significantly (P<0.001) between sites (Table 18). Overall, it was highest at Tchabbal (0.70 g/g), lowest at Dang (0.54 g/g) and intermediate at the Cliff (0.65 g/g). Sites did not differ significantly for F.
sur and H. acida. In C. macrostachyus, dry matter content increased with altitude, rising from 0.30 g/g at Dang to 0.58 g/g at the Cliff and intermediate at Tchabbal (0.52 g/g). In H. madagascariensis. F. thonningii. P. thonningii, and V. paradoxa, the dry matter content at Dang is significantly lower than at Tchabbal and at the Cliff, which do not differ significantly from each other. For the remaining species, there was no clear trend in the variation of dry matter content between study sites. The interaction between sites and species was also significant (Table 19), with an F value of 6.61 and P < 0.001.
| Species | Dang | Tchabbal | Cliff | Average | F |
|---|---|---|---|---|---|
| AS | 0.53 ±0.21 α c | 0.83 ±0.56 β ef | 0.62± 0.38 α cd | 0.66± 0.43 DE | 19.49*** |
| CM | 0.30 ±0.13 α a | 0.52± 0.21 β ab | 0.58± 0.28 γ bcd | 0.46± 0.24 B | 63.55*** |
| HM | 0.32± 0.28 α a | 0.45± 0.25 β a | 0.43± 0.19 β a | 0.40 ±0.29 A | 9.02*** |
| FS | 0.66± 0.44 α de | 0.76 ±0.59 α de | 0.66 ±0.42 α d | 0.69± 0.56 EF | 1.38ns |
| FT | 0.38 ±0.29 α ab | 0.66± 0.46 β cd | 0.61± 0.43 β bcd | 0.55 ±0.45 C | 13.77*** |
| HA | 0.70± 0.33 α e | 0.73± 0.33 α β de | 0.78 ±0.28 α ef | 0.74 ±0.31 F | 2.14ns |
| PT | 0.41 ±0.23 α b | 0.51± 0.34 β ab | 0.51± 0.28 β ab | 0.47 ±0.29 B | 5.41* |
| PF | 0.85± 0.62 β f | 0.87± 0.64 β f | 0.69 ±0.59 α de | 0.80± 0.66 G | 3.22* |
| SG | 0.53± 0.17 α c | 0.73± 0.24 β de | 0.53 ±0.21 α abc | 0.60± 0.23 C | 40.77*** |
| TG | 0.64 ±0.47 α de | 0.68 ±0.33 α cd | 0.87± 0.52 β f | 0.73± 0.46 F | 10.69*** |
| VP | 0.54± 0.42 α c | 0.60 ±0.29 αβ bc | 0.67± 0.43 β d | 0.60± 0.39 C | 4.05* |
| XA | 0.60 ±0.37 α cd | 1.05± 0.61 γ g | 0.85± 0.61 β f | 0.83± 0.57 G | 23.93*** |
| Average | 0.54± 0.40 A | 0.70 ±0.46 C | 0.65± 0.48 B | 0.63± 0.45 | |
| F | 28.12*** | 20.78*** | 11.74*** |
Table 18: ** Interspecific and inter-site variation in dry matter content (g/g).
Numbers followed by different Arabic letters (a. b. c. d. e. f. g. h) in columns, different Greek letters (α. β and γ) and capital Arabic letters (A. B. C.) in rows (means), are significantly different at * P< 0.001. AS= Annona senegalensis ; CM= Croton macrostachyus ; HM = Harungana madagascariensis ; FS = Ficus sur; FT = Ficus thonningii; HA = Hymenocardia acida; PT =Piliostigma thonningii. PF = Psorospermum febrifugum; SG= Syzygium guineense var. guineense; TG = Terminalia glaucescens ; VP= Vitellaria paradoxa; XA= Ximenia Americana. Table 18:** Interspecific and inter-site variation in dry matter content (g/g).
| Source | SC | DL | MC | F |
|---|---|---|---|---|
| Species | 87.65 | 11 | 7.96 | 43.85*** |
| Sites | 23.17 | 2 | 11.58 | 63.78*** |
| Species × sites | 26.43 | 22 | 1.20 | 6.61*** |
Table 19: Analyses of variance of the two factors (species and sites) concerning dry matter content.
Sum of squared differences (SC). Degree of freedom (DL). Mean of squared differences (MC), significant difference at ***: P < 0.001. Table 19: Analyses of variance of the two factors (species and sites) concerning dry matter content.
Specific Leaf Mass Variation
Table 20 shows the specific leaf mass of the 12 woody species studied. It varied significantly (P< 0.001) between sites and species, with the exception of C. macrostachyus. F. thonningii and P. febrifugum where the difference between sites was not significant (P > 0.05). With an overall mean value of 0.01 g/ cm2, leaf density was highest in X. americana (0.03 g/ cm2), lowest in V. paradoxa (0.01 g/ cm2) and intermediate in the other species.
In each of the three sites, the specific leaf mass varied significantly (P<0.001) between species (Table 20). It was highest in X. americana at all three sites, with values of 0.06 g/ cm2. 0.02 g/ cm2 and 0.03 g/ cm2 at Dang. Tchabbal and at the Cliff respectively, and in S. guineense var. guineense (0.02 g/ cm2) at Tchabbal. On the other hand, this value is lowest in V. paradoxa (0.00 g/ cm2) and H. madagascariensis (0.00 g/ cm2) at Dang, in T. glaucescens (0.01 g/ cm2) at Tchabbal and in F. thonningii (0.01 g/ cm2) at the Cliff. The other species had intermediate values at each of the three sites.
Leaf specific mass varied significantly (P<0.001) between sites (Table 20). Overall, the value at Tchabbal (0.01 g/ cm2) was lower than those at the other two sites (0.02 g/ cm2), which did not differ significantly. By species, the sites do not differ significantly in C. macrostachyus. F. thonningii and P. febrifugum. For H. madagascariensis, the value increases with altitude, rising from 0.00 g/ cm2 at Dang to 0.02 g/ cm2 at the Cliff, with an intermediate value at Tchabbal (0.01 g/ cm2). In the case of F. sur. P. thonningii and T. glaucescens, the value of the specific leaf mass at the Cliff is higher than those at Dang and Tchabbal, which do not differ significantly between these two sites. For the rest of the species, there was no clear trend in the variation in leaf density between study sites. The interaction between sites and species was also significant (Table 21), with an F value of 64.73 and P < 0.001.
| Species | Dang | Tchabbal | Cliff | Average | F |
|---|---|---|---|---|---|
| AS | 0.02 ±0.01 β g | 0.01± 0.00 α cd | 0.01 ±0.00 α c | 0.01 ±0.00 D | 13.50*** |
| CM | 0.01 ±0.00 α bc | 0.01± 0.00 α ab | 0.01 ±0.00 α ab | 0.01± 0.00 AB | 5.78ns |
| HM | 0.00± 0.00 α a | 0.01± 0.00 β cd | 0.02 ±0.00 γ f | 0.01± 0.00 C | 189.37*** |
| FS | 0.01 ±0.00 α b | 0.01± 0.00 β bc | 0.02 ±0.00 γ e | 0.01± 0.00 C | 48.96*** |
| FT | 0.01 ±0.00 β de | 0.01± 0.00 αβ ad | 0.01 ±0.00 α a | 0.01± 0.00 B | 2.85ns |
| HA | 0.01 ±0.00 α cd | 0.01 ±0.00 β de | 0.01± 0.00 β cd | 0.01 ±0.00 C | 27.97*** |
| PT | 0.01 ±0.00 α ef | 0.01± 0.00 α ef | 0.02± 0.01 β e | 0.01± 0.01 DE | 5.90* |
| PF | 0.02 ±0.01 α ef | 0.01 ±0.01 α ef | 0.01± 0.00 α cd | 0.01± 0.01 DE | 1.25ns |
| SG | 0.01±0.00α cde | 0.02 ±0.00 β g | 0.02 ±0.00 β e | 0.02 ±0.00 E | 54.34*** |
| TG | 0.01±0.00α bcd | 0.01 ±0.00 α a | 0.02± 0.00 β de | 0.01± 0.00 C | 60.54*** |
| VP | 0.00± 0.00 α a | 0.01 ±0.00 β abc | 0.01± 0.00 β bc | 0.01± 0.00 A | 81.72*** |
| XA | 0.06 ±0.03 γ h | 0.02± 0.01 α g | 0.03± 0.02 β g | 0.03± 0.02 F | 91.87*** |
| Average | 0.02± 0.01 B | 0.01± 0.00 A | 0.02± 0.01 B | 0.01 ±0.00 | |
| F | 168.83*** | 17.17*** | 30.24*** |
Table 20: ** Interspecific and inter-site variation in leaf density (g/ cm2).
Numbers followed by different Arabic letters (a. b. c. d. e. f. g. h) in columns, different Greek letters (α. β and γ) and capital Arabic letters (A. B. C.) in rows (means), are significantly different at * P< 0.001. AS= Annona senegalensis ; CM= Croton macrostachyus ; HM = Harungana madagascariensis ; FS = Ficus sur; FT = Ficus thonningii ; HA = Hymenocardia acida; PT =Piliostigma thonningii. PF = Psorospermum febrifugum; SG= Syzygium guineense var. guineense; TG = Terminalia glaucescens ; VP= Vitellaria paradoxa; XA= Ximenia Americana. Table 20:** Interspecific and inter-site variation in leaf density (g/ cm2).
| Source | SC | DL | MC | F |
|---|---|---|---|---|
| Species | 0.22 | 11 | 0.02 | 147.27*** |
| Sites | 0.01 | 2 | 0.00 | 41.48*** |
| Species × sites | 0.20 | 22 | 0.009 | 64.73*** |
Table 21: Two-factor analyses of variance (species and sites) for specific mass.
Sum of squared differences (SC). Degree of freedom (DL). Mean of squared differences (MC), significant difference at : *** : P < 0.001. Table 21: Two-factor analyses of variance (species and sites) for specific mass.
Leaf Density Variation
The leaf density of the 12 woody plants varied significantly (P < 0.001) between species and sites (Table 22). With an overall mean value of 0.08 g/ mm3, leaf density was highest in X. americana (0.14 g/ mm3), lowest in F. thonningii (0.04 g/ mm3) and intermediate in the other species. In each of the three sites, leaf density varied significantly (P<0.001) between species (Table 22). It was highest in X. americana (0.020 g/ mm3) and lowest in H. madagascariensis (0.02 g/mm3) at Dang; highest in A. senegalensis (0.12 g/ mm3) and lowest in H. madagascariensis (0.02 g/ mm3) at Tchabbal, and the highest for S. guineense var. guineense (0.18 g/ mm3) and the lowest for F. thonningii (0.04 g/ mm3) at the Cliff. The other species had intermediate values at each of the three sites.
Leaf density varied overall and significantly (P<0.001) between sites (Table 22). Overall, the value at Cliff (0.10 g/ mm3) was significantly higher than those at Dang (0.06 g/ mm3) and Tchabbal (0.07 g/ mm3), which did not differ significantly. By species, in H. acida. P. thonningii and S. guineense var. guineense, the value of leaf density increased with altitude, from Dang to the Cliff, via Tchabbal. In the case of H. madagascariensis. F. sur and P. febrifugum, the leaf density value at the Cliff is higher than those at Dang and Tchabbal, which do not differ significantly between the letter two sites. For the rest of the species, there was no clear trend in leaf density variation between study sites. The interaction between sites and species was also significant (Table 23), with an F value of 56.89 and P < 0.001.
| Species | Dang | Tchabbal | Cliff | Average | F |
|---|---|---|---|---|---|
| AS | 0.07 ± 0.03 α ef | 0.12 ± 0.07 β g | 0.13 ± 0.08 β d | 0.11 ± 0.07 I | 32.71*** |
| CM | 0.05 ± 0.03 β cd | 0.04± 0.01 α b | 0.06 ± 0.03 γ b | 0.05 ± 0.02 AB | 20.94*** |
| HM | 0.02 ± 0.01 α a | 0.02 ± 0.01 α a | 0.15 ± 0.08 β e | 0.06 ± 0.05 DE | 292.14*** |
| FS | 0.07 ± 0.05 α fg | 0.07 ± 0.06 α cd | 0.10 ± 0.06 β c | 0.08 ± 0.06 G | 12.81*** |
| FT | 0.05 ± 0.05 β d | 0.04 ± 0.02 α b | 0.04 ± 0.03 α a | 0.04 ± 0.03 A | 9.55** |
| HA | 0.04 ± 0.02 α bc | 0.08 ± 0.04 β e | 0.09 ± 0.04 γ c | 0.07± 0.04 EF | 90.34*** |
| PT | 0.05 ± 0.02 α cd | 0.08 ± 0.06 β de | 0.09 ± 0.03 γ c | 0.07 ± 0.04 F | 33.79*** |
| PF | 0.08 ± 0.06 α g | 0.07 ± 0.04 α c | 0.14 ± 0.09 β d | 0.09 ± 0.07 H | 34.48*** |
| SG | 0.05 ± 0.01 α cd | 0.06± 0.03 β c | 0.18 ± 0.07 γ f | 0.10 ± 0.07 H | 335.58*** |
| TG | 0.05 ± 0.03 β de | 0.04 ± 0.02 α b | 0.06 ± 0.02 γ b | 0.05 ± 0.03 BC | 16.60*** |
| VP | 0.03 ± 0.02 α b | 0.10 ± 0.04 γ f | 0.05 ± 0.03 β ab | 0.06 ± 0.04 CD | 102.79*** |
| XA | 0.20 ± 0.14 γ h | 0.09 ± 0.04 α ef | 0.12 ± 0.10 β d | 0.14 ± 0.12 J | 36.31*** |
| Average | 0.06 ± 0.05 A | 0.07 ± 0.05 A | 0.10 ± 0.07 B | 0.08 ± 0.07 | |
| F | 86.76*** | 51.79*** | 62.42*** |
Table 22: ** Inter-specific and inter-site variation in leaf density (g/mm3)
Numbers followed by different Arabic letters (a. b. c. d. e. f. g. h) in columns, different Greek letters (α. β and γ) and capital Arabic letters (A. B. C.) in rows (means), are significantly different at * P< 0.001. AS= Annona senegalensis ; CM= Croton macrostachyus ; HM = Harungana madagascariensis ; FS = Ficus sur; FT = Ficus thonningii; HA = Hymenocardia acida; PT =Piliostigma thonningii. PF = Psorospermum febrifugum; SG= Syzygium guineense var. guineense; TG = Terminalia glaucescens; VP= Vitellaria paradoxa; XA= Ximenia Americana. Table 22:** Inter-specific and inter-site variation in leaf density (g/mm3)
| Source | SC | DL | MC | F |
|---|---|---|---|---|
| Species | 3.50 | 11 | 0.31 | 93.07*** |
| Sites | 1.43 | 2 | 0.71 | 210.23*** |
| Species × sites | 4.28 | 22 | 0.19 | 56.89*** |
Table 23: Two-factor analyses of variance (species and sites) for leaf density.
Sum of squared differences (SC). Degree of freedom (DL). Mean of squared differences (MC), significant difference at : *** : P < 0.001 Table 23: Two-factor analyses of variance (species and sites) for leaf density.
Individuals Height variation
The height of woody individuals varied significantly (P < 0.001) between the study sites and species (Table 24). With an overall mean value of 4.39 m. the height of woody plants was highest in S. guineense var. guineense (9.71 m), lowest in H. acida (1.87 m) and intermediate in the other species.
In each of the three sites, the height of individuals varied significantly (P < 0.001) between species (Table 24). Height was highest in S. guineense var. guineense at all three sites, with values of 11.50 m. 8.71 m and 8.92 m at Dang. Tchabbal and at the Cliff respectively. This height value is lowest for H. acida (1.80 m) at Dang, for P. febrifugum (1.76 m) at Tchabbal and for A. senegalensis (1.72 m) and H. acida (1.77 m) at the Cliff. The other species show intermediate values for each of the three sites.
Overall, the height of the woody plants varied significantly (P<0.001) between sites (Table 24). Overall, the height of woody plants decreased with altitude, from 5.08 m at Dang to 3.80 m at the Cliff, with an intermediate value at Tchabbal (4.29 m). By species, for seven species (A. senegalensis. C. macrostachyus. H. madagascariensis. F. thonningii. P. thonningii. T. glaucescens and V. paradoxa), the height of woody plants decreased with altitude, from Dang to the Cliff, via Tchabbal. In the case of P. febrifugum. S. guineense var. guineense and X. americana, the height of woody plants at Dang was significantly higher than at Tchabbal and at the Cliff, which did not differ significantly between the letter two sites. The interaction between sites and species was also significant (Table 25), with an F value of 35.86 and P < 0.001.
| Species | Dang | Tchabbal | Cliff | Average | F |
|---|---|---|---|---|---|
| AS | 2.40 ± 0.5 γ bc | 1.84± 0.32 β ab | 1.72 ± 0.18 α a | 1.98± 0.49 AB | 119.84*** |
| CM | 6.64 ± 1.55 γ f | 5.64 ± 1.38 β d | 4.78 ± 0.79 α d | 5.69 ± 1.49 F | 72.80*** |
| HM | 2.63 ± 0.51 γ c | 2.24 ± 0.55 β c | 2.08 ± 0.47 α b | 2.32 ± 0.56 C | 42.04*** |
| FS | 5.57 ± 0.68 β e | 5.50 ± 1.28 β d | 4.90 ± 1.01 α d | 5.32± 1.06 E | 18.18*** |
| FT | 6.90 ± 1.17 γ g | 6.07± 1.47 β e | 4.50 ± 1.49 α c | 5.82 ± 1.70 FG | 107.81*** |
| HA | 1.80 ± 0.16 α a | 2.05 ± 0.60 β bc | 1.77 ± 0.17 α a | 1.87 ± 0.39 A | 24.52*** |
| PT | 3.24 ± 0.60 γ d | 2.32± 0.42 β c | 2.04 ± 0.22 α b | 2.53 ± 0.68 D | 276.20*** |
| PF | 2.34 ± 0.43 β b | 1.76 ± 0.26 α a | 1.77 ± 0.33 α a | 1.96 ± 0.44 AB | 123.92*** |
| SG | 11.50 ± 1.79 β i | 8.71± 1.91 α g | 8.92 ± 2.40 α f | 9.71 ± 2.41 I | 79.58*** |
| TG | 8.78 ± 1.41 γ h | 7.50 ± 0.94 β f | 6.42 ± 1.32 α e | 7.57± 1.91 H | 70.53*** |
| VP | 6.85 ± 0.95 γ fg | 5.92 ± 0.25 β e | 4.78 ± 0.64 α d | 5.85± 1.20 G | 202.74*** |
| XA | 2.30 ± 0.52 β b | 1.95 ± 0.25 α ab | 1.87 ± 0.10 α ab | 2.04 ± 0.38 B | 59.68*** |
| Average | 5.08 ± 3.14 C | 4.29 ± 2.67 B | 3.80 ± 2.43 A | 4.39 ± 2.81 | |
| F | 1372.80*** | 669.50*** | 732.84*** |
Table 24: ** Interspecific and inter-site variation in foot height (m).
Numbers followed by different Arabic letters (a. b. c. d. e. f. g. h) in columns, different Greek letters (α. β and γ) and capital Arabic letters (A. B. C.) in rows (means), are significantly different at * P< 0.001. AS= Annona senegalensis ; CM= Croton macrostachyus ; HM = Harungana madagascariensis ; FS = Ficus sur ; FT = Ficus thonningii ; HA = Hymenocardia acida ; PT =Piliostigma thonningii. PF = Psorospermum febrifugum; SG= Syzygium guineense var. guineense ; TG = Terminalia glaucescens ; VP= Vitellaria paradoxa ; XA= Ximenia Americana. Table 24:** Interspecific and inter-site variation in foot height (m).
| Source | SC | DL | MC | F |
|---|---|---|---|---|
| Species | 32104.60 | 11 | 2918.6 | 2618.86*** |
| Sites | 1402.12 | 2 | 701.06 | 629.06*** |
| Species × sites | 879.16 | 22 | 35.86 | 35.86*** |
Table 25: Analyses of variance with two factors (species and sites) concerning the height of ligneous plants.
Sum of squared differences (SC). Degree of freedom (DL). Mean of squared differences (MC), significant difference at : *** : P < 0.001. Table 25: Analyses of variance with two factors (species and sites) concerning the height of ligneous plants.
Discussion
Inter-site variation in these morphological traits allows two groups to be distinguished: those whose values decrease with the altitudinal gradient (length, width, fresh and dry mass, leaf area, Leaf specific area and individual height), and those whose values increase with the altitudinal gradient (water content, thickness, dry matter content, specific mass and leaf density).
In the first group, all the traits vary significantly between sites (environment) and species (biotic), as well as between their interaction. Overall, it is characterised by size-related traits, and it seems clear that leaf size decreases with altitude. In the case of this study, the length, width and fresh and dry masses of the leaves also decrease, with the exception of certain species such as H. acida. T. glaucescens. F. sur. P. febrifugum and X. americana for width, which do not respect this rule. These variations may be linked to the physiology of each woody. The leaf development of P. thonningii, for example, is more marked in the direction of its width, unlike the other species. In relation to fresh mass, the loss of water through the leaves with altitude does not lead to a change in the order of dry mass values obtained here. On the other hand, it was found that species such as H. acida and X. americana, although small in size, have large thickness values. This could be explained by the fact that species with small leaf areas generally invest more in thickness, which leads to slow growth and therefore a high capacity for conserving resources. In relation to soil fertility. Garnier [62] believe that this type of species, when abundant in an environment, indicates that the environment is not very fertile.
Leaf area decreases with altitude in this study. This could be explained by the fact that the altitudinal environment becomes more restrictive for these species the higher up you go. It’s true that the larger the leaf area, the more photosynthesis takes place and the better the plant functions, but ultimately it varies according to the environment and/or even the altitude. We share the same climate, but temperature and soil could also account for the variations observed. In the same vein. Mapongmetsem [44] show that leaves with reduced surface area limit transpiration while ensuring good photosynthesis of carbohydrates. Some authors believe that the ferralitic nature of the soil in Adamaoua could explain the variations observed in plants in various habitats. Specifically in Cameroon. Martin and Segalen [45] explain that the soil in Adamaoua becomes less ferralitic towards the northern edge of the plateau. i.e. towards the cliffs. In the same vein. Nalovic and Pinta [40], also on Madagascar soils, concluded that ferralitic soils were relatively richer than tropical ferruginous soils. The results obtained here in Cameroon and presented in this study confirm and clarify the value of this conclusion: at higher altitudes, plants are smaller in size and develop their root systems to a greater extent.
Leaf specific area thus reflects the opposition between investment in growth (high specific surface area) versus investment in defences and reserves (low specific surface area) [46]. According to Wright [46], species with a high specific surface area have sparse leaf tissue, a high rate of photosynthesis and a high growth rate, resulting in a high capacity to acquire resources (exploitative species, dominant in fertile environments). On the other hand, species with a low specific surface area have dense leaf tissue and grow slowly, resulting in a high capacity to conserve resources (conservative species, dominant in less fertile environments).
The height of the trees also decreases as you move towards the Cliff. Where the altitude is around 1.600 metres. Climatic conditions could explain this result. Altitude increases as you go towards the Cliff, and tree leaves tend to reduce in size in order to adapt better to these conditions. These results are in line with those obtained in a study carried out by Korner [47] in a temperate climate. In his study, he showed that the subalpine environment is subject to harsh climatic conditions, since altitude interacts with other factors such as temperature, rainfall, snow cover, length of vegetation, light and wind strength.
For Nyasiri [34], in the Sudano-Guinean savannas, other factors such as bush fires, overgrazing. etc. would provide additional explanations for these variations. Being a livestock area par excellence, there are generally many herds of cattle grazing on the Falaise de Ngaoundere. All these pressures could therefore to some extent explain the decline in leaf size in the Falaise de Ngaoundere. Chalvin [48] showed in a study that the mountain environment is an environment where the responses of individuals to biotic and abiotic conditions are very marked.
Overall, then, at morphological level, it has long been known that climate and soil characteristics influence leaf size, shape and structure [49, 50, 51, 52, 53, 54]. The temperature increases towards the north of Cameroon. Review articles generally show an increase in the specific mass and density of mesophyll in response to stresses such as low rainfall, high light levels, extreme temperatures or ozone pollution [55, 56].
In the second group, for the majority of species, the traits vary significantly between sites (environment) and species (biotic), as well as between their interaction. This group is made up of traits whose values increase with altitude (water content, thickness, dry matter content, specific mass and leaf density). The increase in thickness of most species with altitude is due to the fact that climatic conditions are harsher for these species, which develop their root system more. The leaves of these species therefore become denser.
Wright [57] point out in a study that tree leaves tend to be harder, denser and have a smaller specific surface area. In the savannah, species have to constantly regulate the inflow and outflow of water into and out of their bodies, so they have to reduce certain trait values (leaf area and specific surface), to the detriment of other traits (density, water content. etc.). In terms of ecosystem functioning. Westoby [58] shows that the link between dry matter content and specific surface area is even more appreciated when we look at the ecological strategies reflected by these functional traits. Plants with a high specific surface area and low dry matter content will grow rapidly and acquire resources efficiently in the short term in relation to the amount of organic matter invested. Conversely, plants with a high dry matter content and low specific surface area grow less quickly but have longer- lasting leaves, which enable them to store nutrients. A high rate of photosynthesis is associated with thin leaves. i.e. high specific surface area [57] and low dry matter content [60, 61].
Garnier [62] showed that dry matter content provides an approximation of leaf tissue density and is correlated with the nutrient conservation strategy within the plant. In a similar vein. Souto [63] showed in a study of a tropical tree (Embothrium coccineum) that an increase in specific mass (smaller, thicker leaves) is a response to increased heat and drought in summer. This variation in specific mass is also linked to light management. This certainly explains why, at the same level of light, tolerant species have lower specific masses (high specific surface area and small thickness) than other species [64, 65, 66]. In any case, intolerant species are known to have thicker leaves [67, 68, 64, 69]. Species characteristic of undergrowth also have longer-lived leaves associated with lower specific masses [70, 71].
The conditions in each environment influence the different traits studied. The altitudinal gradient reveals these different variations. Most of the traits show a clear regression with altitude, while others show an increase.
Conclusion
At the end of this study, the twelve traits associated with the species in our study had practically the same variation trend from one site to another. Some of them vary from 0.12 mm to 0.30 mm respectively in S. guineense var. guineense and A. senegalensis at Dang; and from 0.13 mm to 0.33 mm respectively in A. senegalensis and H. acida at the Cliff, for thickness; from 12.14 cm2 to 119.12 cm2 at Dang; and from 9.35 cm2 to 107.90 cm2 at the Cliff for leaf area. It varies from 22.32 cm2/ g to 268.09 cm2/ g respectively in X. americana and V. paradoxa at Dang, from 44.19 cm2/ g to 135.99 cm2/ g respectively in H. madagascariensis and F. thonningii at the Cliff; from 0.30 g. g-1 to 0.85 g. g-1 respectively in C. macrostachyus and P. febrifugum at Dang, and from 0.43 g. g-1 to 0.87 g. g-1 respectively in H. madagascariensis and T. glaucescens at the Cliff for dry matter content; from 0.00 g/ cm2 to 0.06 g/ cm2 respectively in V. paradoxa and X. americana at Dang, from 0.01 g/ cm2 to 0.03 g/ cm2 respectively in F. thonningii and X. americana at the Cliff for specific mass; from 0.02 g.mm-3 to 0.20 g.mm-3 respectively in H. madagascariensis and X. americana at Dang, and from 0.04 g.mm-3 to 0.18 g.mm-3 in F. thonningii and S. guineense var. guineense at the Cliff for leaf density. Overall, traits such as tree length, width, fresh mass, dry mass, leaf area, specific surface area and height decrease. Overall, traits such as the lenght, width, fresh mass, dry mass, leaf area, leaf specific area and height decrease with altitude, i.e, towards the cliff site. Traits such as water content and dry matter content, on the other hand, increase.
References
-
Scholes J, Hall DO (1996) The carbon budget of tropical savannas, woodlands and grasslands. In: Dans Breymeyre, et al. (Eds.), Global change: effects of coniferous forests and grasslands. SCOPE, Wiley, New York, pp: 69-100.
-
Schimel DS, Parton WJ, Kittel TG, Ojima DS, Cole CV (1990) Grasslands biochemistry links to atmospheric processes. Climate Change 17: 13-25.
-
Skarpe C (1992) Dynamics of savanna ecosystems. Journal of Vegetation Science 3(3): 293-300.
-
Youssaou (2011) Les questions environnementales sur la desertification au Cameroun. Atelier sur les statistiques de l’environnement, Yaounde- Cameroun, du 05 au 09 2011. MINEP, pp: 26.
-
Mirabel A (2018) Reponse et Resilience de la Biodiversite d’une Forêt Tropicale après Perturbation. Thèse de doctorat en Sciences et Technologies, Universite de Guyane, France, pp : 100.
-
Lawton JH (1999) Are there general laws in ecology ? Oikos 84: 177-192.
-
Tchotsoua M (2006) Evolution recente des territoires de l’Adamaoua central : de la spatialisation à l’aide pour un developpement maitrise. Universite d’Orleans. Ecole doctorale Sciences de l’homme et de la societe. HDR en Geographie-Amenagement-Environnement, pp : 267.
-
Tchobsala, Amougou A, Mbolo M (2010) Impact of wood cuts on the structure and floristic diversity of vegetation in the peri-urban zone of Ngaoundere, Cameroon. Journal of Ecology Nature Environment 2(11): 235-258.
-
Nyasiri J (20140 Impact de l’exploitation des ressources naturelles de la biodiversite ligneuse de la vegetation de la falaise de Ngaoundere (Adamaoua), Memoire de Master, Faculte de Sciences, Universite de Ngaoundere, pp: 103.
-
Haoua M, Tchobsala, Ibrahima A (2016) Impact of mount Ngaoundal exploitation on vegetation evolution: Implication on sustainable management. International Journal of Current Research 8(9): 37740-37751.
-
Levêque C (1994) Environnement et diversite du vivant. Cite des Sciences et de l’industrie, Paris, pp: 128.
-
Fujisaka S, Castilla C, Escobar G, Rodrigues V, Veneklaas EJ, et al. (1998) The effects of conversion on annual crops and pastures : Estimates of carbone missions and plant species loss in a Brazilian Amazon colony. Agriculture Ecosystems and Environment 69: 17-26.
-
Garba Z, Ngounou Ngatcha B, Durand A, Sebag D (2010) Le reseau Impacts : «Analyse multi- echelle de la pression anthropique et du climat du Sahel». Pangea 47-48,
-
Diaz S, Noy-Meir L, Cabido M (2001) Can grazing response of herbaceous plants be predicted from simple vegetative traits?. Journal of Applied Ecology 38(3): 497- 508.
-
Albert CH, Grassein F, Schurr F, Vieilledent G, Violle C (2011) When and how should intraspecific variability be considered in trait-based plant ecology? Perspectives in Plant Ecology Evolution and Systematics 13(3): 217- 225.
-
Violle C, Enquist BJ, McGill B, Jiang L, Albert CH, et al. (2012) The return of variance: intraspecific variability in community ecology. Trends in Ecology and Evolution 27(4): 244-252.
-
Violle C, Navas ML, Vile D, Kazakou E, Fortunel C, et al. (2007b) Let the concept of trait be functional! Oikos 116: 882-892.
-
Payeur ME (2010) Effets des pratiques sylvicoles sur les traits fonctionnels des communautes vegetales de friches arbustives. Memoire presente à la Faculte des etudes superieures en vue de l’obtention du grade de Maître ès sciences (M.Sc) en Sciences biologiques, Universite de Montreal, Canada, pp: 40.
-
Kassi NJ, Yongo OD, Ake Assi A, Decocq G (2011) L’interêt d’une approche systematique des dynamiques de vegetations en phytosiciologie forestière tropicale : cas de la forêt classee de Sanaimbo à Bongouanou/Dimbokro (Côte d’ivoire). International Journal of Biological and Chemical Sciences 5(3) : 1337-1350.
-
Lohbeck MWM (2014) Ecologie fonctionnelle du retablissement de la forêt tropicale. Thèse de doctorat, Universite de Wageningen, Wageningen, pp: 224.
-
Paucelle M (2016) Utilisation des traits fonctionnels au sein d’un modèle global de vegetation : analyse de trois approches complementaires axees sur les ecosystèmes forestiers. Universite pierre et Marie Curie- Paris VI ? Français, pp: 255.
-
Kassaut J (2019) Reponse de traits fonctionnels foliaires et anatomiques chez l’Olivier sauvage (Olea europaea L.) dans un environnement heterogène et changeant : le modèle du Maroc soumis aux changements globaux, pp: 288.
-
Denelle P (2019) Nature et signature de l’optimalite dans l’assemblage des communautes. Thèse de Doctorat/ Ph.D. Universite Montpellier, pp: 280.
-
Martinez- Gonzalez I, Ruiz- Guerra B, Velasquez- Rosas N (2019) Elevational relationship between functional leaf traits and insect herbivory in two cloud forest understory species in Mexico. Ecoscience 26(4): 341- 346.
-
Tangourdeau S, Diatta S, Ndiaye D, Mathieu D, Ickowicz (20170 Les herbiers, un outil pour etudier les variations des traits fonctionnels des espèces saheliennes, pp: 1-2.
-
Kervroëdan L (2018) Plant traits and functional diversity effects of runoff and sediment retention: application to soil erosion control in temperate agricultural catchments. Ph.D thesis, the University of Picardie Jules Verne, France, pp: 260.
-
Larbat L (2020) Metabolisme specialise des plantes sous contraintes biotiques et abiotiques: le comprendre, le moduler, l’utiliser. Habilitation à Diriger des Recherches, Universite de Lorraine, France, pp: 102
-
Seastedt TR, Crossley DAJ (1984) The influence of arthropods on ecosystems. Bioscience 34(3): 157-161.
-
Brenes A, Coley T, Kursar PD (2009) Pests vs. drought as determinants of plant distribution along a tropical rainfall gradient. Ecology 90(7): 1751-1761.
-
Stein C, Unsicker SB, Kahmen A, Wagner M, Audorff V, et al. (2010) Impact of invertebrate herbivory in grasslands depends on plant species diversity. Ecology 91(6): 1639- 1650.
-
Marone D (2015) Etude du potentiel de stock de carbone d’espèces agroforestières et de leurs traits fonctionnels en lien avec les systèmes d’utilisation des terres au Senegal. Ph.D. en sciences forestières, Universite de Laval, Canada, pp: 188.
-
Adiko AEG, Houphlet SDK, Dogbo SF, Vroh BTA, Kouame D, et al. (2020) Variabilite des traits fonctionnels des espèces arborescentes dans la reconstitution de la vegetation du Parc National d’Azagny (Côte d’Ivoire). Int J Biol Chem Sci 14(2): 424-439.
-
Mapongmetsem PM, Ibrahima A, Tchuenguem Fohouo FN, Moussou L (1998) Leaf thickness and toughness as they relate to sclerophylly in woody species of the Sudano-guinea Savanna of Cameroon. Biosciences Proceedings 5: 343-348.
-
Nyasiri J (2018) Anthropisation et dynamique spatio- temporelle des paysages forestiers de la falaise de Ngaoundere (Adamaoua-Cameroun). Thèse de Doctorat/ Ph. D. Universite de Ngaoundere, Cameroun, pp: 181.
-
Tchobsala (2010) Influence des coupes de bois sur la dynamique de la vegetation naturelle de la zone peri- urbaine de Ngaoundere (Adamaoua). Thèse de Doctorat Phd, Universite de Yaounde I, Cameroun, pp: 204.
-
PCD (2013) Plan communal de developpement de la Vina, pp: 290
-
Tchobsala, Ibrahima A, Dongock ND, Nyasiri J (2016b) The impact of anthropisation on the floristic composition, the structure and ecological characterization of the Ngaoundere Cliff, Cameroon. Global journal of Science Frontier Research Biological 16(3): 2249-4626.
-
Arbonnier (2000) Arbres, arbustes et lianes des zones sèches de l’Afrique de l’Ouest. CIRAD MNHN-UICN, Montpellier, pp: 541
-
Mapongmetsem PM (2005) Phenologie et apports au sol des substances biogènes de la litière des feuilles de fruitiers sauvages des savanes soudano-guineennes. Thèse de Doctorat d’Etat, Universite de Yaounde I, Cameroun, pp: 268.
-
Ibrahima A, Mapongmetsem PM, Bouitang D, Hassana B (2007) Regeneration of some fuelwood tree species of humid savannah of Adamawa, Cameroun. Effects of season and cutting height. Ghana Journal of Science 47: 45- 57.
-
Ibrahima A, Souhore P, Hassana B, Babba H (2017) Perceptions des agriculteurs, indicateurs et strategies de gestion de la fertilite des sols dans les savanes Soudano-guineennes de l’Adamaoua, Cameroun. Journal international du developpement et de la durabilite 6(12): 2035-2057.
-
Garnier E, Navas ML (2013) Diversite Fonctionnelle Des Plantes (ed De Boeck). Bruxelles.
-
Cornelissen JHC, Lavorel S, Garnier E, Díaz S, Buchmann N, et al. (2003) A handbook of protocols for standardised and easy measurement of plant functional traits worldwide. Australian Journal of Botany 51: 335-380.
-
Mapongmetsem PM, Kapchie VN, Tefempa BH (2012) Diversity oflocal fruit trees and their contribution insustaining the rural livelihood in the northern Cameroon. Ethiopian Journal of Environmental Studies and Management 5(1): 32-46.
-
Martin D, Segalen P (1966) Carte pedologique du Cameroun orientale au 1/1000000. ORSTOM centre de Yaounde.
-
Wright IJ, Reich PB, Westoby M, Ackerly DD, Baruch Z, et al. (2004) The worldwide leaf economics spectrum. Nature 428: 821-827.
-
Körner C (1999) Alpine plant life: Functional plant ecology of high mountain ecosystems. Springer, New York.
-
Chalvin L, Etienne J, Faure U, Fernandez F, Gervot M (2015) Etude de l’influence des facteurs biotiques et abiotiques sur la variabilite des individus de Rosa pimpinellifolia et Berberis vulgaris. Rapport d’ecole de terrain Mednet, pp: 18.
-
Cordell S, Goldstein G, Mueller-Dombois D, Webb D, Vitousek PM (1998) Physiological and morphological variation in Metrosideros polymorpha, a dominant Hawaiian tree species, along an altitudinal gradient: the role of phenotypic plasticity. Oecologia 113: 188-196.
-
Cunningham SA, Summerhayes B, Westoby M (1999) Evolutionary divergences in leaf structure and chemistry, comparing rainfall and soil nutrient gradients. Ecological Monographs 69(4): 569-588.
-
Givnish TJ (1987) Comparative studies of leaf form– Assessing the relative roles of selective pressures and phylogenetic constraints. New Phytologist 106(s1): 131- 160.
-
Givnish TJ (1988) Adaptation to sun and shade: a whole- plant perspective. Australian Journal of Plant Physiology 15(2): 63-92.
-
Nunez Olivera E, Martinez Abaigar J, Escudero JC (1996) Adaptability of leaves of Cistus ladanifer to widely varying environmental conditions. Functional Ecology 10(5): 636-646.
-
Wright IJ, Reich PB, Cornelissen JHC, Falster DS, Groom PK, et al. (2005) Modulation of leaf economic traits and trait relationships by climate. Global Ecology and Biogeography 14: 411-421.
-
Gutschick VP (1999) Biotic and abiotic consequences of differences in leaf structure. New Phytol 143: 3-18.
-
Poorter H, Niinemets U, Poorter L, Wright IJ, Villar R (2009) Causes and consequences of variation in leaf mass per area (LMA): a meta-analysis. New Phytologist 182(3): 565-588.
-
Wright I, Reich P, Westoby M (2004) The worldwide leaf economics spectrum. Nature 428: 821-827.
-
Westoby M (1998) A leaf–height–seed (LHS) plant ecology strategy scheme. Plant and Soil 199: 213-227.
-
Reich PB, Walters MB, Ellsworth DS (1997) From tropics to tundra: a global convergence in plant functioning. Proceedings of the National Academy of Sciences USA 94(25): 13730-13734.
-
Garnier E, Salager JL, Laurent G, Sonie L (1999) Relationships between photosynthesis, nitrogen and leaf structure in 14 grass species and their dependence on the basis of expression. New Phytologist 143: 119-129.
-
Reich PB, Ellsworth DS, Walters MB, Vose JM, Gresham C, et al. (1999) Generality of leaf trait relationships: a test across six biomes. Ecology 80(6): 1955-1969.
-
Garnier E, Cortez J, Billès G, Navas ML, Roumet C, et al. (2004) Plant functional markers capture ecosystem properties during secondary succession. Ecology 85(9): 2630-2637.
-
Souto CP, Premoli AC, Reich PB (2009) Complex bioclimatic and soil gradients shape leaf trait variation in Embothrium coccineum (Proteaceae) among austral forests in Patagonia. Revista Chilena de Historia Natural 82: 209-222.
-
Niinemets Ü, Kull O (1998) Stoichiometry of foliar carbon constituents varies along light gradients in temperate woody canopies: implications for foliage morphological plasticity. Tree Physiol 18(7): 467-479.
-
Niinemets Ü (1999) Energy requirement for foliage formation is not constant along canopy light gradients in temperate deciduous trees. New Phytol 141(3): 459- 470.
-
Niinemets Ü, Kull O, Tenhunen JD (1998) An analysis of light effects on foliar morphology, physiology and interception in temperate deciduous woody species shade tolerance. Tree Physiol 18(10): 681-696.
-
Chazdon RL, Kaufmann S (1993) Plasticity of leaf anatomy of two rain forest shrubs in relation to photosynthetic light acclimation. Functional Ecology 7(4): 385-394.
-
King DA (1994) Influence of light level on the growth and morphology of saplings in a Panamanian forest. American Journal of Botany 81(8): 948-957.
-
Wilson KB, Baldocchi D, Hanson PJ (2000) Spatial and seasonal variability of photosynthetic parameters and their relationship to leaf nitrogen in a deciduous forest. Tree Physiol 20(9): 565-578.
-
Waldhoff D, Furch B (2002) Leaf morphology and anatomy in eleven tree species from Central Amazonian floodplains (Brazil). Amazoniana-Limnologia Et Oecologia Regionalis Systemae Fluminis Amazonas 17: 79-94.
-
Laisk A, Eichelmann H, Oja V, Rasulov B, Padu E, et al. (2005) Adjustment of leaf photosynthesis to shade in a natural canopy: rate parameters. Plant, Cell and Environment 28(3): 375-388.
- Lessons to Learn: Trees are More than the Lungs of the World
- Community Forestry Enterprises as a Model for Sustainable Forest Development: The Case Of The "Baja Tarahumara" in Chihuahua, Mexico
- Ecological and Socio-Economic Impacts of Chromolaena odorata and Mesosphaerum suaveolens, Two Invasive Alien Species in Central and Southern Benin, West Africa
- Epigenetic Sustainability: Modeling the Human Factor as a Natural Resource through Science 4.0 and the NR3C1 Biological Pilot
- Growth-at-Risk: A Framework for Assessing Economic Vulnerability
- The Rural Territory as a Socioecological System for the Management of Public Policy for Sustainable Rural Development