Assessment of Several Generation Wheat Populations for Yield and Desirable Traits under Organic Agriculture
Composite crossed population is one of the strategies that can suitable under organic agriculture condition to buffer against fluctuation environments hence these Composite have inherent genetic variability. The objective of the stduy was to asses several generations of composite crossed populations of wheat for grain yield, yellow rust and important traits under organic farming. The ANOVA revealed that no significant difference observed among several generations of composite wheat population for yield whereas significant (p=0.002) difference for thousand kernel weight. Composite population of I had high thousand kernel weight (43.22 g) and the lowest recorded for pure line (37.42 g). A highly significant difference (P<0.05) observed among composite crossed population for strip rust incidence and severity across phenological growths. The highest yellow rust incidence (92.00 %) was recorded for pure line and followed by two old population at milk stage. Even though diversity within composite crossed limit the spread of disease expansion, several generations of composite populations exhibited similar grain yield as pure line. Threfore, further study is required using diversity of wheat and vareint alleles to combine and develop resilience cultivar to optimaize yield, resitance to disease and nutrient use efficiency under organic conditions in their ecological farming system.
Belay Fufa1* and Edith V Lammerts2
ecological farming system.
Keywords: Composite Crossed Populations; Resilance; Yield; Organic Farming; Wheat
Introduction
Organic farming is an integration of crop and livestock production system that strive for sustainability. It became emerging and growing in worldwide since the 1990s. Organic agricultural land is slowly increased in Europe as well the highest per capital consummation located in this continent while stable in Africa [1]. Africa also producing agricultural product but destine for export. For example, Ethiopia is producing organic coffee, sesame and other products.
Organic farming is re-evaluting natural agricaulture with ststematic manner that relied on biological fertilazer input. The aim of organic agriculture is to produces healthy food and environmentally friendly by closing the nutrient cycle in ecosystem and low inputs of synthetic fertilizers, avoiding the use of chemicals and Genetic modified organism [2]. Otherwise, organic agriculture is advantage in terms of increasing diverse (at farm level, crop type, improved variety, soil biota) [3]. Organic farmers require a variety that suitable to organic condition and with low input system. Since this enable to provide them assurance with resilience to stresses rather than application of chemicals [4]. Breeding for organic agriculture looking-for stable yield, good quality, seed health, better root system as well ability to interact with beneficial soil micro-organisms and suppress weeds [5, 6, 7].
Pure line wheat is genetically uniform variety that improved through pedigree approach and it’s a dominant improved seed when using high inputs application and provide potential yield at right environment condition [8]. Though, these improved varieties cannot often adapt well at marginal agricultural environments for low inputs system and under organic condition. Besides, due to inhabited application of synthetic chemicals under organic condition, diseases are more affect yield crops [9]. For instance, the wheat yield loss due to yellow rust disease was 40-80% [10]. Therefore, development of vigorous and or resilience variety from diverse population and evaluation their generation can be a strategy for plant breeding under organic and followed, selection for resistance to disease, optimize yield, resilience to fluctuation of environment in their ecology under organic farming system.
Furthermore, exploration and broadening the genetic germplasm pool is also an approach breeding for crop breeding under organic condition. This help to select desired traits and population variety development that is suitable to their ecological farming [11]. For instance; composite crossed population of wheat developed through possible varietal crosses and selection at each generation cycle that can enhance genetic diversity within composite population that enable to resilience to unpredicted biotic and abiotic stresses. In this study, we setup to test several generations of varietal composite crossed populations of winter wheat for grain yield, yellow rust and important traits under organic farming. In addition, we hypothesized that varietal composite crossed population would be expected perform better than yield and buffering against fluctuation of environment than pure line of commercial check.
Materials and Methods
Composite varietal crossed populations made from all possible cross combinations developed at Elm Farm in the UK. Several generations’ cycles were further evaluated for yield, quality and other agronomic trait with university partnership in some Northen west Europe. Sven generation composite crops population and pure line as check was carried out at the organic farm of Wageningen University and Research Center, the Netherlands during 2013/2014. The genotypes were randomized complete block design and replicated triple in the plot size 6 m x 7.5 m = 45 m2. All wheat genotypes seed was treated with organic mustard powder whereas synthetic chemicals were not applied during trial tested.
Collected data
Forty plants were tagged from each plot randomly and yellow rust disease incidence and severity for each plot was assessed at flag leaf sheath p (39), flowering (61) and milk growth stage (83).
Disease incidence (%) = ( ) % incidence = () = average infected leaves * 100 For yellow rust disease severity: Visual scales ranged from 1; few isolated lesion, 9 = very severe symptoms score. In addition, disease severity in percentage evaluated at these growth stages based on BBCH; Base, Bayer, Ciba-Geigy and Hoechst [12].
Yield and agronomic traits data
The distance between spikelet’s 40 plants per plot were tagged and measured or scored for spike length, plant height and the distance from flag leaf to spike was measured from these sampled plants. The number of spikelets per spike calculated based as follows formula.
- Distance between spikelets (cm) =
- Plant height: Plant height was measured in cm from these sampled plants and their average was taken
- The distance from flag leaf to spike: The distance from flag leaf to spike was measured in cm from these sampled plants and their average taken.
- Grain yield and thousand kernel weight: genotype was harvested and grain yield per plot as well as thousand kernel weight weighted and recorded for each plot.
Statistical analysis
Statistical analysis was carried out using GenStat 16th edition software. Genotype was considered as fixed effect whereas replication was considered as random effects. Significances of genotypes tested and mean separation was done using least significant difference (LSD) at 0.05. The correlation within agronomic traits and disease was analyzed by using SPSS software.
Results
Significant differences (P <0.01) observed among composite crossed wheat population for yellow rust incidence at different growth stages (Table 1). The yellow rust incidence rapidly increased across the growth stages (Figure 1), for example, the highest yellow rust incidence (92%) was observed on the commercial check (pure line), followed by old generation of composite crossed populations; A (43.56 %) and B 30.17 %) at milk growth stage respectively.
Mean for yellow rust incidence of tagged samples commercial check/pure line) 54.4 81.85 92 B (HU-08-UK composite, OP) 33.7 41.7 43.55 A (OP, HU-08-YQMS) 10.8 27.32 30.1 G (OP, HU-09-YQMS) 11 17.53 18.3 D (MG, HU-10-YQMS) 9.28 17.1 18.01 E (MG, HU-11-YQMS) 7.9 17.13 23.04 H (NG, HU-12-YQMS) 7 17.42 27.5 I (NG, HU-13-YQMS) 9.7 12.42 24.15 Genotype YR_IncFL YR_IncFW YR_Inc MS CV (%) 15 20.7 22.5 LSD at 0.05 4.84 20.21 16.3
- Notice: YR_ IncFL= Yellow Rust Incidence at flag leave, YR_IncFW= Yellow Rust Incidence at flowering, YR_Inc MS= Yellow Rust
- Incidence at milk growth stage., Op= Old population, MG= Middle generation and NG= New generation.
Table 1: Mean for the yellow rust incidence (%) at different growth stages for wheat population trial.
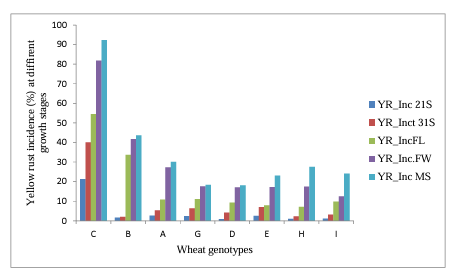
Figure 1: Trend of yellow rust incidence (%) expansion for each genotype across growth stages YRIncS21= yellow rust incidence at 21 growth stage, YRIncS31= yellow rust incidence at 31 growth stage, YRIncFL=yellow rust incidence at flag leaf appeared growth stage, YRIncFW=yellow rust incidence at flowering growth stage, YRIncMS= yellow rust incidence at milk stage.
Significant differences (P <0.001) revealed among wheat population for strip rust severity (0-100% scaling rate) on the first and the penultimate leave at flowering and milk growth stages (Table 2). The highest yellow rust severity Mean for Yellow rust severity based on (0-100 % scale) Genotypes YSV1sfLF YSV2ndfLF YSV1sfLM YSV2nfLM pure line 16.63 30.49 35.76 60.65 OP(B) 11.93 17.91 11.63 15.45 OP (A) 3.59 5.45 10.44 15.5 (60.65%) was observed at the penultimate leaf at milk stage for the pure line), followed by old populations A and B (15.45 and 15.50%), respectively.
| MG (G) | 1.15 | 2.03 | 1.88 | 3.25 |
|---|---|---|---|---|
| MG(D) | 1.7 | 3.37 | 3.12 | 3.5 |
| NG (E) | 2.43 | 3.67 | 3.25 | 4.88 |
| H (NG) | 2.12 | 3.63 | 2.62 | 4.13 |
| NG(I) | 2.36 | 2.42 | 3.75 | 7.13 |
| CV (%) | 24.5 | 19 | 19.8 | 18.4 |
| LSD, 0.05 | 5.27 | 6.21 | 8.52 | 9.62 |
Table 2: Comparison of mean for strip rust severity based on 0-9 scale and 0-100 % scoring rate at varied growth stages. YSV1sfLF
Table 2: Comparison of mean for strip rust severity based on 0-9 scale and 0-100 % scoring rate at varied growth stages. YSV1sfLF (0-100 %) =Yellow Rust severity on the 1st flag leaf at flowering stage, YSV2ndfLF (0-100 % scaling) = Yellow Rust severity on penultimate leaf at flowering stage, YSV1sfLM (0-100 % scaling) = Yellow Rust severity on 1st flag leaf at milk stage, YSV2dfLM (0-100 % scaling rate) = Yellow Rust severity on penultimate leaf at milk growth.
Yield and Thousands Kernal weight
The ANOVA showed no significant difference (p>0.05) among several generations of wheat population for yield performance. Otherwise, significant differences (P=0.002) were found among wheat population for thousand kernel weight. The highest thousand kernel weight was recorded for the new generation of wheat population I (43.23 g) whereas pure line revealed the lowest thousand kernel weight (37.43 Significant differences observed among all wheat population desirable traits; plant height (P<0.03), number of spikelets (P<0.014) and the distance from flag leaf to spike (P<0.007) (Table 3). The longest genotype was the middle generation, E with an average length of 91.22 cm, while, population new population, H had the shortest recorded average length of 76.28 cm indicating decreasing in height.
g) (Table 3).
| Genotype | Grain yield (t/ha) | TKW (g) | FT/ m2 | PT (cm) | SL(cm) | FL(cm) | FS | UFS | TS | DS |
|---|---|---|---|---|---|---|---|---|---|---|
| C | 2.86 | 37.43 | 421.4 | 80.75 | 8.86 | 14.99 | 16.63 | 4.27 | 20.90 | 0.41 |
| B | 2.65 | 41.35 | 326.33 | 83.07 | 7.48 | 15.90 | 13.79 | 3.92 | 17.71 | 0.42 |
| A | 3.18 | 41.43 | 444.33 | 82.89 | 8.16 | 15.53 | 15.70 | 3.56 | 19.27 | 0.43 |
| G | 3.26 | 40.96 | 453.33 | 79.11 | 7.93 | 17.19 | 14.87 | 3.66 | 18.53 | 0.43 |
| D | 3.17 | 42.58 | 500.90 | 82.94 | 7.99 | 16.55 | 14.74 | 3.28 | 18.02 | 0.44 |
| E | 3.39 | 41.88 | 440.40 | 91.42 | 8.65 | 20.47 | 15.94 | 3.83 | 19.32 | 0.45 |
| H | 3.15 | 39.80 | 450.33 | 76.28 | 7.66 | 14.08 | 14.71 | 3.91 | 18.62 | 0.41 |
| I | 3.39 | 43.23 | 465.00 | 82.54 | 8.00 | 17.11 | 14.44 | 3.57 | 18.41 | 0.44 |
| CV (%) | 13.90 | 2.90 | 13.85 | 4.60 | 5.70 | 8.20 | 5.60 | 13.85 | 4.10 | 3.52 |
| LSD, 0.05 | NS | 2.12 | NS | 7.03 | NS | 2.48 | 1.56 | NS | 1.42 | NS |
Table 3: Mean of grain yield (t/ha) and other traits for wheat genotypes. TKW (g) = Thousand kernel weight, FT per m2= number of
Table 3: Mean of grain yield (t/ha) and other traits for wheat genotypes. TKW (g) = Thousand kernel weight, FT per m2= number of fertile tillers m-2, PLHT= plant height (cm), SL= spike length in cm, FL= the distance between Flag leaf and spike in cm, FS= number of fertile spikelets, UFS = number of unfertile spikelets, TS =total number of spikelets / spikes, DS= the distance between spikelets
Correlation among traits
Yield displayed a significant positive association with thousand kernel weight (r= 0.76), plant height (r= 0.64) and non- significant negative association with strip rust incidence and severity. Likewise, plant height showed a significant positive correlation with spike length (r= 0.65), flag leave to spike (r= 0.70), fertile spikelet (r= 0.52), distance between spikelet (r= 0.65) and non-significant with yellow rust. Also, spike length showed significant positive correlation with fertile spikelet’s (r= 0.90) and the distance between spikelet (r= 0.61) (Table 4). However, several of agronomic triats showed non-significant negative assocation with strip rust incideance and seveirty. This might be due to the braodened genetic base of composite population enhance resilance to strip rust disease pressure under organic condition.
| Y | TKW | plht | SL | FL | FS | UnfS | dS | YRIN | YRSV | |
|---|---|---|---|---|---|---|---|---|---|---|
| GY | 1 | |||||||||
| TKW | 0.75** | 1 | ||||||||
| plht | 0.65** | 0.54* | 1 | |||||||
| SL | 0.21ns | 0.02ns | 0.65** | 1 | ||||||
| FL | 0.45ns | 0.42ns | 0.70** | 0.25ns | 1 | |||||
| FS | 0.24ns | -0.09ns | 0.52* | 0.90** | 0.09ns | 1 | ||||
| UnfS | -0.69ns | -0.67ns | -0.54ns | -0.32ns | -0.40ns | -0.25ns | 1 | |||
| dS | 0.44ns | 0.57* | 0.65** | 0.62* | 0.48ns | 0.19ns | -0.78ns | 1 | ||
| INFW | -0.21ns | -0.56ns | -0.01ns | 0.45ns | -0.31ns | 0.51ns | 0.19ns | -0.18ns | 1 | |
| YRSV | -0.26ns | -0.59ns | 0.02ns | 0.47ns | -0.24ns | 0.50ns | 0.32ns | -0.22ns | 0.95** | 1 |
Table 4: ** Assocation among agronomic triats and yellow rust disease in wheat population tested under organic conditions.
Y= Yield, TKW = Thousand kernel weight, Plht= plant height (cm), SL= spike length in cm, FL= the distance between Flag leaf to spike in cm, FS= number of fertile spikelets, Unfs = number of unfertile spikelets, ds= the distance between spikelets, YRIN= yellow rust incidence, YRSV= Yellow rust severity, ns= non-significant Table 4: Assocation among agronomic triats and yellow rust disease in wheat population tested under organic conditions.
Discussion
Composite crossed population for yellow rust disease reaction and yield performance
Due to prohibited application of synthetic chemicals under organic condition, diseases pressure was likely observed on wheat genotypes. In this experiment, yellow rust incidence and severity exhibited on pure line than several generations of crossed population of wheat under organic condition. This might be due to pure line was narrow genetic based combination during derived line development via pedigree selection when compared to varietal composite population. Also, weak resistance of pure lines can explain due to low tillering capacity.
At seedling stage, the yellow rust symptoms and frequency was quite low for composite population. This statement was agreed with Chen [10]. Moreover, severity of strip rust was more observed on the old Composite population of A and B; however, it was not likely economic important due to low severity. This might be the diversity within composite crossed population enhanced the resilience of composite population to limit the spread of disease expansion across growth stages than the pure line under organic farming. This in line with Finckh and Mundt [13]; Zhu [14] and Mundt [15] who reported that varieties and multiline mixtures provide functional diversity of composite population that limits disease expansion. This may be due to the diversity based inter-varietal parents’ combination the resistance genes were integrosed into the composite that build resistant to strip rust and cause different barriers to restrict the spread and expansion of the disease. Furthermore, we only tested the hypothesis of genetically diverse composite population would outperform a resiliance to disease than pure line.
The genetic potential of several generation of wheat composite population did not display yield difference under organic farming, this showed that it did not support our hypothesis. The yield of wheat population was low, this might be due to slow-release nutrients under organic condition. On other hand, the new generation of composite crossed population had the highest thousand kernel weight with a comparable performance in yield, disease resistance and it likely more resilience population under organic condition. Murphy [16] showed that the differences wheat genotypes for yield and genotype × system interaction under different growing conditions, indicating that further study require on diverse wheat genotypes under organic farming system.
Plant height was the longest for the middle population; on E, whereas medium in height recorded for old population A and B. In contrast the shortest observed for the new generation population H. This study in contrary with Hensleigh [17] who reported that the plant height of barley increased over years of generations.
Our study revealed that spike length positively associated with the distance between spikelets and employed positive effect on other traits. Akram [18] stated that spike length had positive association with number of spikelets per spike. Increased in spike length was directly associated with increase in spikelet per spike, grain number per spike and contribute for final yield per plant. Therefore, plant height, spike length, grain per spike and thousand kernel weights can be considered for selection under organic conditions because these traits are directly contributing to final grain yield [19].
Conclusion
Our results highlighted that the diversity within varietal crossed population can improve the resilience of composite population under organic farming and suppress the spread of pathogens compared to the pure line. Several generations of composite populations exhibited similar grain yield potential as pure line. Threfore, further study is required using diversity of wheat and vareint alleles may be combined to develop a resilience cultivar to optimaize yield, resitance to disease and nutrient use efficiency under organic conditions in their ecological farming system.
References
-
FiBL, IFOAM (2017) Global data on organic farming worldwide by Research Institute of Organic Agriculture, FIBL and IFOAM – Organics International at the BIOFACH world organic trade fair: The Statistical yearbook, pp: 1-17.
-
Bulluck LR, Brosius M, Evanylo GK, Ristaino JB (2002) Organic and synthetic fertility amendments influence soil microbial, physical and chemical properties on organic and conventional farms. Appl SoilEcol 19(2): 147-160.
-
Mader P, Fliessbach D, Dubois D, Gunst L, Fried P, et al. (2002) Soil fertility and biodiversity in organic farming. Science 296: 1694-1697.
-
Finckh MR (2008) Integration of breeding and technology into diversification strategy for disease control in modern agriculture. European J plant pathology 121: 399-409.
-
Lammerts van Bueren ET, Jones SS, Tamm L, Murphy KM, Myers JR, et al. (2001) The need to breed crop varieties suitable for organic farming, using wheat, tomato, and broccli as example: a review. NJAS-Wageningen journal of life science 58(3): 193-205.
-
Löschenberger F, Fleck A, Grausgruber H, Hetendorfer H, Hof G, et al. (2008) Breeding for organic agriculture: The example of winter wheat in Austria. Euphytica 163(3): 469-480.
-
Belay Garoma (2024) Importance of Organic Farming and Status of Crop Research: Review. J Plant Biol Agron 3: 1-7.
-
Phillips SL, Wolfe MS (2005) Evolutionary plant breeding for low input system. The journal of Agricultural Scienc 143: 245-254.
-
Huber K, Buerstmaye H (2006) Development of methods for bunt resistance breeding for organic farming. Czech J Genetic plants breed 42: 66-71.
-
Chen XM (2005) Epidemiology and control of stripe rust [Puccinia striiformis f. sp. tritici] on wheat. Canadian Journal of Plant Pathology 27(3): 314-337.
-
Lammerts van Bueren ET, Van Soest LJM, De Groot EC, Boukema W, Osman AM (2005) Broadening the genetic base of onion to develop better adapted variety for organic farming system. Euphytica 146(1-2): 125-132.
-
Cooke BM (2006) Disease assessment and yield loss. In: The epidemiology of plant diseases, pp: 43-80.
-
Finckh MR, Mundt CC (1992) Strip rut, yield and plant competition in wheat cultivar mixture. Phytopathology 82(9): 905-913.
-
Zhu Y, Chen H, Fan J, Wang Y, Li Y, et al. (2000) Genetic diversity and disease control in rice. Nature 406(6797): 718-722.
-
Mundt CC (2002) Use of multiline cultivars and cultivar mixtures for disease management. Annual Review of Phytopathology 40(1): 381-410.
-
Murphy K, Campbell KG, Lyon SR, Jones SS (2007) Evidence of varietal adaptation to organic farming system. Field crop research 102: 172-177.
-
Hensleigh PF, Blake TK, Welty LE (1992) Natural selection on winter barley composite cross XXVI affects winter survival and association traits. Crop science 32(1): 57-62.
-
Akram Z, Ajmal SU, Munir M (2008) Estimation of correlation coefficient among some yield parameters of wheat under rainfed condition. Pak J Bot 40(4): 1777- 1781.
-
Mohammadi M, Sharif P, Karimizadeh R, Shefazadeh MK (2012) Relationships between grain yield and yield components in bread wheat under different water availability (dry land and supplements irrigation condition). Notulae Botanicae Horti Agro-botanical Cluj- Napoca 40(1): 195-200.
- Lessons to Learn: Trees are More than the Lungs of the World
- Community Forestry Enterprises as a Model for Sustainable Forest Development: The Case Of The "Baja Tarahumara" in Chihuahua, Mexico
- Ecological and Socio-Economic Impacts of Chromolaena odorata and Mesosphaerum suaveolens, Two Invasive Alien Species in Central and Southern Benin, West Africa
- Epigenetic Sustainability: Modeling the Human Factor as a Natural Resource through Science 4.0 and the NR3C1 Biological Pilot
- Growth-at-Risk: A Framework for Assessing Economic Vulnerability
- The Rural Territory as a Socioecological System for the Management of Public Policy for Sustainable Rural Development