Assessment of the Socio-Demographic Drivers of Land Use and Land Cover Transformation in Central Taraba State, Nigeria
The study investigates the socio-demographic factors driving land use and land cover (LULC) changes in Central Taraba State.The region is characterized by rapid population growth, urbanization, and shifting livelihood practices, which have significant implications for LULC transformation. The research adopts a survey design, utilizing interviews, focus group discussions, and questionnaires to collect data from selected wards in four Local Government Areas. The study is grounded in the "tragedy of the commons" theory, highlighting how shared resources, such as land, are often overexploited when individuals act int heir self-interest. The findings indicate that population growth, agricultural expansion, and high demand for timber are the primary drivers of LULC changes in the region. Additionally, ineffective laws governing natural resources contribute to these transformations. Analysis of Variance (ANOVA) and Principal Component Analysis (PCA) revealed significant variation in perceptions among respondents regarding these drivers, underscoring the complex interplay of factors influencing LULC changes. The study concludes by recommending strengthening governance and enforcement of natural resource laws, promoting sustainable agricultural practices, incentivizing reforestation, and fostering multi-stakeholder collaboration to ensure sustainable land management and conservation efforts.
Abbreviations
PCA: Principal Component Analysis; LULC: Land Use and Land Cover (LULC); Socio-Demographic Drivers & Sustainable Land Management; LULC: Land use and land cover; ANOVA: Analysis of Variance; FGD: Focus Group Discussions; KMO: Kaiser-Meyer-Olkin Measure of Sampling Adequacy; LSD: The Least Significant Difference.
Introduction
Land use and land cover (LULC) changes have become a critical issue globally, driven by a complex interplay of socio-demographic, economic, and environmental factors. In many regions, especially in developing countries, these changes often result in deforestation, loss of biodiversity, soil degradation, and alterations in ecosystem services, all of which pose significant challenges to sustainable development [1, 2]. Understanding the socio-demographic drivers behind these transformations is essential for developing targeted policies and interventions aimed at sustainable land management.
Nigeria, like many other sub-Saharan African nations, is undergoing rapid demographic transitions, characterized by population growth, urbanization, and shifts in livelihood patterns [3]. These dynamics have had profound effects on land use and land cover, particularly in rural areas where agriculture, pastoralism, and resource extraction remain primary sources of livelihood [4]. Central Taraba State, located in northeastern Nigeria, presents a unique case where a diverse socio-demographic landscape interacts with the region’s natural environment, leading to significant LULC transformations.
Previous studies on LUCC in Nigeria have identified a variety of factors influencing land use change, including population growth, agricultural expansion, deforestation, and urbanization [5]. However, the specific role of socio- demographic factors in driving LUCC in Central Taraba State remains relatively unexplored.
In Central Taraba, the ongoing population expansion, migration, and changes in traditional land-use practices have intensified pressure on the environment. While agriculture remains dominant, the encroachment of settlements, expansion of grazing lands, and infrastructural developments have contributed to significant shifts in land cover Olagunju et al. [6]. Yet, despite these apparent changes, there is a lack of comprehensive studies that analyze the specific socio-demographic drivers behind these transformations. Investigating these factors will not only enhance our understanding of the region’s land-use dynamics but also inform more effective land management and policy strategies.
Statement of the Research Problem
Land use and land cover (LULC) changes pose significant threats to ecosystems and human livelihoods, particularly in regions experiencing rapid socio-demographic shifts. In Central Taraba State, Nigeria, these changes have been increasingly evident, with observable transformations in land use driven by a complex interplay of population dynamics, economic activities, and cultural practices. However, despite the critical implications of these transformations for environmental sustainability and community resilience, there is a limited understanding of the specific socio- demographic drivers that influence LULC patterns in this region.
Recent studies have indicated that population growth and migration significantly impact land use decisions, often leading to increased agricultural expansion, deforestation, and urban encroachment [3]. Yet, the nuances of how different socio-demographic factors—such as age distribution, education levels, and economic status—interact to shape these land cover changes remain under explored. This gap in knowledge hinders the development of effective land management strategies and policies tailored to the unique socio-economic context of Central Taraba State.
Furthermore, the region is characterized by diverse livelihood strategies, including agriculture, pastoralism, and trading, which complicate the relationship between socio- demographic factors and land use changes. The interplay of these factors can lead to conflicting land use practices, ultimately exacerbating environmental degradation and diminishing ecosystem services [6]. Thus, without a comprehensive assessment of the socio-demographic drivers of LULC transformation, policymakers and stakeholders may struggle to implement sustainable land use practices that align with the needs and dynamics of local communities.
Therefore, this study seeks to address the critical knowledge gap regarding the socio-demographic drivers of land use and land cover transformation in Central Taraba State, Nigeria. By identifying and analyzing these drivers, this research aims to provide actionable insights that can inform sustainable land management practices and enhance community resilience in the face of ongoing environmental changes.
Theoretical Framework
The study is grounded in the theory of the tragedy of the commons, as articulated by Hardin G [7]. This theory states that shared resources - such as land, water, and forests - are prone to overexploitation when individuals interact in their self-interest, leading to deterioration and depletion of these communal resources. The tragedy of the commons highlights the tension between individual needs and collective sustainability, making it a relevant framework for understanding LULC changes in a region characterized by diverse socio-demographic dynamics.
In Central Taraba State, rapid population growth, urbanization, and changing livelihoods have intensified pressure on shared land resources. As more individuals compete for limited land for agriculture, grazing, and settlement, the resulting overuse often leads to land degradation, deforestation, and loss of biodiversity [6]. This situation exemplifies Hardin’s argument that without effective management and regulation, communal resources are at risk of collapse, thus necessitating an investigation into the socio-demographic factors that contribute to these dynamics.
Furthermore, the socio-demographic characteristics of communities—such as population density, age structure, education levels, and economic status—play critical roles in shaping land use practices. For instance, younger populations may prioritize agricultural expansion for subsistence, while more educated individuals might advocate for sustainable land management practices [3]. Understanding these socio- demographic factors through the lens of the tragedy of the commons can provide insights into how individual and collective behaviors influence LULC outcomes.
The framework also emphasizes the importance of collective action and governance in mitigating the effects of the tragedy of the commons. As communities in Central Taraba face escalating LULC changes, establishing effective local governance structures and participatory management practices becomes crucial. These strategies can facilitate cooperation among stakeholders, promote sustainable land use, and ensure that communal resources are preserved for future generations [8].
The tragedy of the commons highlights the importance of collective action and institutional governance to manage shared resources sustainably. By analyzing the socio- demographic factors that influence land use decisions in Central Taraba State, this study seeks to identify opportunities for collaborative governance and community- based approaches to address the challenges of LUCC in the region.
In summary, the theory of the tragedy of the commons serves as a foundational lens for examining the socio- demographic drivers of LULC transformation in Central Taraba State. By exploring how individual behaviors and community dynamics intersect with resource management, this research aims to identify strategies that promote sustainable land use and enhance community resilience in the face of ongoing environmental pressures.
Description of the Study Area
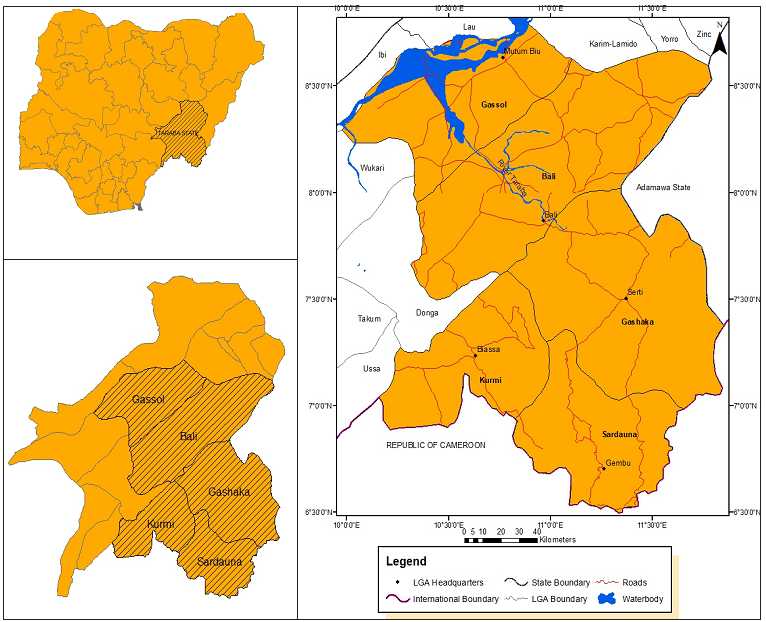
Taraba State Central senatorial zone/district comprises of the entire geographical areas of five LGAs which include: Bali, Gashaka, Gassol, Kurmi and Sardauna Local Government Areas. Latitude 6° 30’N to 8° 48’N of the Equator and longitude 10° 01’E to 11° 50’E of the Meridian are the boundaries of the zone. The area is bordered to the south by the Republic of Cameroon, to the northeast by Adamawa State, to the north by the LGAs of Karim-Lamido, Ardo-Kola, and Yorro, to the west by Wukari and Donga, and to the northwest by Ibi LGA (Figure 1). The district covers a total land area of 32,110.82 km². The region encompasses a diverse landscape characterized by mountainous terrain, fertile valleys, and a variety of ecosystems, including savanna and forested areas. Covering an area of approximately 32,110 square kilometers, Central Taraba is bounded by the Mambilla Plateau to the southeast and the River Benue to the west, creating a unique interplay of climatic and ecological factors [9].
The climate of Central Taraba is predominantly tropical, with distinct wet and dry seasons. The wet season typically spans from May to October, receiving an average annual rainfall of about 1,500 mm, which supports extensive agricultural activities. Lower rainfall and warmer temperatures characterize the dry season, which runs from November to April. It frequently affects agricultural operations and land use decisions NIMET [10].
Demographically, Central Taraba is home to a diverse population, consisting of various ethnic groups, including the Jukun, Mambilla, and Tiv communities. As at 2021, the population of the area was estimated at over 1.5 million, with a youthful demographic profile—approximately 45% of the population is under the age of 15 [11]. This youthful population, combined with ongoing migration from surrounding regions, contributes to increased pressure on land resources as individuals seek opportunities for agricultural production and settlement.
The primary economic activities in Central Taraba include agriculture, livestock rearing, and small-scale trading. The region’s agricultural landscape is dominated by subsistence farming, with major crops such as maize, yams, rice, and cassava being cultivated. However, the growing population and demand for land have resulted in significant land use changes, including deforestation, encroachment on protected areas, and conversion of arable land to other uses [6].
Despite its rich natural resources, Central Taraba faces considerable challenges, including land degradation, soil erosion, and conflicts over land use among different community groups. These challenges underscore the need for a comprehensive understanding of the socio-demographic factors that drive LULC transformations in the region. By
examining these dynamics, this study aims to provide insights that can inform sustainable land management practices and policy interventions tailored to the unique socio-economic context of Central Taraba State.
Methodology
Material and Methods
The survey design method was adopted in this study. This involved the use of interviews/focus group discussion, participant observation and questionnaires were used to collect data for the study. The research questionnaire was structured to obtain information on socio-demographic drivers of LULC transformation in the study area. A multistage sampling technique was used in the selection of respondent. The first stage involved selection of four LGA out of the five LGA in Taraba central senatorial district. The second stage involved the selection of five wards in each of the LGA selected making a total of 20 wards in the four selected LGA where questionnaire was administered. Gassol has twelve (12) ward, Bali and Sardauna LGA has eleven (11) wards, while Kurmi has ten (10) ward and five were selected from each LGA. The wards were randomly selected which are; Maihula, Kusuma, Kaigama, Suntai, Gangmata in Bali LGA, Tutare, Gassol, Wuryo, Gunduma in Gassol LGA, Gembu B, Mbamnga, Nguroje, Kakara, Mayo-Ndaga in Sardauna LGA and Bissaula, Akwento Boko, Bente Galea, Baissa, Didan in Kurmi LGA. The wards had higher chances of being selected among others because they are the areas greatly affected by exploitation. A total of 1200 structured questionnaires were administered in the four selected LGA in the central senatorial district. The household heads from each chosen ward were chosen using a random sampling approach in order to administer the questionnaire. The purpose of the research questionnaire was to gather data on the respondents’ demographics and the drivers influencing changes in land use and cover in the study area.
Focus Group Discussions (FGD): Focus group discussion was conducted in Namnai ward in Gassol LGA. The focus group discussion was made up of 10 persons comprising of the village head, Mai Anguwa and household heads who are residents in the communities for not less than 30 years. Focused group discussion was conducted to collect data on the observed and perceived causes and drivers of landuse land cover change. Descriptive statistics were used to analyze the data to generate results. Secondary materials were also used in this study. The Population data of 2006 for the selected four LGAs (Bali, Kurmi, Sardauna and Gassol) were projected to the year 2020 estimated total population. Proportional allocation was used to select 1200 respondents from Bali, Kurmi, Sardauna and Gassol based on their population size. Table 1 Shows the sample size by proportional allocation (Table 1).
| LGA | WARDS | POPULATION (N= 560605 ) | PERCENTAGE 100% | SAMPLE(N= 1200) |
|---|---|---|---|---|
| Bali | Maihula | 49193 | 9 | 105 |
| Kusuma Badakoshi | 32930 | 6 | 70 | |
| Kaigama | 41039 | 7 | 88 | |
| Suntai | 42080 | 7 | 90 | |
| Gangmata | 41039 | 7 | 88 | |
| Gassol | Tutare | 16629 | 3 | 36 |
| Gassol | 25353 | 4 | 54 | |
| Wuryo | 20019 | 4 | 43 | |
| Gunduma | 17184 | 3 | 37 | |
| Namnai | 29709 | 5 | 64 | |
| Sardauna | Gembu B | 19806 | 4 | 42 |
| Mbamnga | 27775 | 5 | 60 | |
| Nguroje | 29463 | 5 | 63 | |
| Kakara | 44569 | 8 | 95 | |
| Mayo-Ndaga | 43621 | 8 | 93 | |
| Kurmi | Bissaula | 5097 | 1 | 11 |
| Akwento Boko | 21430 | 4 | 46 | |
| Bente Galea | 16127 | 3 | 35 | |
| Baissa | 27281 | 5 | 58 | |
| Didan | 10261 | 2 | 22 | |
| Population of ward/Total population * Total number of samples to be used. |
Table 1: Sample Size by Proportional Allocation.
Result of the Findings
Demographic and Socioeconomic Characteristics of Respondents
Accounting for the trends and patterns in land use land cover changes requires an appreciation of the demographic and socioeconomic underpinnings of the study population. The demographic and socioeconomic characteristics considered include sex, age, marital status, educational level, religion, occupation, village, Local government, and period of stay of the respondents in the area.
Table 2 presents the demographic characteristics of respondents. The result reveals that 10% of the respondents are female as against 90% who are male. This selection is consistent with the fact that previous studies have shown that most of the occupation and activities such as farming, logging and its trade, as well as other deforestation activities, which drive land use and land cover are propagated by men Bakoji, et al. [12, 13, 14] has noted that the major activities that can be attributed to women that drive a change in land cover include fuel wood, and charcoal making, however this also has a huge male support.
It was found that over 85% of respondents are within the age bracket of 18-50years. This implies that majority of the respondents are within productive and economically active age, similar to reports by Bakoji, et al. [12] and Abba, et al. [13] where age of the respondents ranged from 20 to 50 years and above. Consequently, 41% were within 31-40 years accounting for the largest number followed by those within 41-50 years (34.5%), and thus implies that most of the respondents had sufficient experience in their business and had good knowledge of the subject and their environment [12]. However recorded that majority of their respondents were within the age range of 40-49 years.
| Category | Sub-Category | Frequency (N) | Percentage (%) |
|---|---|---|---|
| Sex | Male | 756 | 90 |
| Female | 84 | 10 | |
| Age | 18-30 | 104 | 12.4 |
| 31-40 | 345 | 41.1 | |
| 41-50 | 290 | 34.5 | |
| 51-60 | 98 | 11.7 | |
| Unresponded | 3 | 0.4 | |
| Marital Status | Married | 650 | 77.4 |
| Single | 125 | 14.9 | |
| Separated | 20 | 2.4 | |
| Widow | 25 | 3 | |
| Widower | 5 | 0.6 | |
| Unresponded | 15 | 1.7 | |
| Educational level | Primary | 27 | 3.2 |
| Secondary | 353 | 42 | |
| Tertiary | 303 | 36.1 | |
| Informal | 92 | 11 | |
| Non formal | 62 | 7.4 | |
| Unresponded | 3 | 0.4 | |
| Place of birth | Born in the village | 592 | 70.5 |
| Born outside village but within district | 168 | 20 | |
| Born outside the district | 55 | 6.5 | |
| Unresponded | 25 | 3 | |
| Period of stay | Place of birth | 134 | 16 |
| 1-10 years | 547 | 65.1 | |
| 11-20 years | 82 | 9.8 | |
| >20 years | 71 | 8.5 | |
| Unresponded | 6 | 0.7 |
Table 2: Demographic Characteristics.
The distribution of respondents according to their marital status reveals that most of the respondents 77.4 % are married. This number shows that most of the respondents are residents of the area and would have sufficient knowledge of the happenings in the region. This is the same for other respondents who are separated (2.4%), widow (3%) and widower (0.6%). Only about 15% were single, and would most likely be the youths in the area sampled.
The distribution of respondents according to their occupation shows that majority of respondents were civil servants (24.5%) and farmers (20.2 %), while retirees (7.4%) and the unemployed (2.7%) were the least sampled. A significant number of respondents were also students (15%) and self-employed (13.7%). Many of the students engage in various economic activities after school hours and partly account for the self-employed. Many of the self- employed respondents accounted for the traders of fuel- wood, charcoal, logging and other activities that are both drivers and non-drivers of land cover loss [15]. Dib, et al. [15] noted that employment in the agricultural sector is an important source of income for rural households, especially for those working in non-government agencies as evident in the present study. Also from a larger economic perspective, agriculture remains an important source of employment. From discussions with community leaders and individual respondents, non-agricultural employment that were engaged in includes construction, manufacturing, and basic education, while self-employed activities include trading of agricultural commodities, shop-keeping, and handicrafts. The village head of Namnai in Gassol LGA Mr Umaru Kachalla Gidado noted that he believes farmers are the drivers of land cover change in the area. He observed that in a bid to reduce the far distances they have to cover to get to the farm, they have created paths by deforestation and changing crop practices (Personal Interview).
Education affords people the necessary knowledge on human survival and means of managing human life in varying capacity and dimension. The result for educational level shows that 42% had secondary education, and 36.1% had tertiary education, accounting for the highest educational levels. Also, 11% had informal education, 3.2% had only primary education, while only 7.4% had no any form of education. This indicates that most of the respondents had one form of education or the other and are able to understand the subject. Bakoji, et al. [12] emphasized the importance of this when they utilized a respondent literacy level of 97% for a similar study of Jalingo.
Majority of the respondents accounting for over 70% were born in the village and local areas while 20% were born within the district but outside the village. Only about 6% were born outside the district. This shows that most respondents would have a good knowledge of the changes that have occurred in the areas over time, having lived there for a reasonably long time. Also, this proximity and familiarity with the area can lead to an increase in the use of forests and forest products as well as the destruction of forest habit and loss of biological diversity of both plants and animals [13].
The length of stay of respondents in the study locations shows about 16% of the total respondents were born in the area of study while 8.5% and 9.8% have lived in the areas for over 20 years and between 11 years respectively. The larger number of respondents (65.1%) however, has only lived in the locations between 1-10 years.
Drivers of Land Use and Land Cover Change
Major Sources of livelihood
Table 3 summarizes the major sources of livelihood of respondents in the study area. Crop farming was the major source of livelihood accounting for over 55% of responses followed by trading which was about 20%. This result is similar to reports by Munthali, et al. [16] which showed that for dwellers of areas susceptible to land cover loss, farming was ranked as the most important source of income, while Income from self-employment opportunities, such as businesses, handcraft, and trade, were ranked second. Fishing and wood logging trade were the least sources of livelihood. This was so because of the expertise and equipment needed for logging activities and the lack of adequate water bodies for fishing activities. Other sources of livelihood including welding, tailoring, catering, restaurant, artist and food and charcoal sales accounted for 4.3 % [17]. In a similar study of Taraba state capital, Jalingo, noted that over 80% of the inhabitants of the area are made up of farmers and fuel wood vendors, whose livelihoods are directly dependent on agricultural activities and vegetation resources. This means the sources of livelihoods of these people will be at risk if there is a sharp change in land cover (Table 3).
| Livelihoods | Frequency | Percent |
|---|---|---|
| Crop farming | 462 | 55.3 |
| Trading | 166 | 19.9 |
| Animal rearing | 82 | 9.8 |
| Fishing | 39 | 4.7 |
| Wood vendor | 51 | 6.1 |
| Others | 36 | 4.3 |
| Total | 836 | 100 |
Table 3: Major sources of income of respondents.
Source: Field survey 2023 Table 3: Major sources of income of respondents.
Vegetation Structure Over the Last 35 Years
Table 4 gives respondent’s opinion of the vegetation structure over the last thirty five years. Majority of the respondents (55.7%) recognize that the vegetation structure to be forest while over 32% recognize the vegetation to be grassland. The least number of respondents of 1% remember the vegetation to be woodland while about 11% think the vegetation has not changed but is similar to what is obtainable at the time of this survey. Forests still accounted for the largest land-use land cover area at 40.7%. However, cultivated land (37.9%) and fallow land (21.3%) combined shows that a great expanse of land has been used for farming purposes over the span of 35 years. This indicates a great change in land cover driven by human activity.
The FGDs as conducted generally shows that participants in (Bali, Kurmi, Sardauna and Gassol) have a good knowledge of the causes of land use land cover change and drivers. This could be as a result of their understanding of the environment and the changes they have experienced over time. From discussions had with community leaders and individual respondents, non-agricultural employment that they were engaged in includes construction, manufacturing, and basic education, while self-employed activities include trading of agricultural commodities, shop-keeping, and handicrafts. The village head of Nam Nai in Gassol LGA Mr Umaru Kachalla Gidado noted that he believes farmers are the drivers of land cover change in the area. He stressed that the rate of bush burning and demand for arable land due to increase in population also play a role. The village head Umaru Kachalla Gidado said the far distances they have to covered to get to the farm is no longer far and he attributed that to land cover change, the participant said human activities are the cause of land cover change and the farmers are responsible, and that every year they experience changes in temperature as well. The Mai Anguwa, Manu Gidado said “the land in the last 50 years was a thick forest in it’s natural form where we even see animals moving within the forest”. Respondent long years of stay in the community has given them a better experience and understanding of the changes and the causes of the change, as well as the negative impact of such activities. In general, the participants of a focused group discussion agreed that the land in the last 50 years was a thick forest in its natural form where living and non-living things interact freely. A survey of Taraba State by Geomatics International reveals that In 1976/78, most of the Benue River flood plain that captures Taraba was mapped as shrub/ sedge/graminoid freshwater/marsh/swamp with some areas of riparian forest. However, by 1993/95, the majority of the Taraba rivers floodplains were cultivated although the area west of Mutum Biyu still appeared to have large areas of uncultivated swamp. The study also noted that undisturbed forest occupied 5009 km2 in 1976/78, but decreased to 2681 km² by 1993/95. As the tree cover was thinned or removed, areas of previously undisturbed forest changed to montane forest.
In a similar study of Jalingo in Taraba state by Ambrose, et al., they reported that arable land was drastically reduced by an equivalence of 75% of the total land cover within a 20 year period from 1991 due largely to urban expansion. They further reported a greater change between 1991 and 2009 that left only about 12% of the total land area under cultivation. An expansion of this phenomenon to other areas of the state was anticipated by the study (Table 4).
| Vegetation Structure | Frequency | Percentage |
|---|---|---|
| Grassland | 270 | 32.2 |
| Forest | 467 | 55.7 |
| Woodland | 8 | 1 |
| Same as today | 93 | 11.1 |
| Total | 838 | 100 |
| Land-use land cover | ||
| Forest | 340 | 40.7 |
| Fallow land | 178 | 21.3 |
| Cultivated land | 317 | 37.9 |
| Others | 1 | 0.1 |
| Total | 836 | 100 |
Table 4: Respondents Perception of Vegetation structure and land-use land cover over the last 35 years.
Source: Field survey 2023 Table 4: Respondents Perception of Vegetation structure and land-use land cover over the last 35 years.
Land Ownership in the Study Area
Table 5 shows the land ownership in the study area according to respondent’s opinion. Over 70% of the respondents had land to their names, however, majority of them (68.2%) were between 1-49 acres. 1.4% of the respondents had between 50-99 acres, 0.2% of the respondents has 100-149 acres while 0.7% of the respondents has 150-199 acres of land. respondents and 6 respondents had over 100 acres and 150 acres of land respectively, representing less than 1% (Table 5).
| Frequency | Percentage (%) | |
|---|---|---|
| 0 | 246 | 29.4 |
| Jan-49 | 571 | 68.2 |
| 50-99 | 12 | 1.4 |
| 100-149 | 2 | 0.2 |
| 150-199 | 6 | 0.7 |
| Total | 837 | 100.0 |
Table 6: Land ownership by respondents.
Source: Field survey 2023. Table 5: Land ownership by respondents.
Availability and Use Of Plant Species On The Lands
Table 6 gives the availability and use of plant species on the lands owned by respondents. Over 23% of the respondents asserted to ever having Madrid (Pterocarpus Erinaceous), Marke (Anogeissus leiocarpus) and Kawo (Afzelia africana) plants on their lands. About 52% however, confirmed that these plant species were no longer present on their lands. Unfortunately, about 94% of those who still had these species on their lands expressed their plans to cut them in the future. The most significant purpose of cutting the trees was to sell as noted by 56.8% of respondents. Farming was ranked the second main reason at 27.3%, while urbanization and settlement accounted for about 16%. Contrary to the present opinion, Gideon, et al. [18] in an assessment of agroforestry tree products to rural farmers in Karim –Lamido local government area of Taraba state reported that most farmers try to maintain trees such Balanites aegyptiaca, Borassus aethiopium, Vitex doniana Zizipus, Mauritiana and Ficus capensi as on their farms, and also planted species such as Psidium gujava, Moringa oleifera, Anacardium occidentale and Mangifera indica. They noted that the protected/planted trees contribute several products such as food, fruits, leaves/fodders, medicine, seeds, fibre, oil, and services such as nutrients fixation to the soil. The implication here is that most trees that were left on most farms are those used as food or herbs to replace trees logged for timber purposes [19] have however reported that many farmers and residents in forest areas of Taraba Stats were not participating in conservation of tree species due to poor infrastructural facilities and poverty in the area, even though majority of the people were willing to support trees conservation (Table 6).
| Availability of plant species on Land | Frequency | Percent |
|---|---|---|
| Yes | 189 | 23.4 |
| No | 619 | 76.6 |
| Total | 808 | 100 |
| Current Availability | ||
| Yes | 93 | 47.7 |
| No | 101 | 51.8 |
| Total | 195 | 100 |
| Plans to clear in the future | ||
| Yes | 91 | 93.8 |
| No | 5 | 5.2 |
| Total | 96 | 100 |
| Reason for clearing | ||
| Settlement | 14 | 15.9 |
| Farming | 24 | 27.3 |
| To sell | 50 | 56.8 |
| Total | 88 | 100 |
Table 5: Availability and use of plant species on the lands.
Source: Field survey 2023 Table 6: Availability and use of plant species on the lands.
Ranking of the Most Common Causes for the Clearing of Grasslands/Forest
Table 7 gives the most common causes for the clearing of grassland and forests in the study area. In line with the major source of livelihood of most respondents, 79.4% ranked the need to create more agricultural land as a key driver for clearing of forests and grasslands. Again, as evidenced from the reports of respondents who have Madrid (Rosewood), Marke (Anogeissus leiocarpus) and Kawo (Afzelia africana) plants on their lands, timber extraction ranked second on the reasons for land clearing. Settlements and wood-fuel collection also accounted for over 50% of the common reasons for clearing of forests and grassland which is also observed by John, et al. [20] that households in rural Taraba consume more of woodfuel for cooking and heating needs than other energy substitutes. As mining is not a major activity in the study area, it ranked the least as expected Yusuf, et al. [21]. Noted that anthropogenic activities responsible for deforestation are logging activities and agricultural activities, similar to results obtained by Ajake, et al. [22, 23]. A key study of the outskirts of Taraba state capital by Oruonye [24] notes that factors driving the clearance of urban areas was different from rural areas. For instance, the factors that have influenced the land use changes in the metropolis and its outskirts include accessibility provided by new roads, recent development in the surrounding, topography and economic activities. Other cause included individual preferences and local planning policies. Mba, et al. [25, 26] have reported that Nigeria’s annual deforestation rate is the highest in the world and puts it on the place to lose all its primary forest within few years (Table 7).
| Frequency | Rank | |
|---|---|---|
| To create more agricultural land | 79.40% | 1st |
| Timber extraction | 63.10% | 2nd |
| To create more places for settlement | 59.60% | 3rd |
| Wood-fuel collection | 53% | 4th |
| To gain access road | 26.80% | 5th |
| Expansion and Infrastructure | 25.80% | 6th |
| Cattle breeding | 22.40% | 7th |
| Mining | 5.80% | 8th |
Table 7: Ranking of the most common causes for the clearing of grasslands/forest.
Source: Field survey 2023 Table 7: Ranking of the most common causes for the clearing of grasslands/forest.
Perception About the Major Drivers of Land Use Land Cover
Table 8 presents respondents’ perceptions of the key drivers of land use and land cover (LULC) change across the four surveyed local government areas. The majority of respondents (98.8%) identified the high demand for timber as the primary driver of LULC change. Agricultural expansion was similarly recognized as a major driver by 98% of respondents. These findings align with observations from a study conducted in southern Nigeria by Barinweni et al. [27] where logging was also identified as the leading cause of deforestation and land cover change, followed by farming activities.
In the present study, settlement area expansion (91.1%)
and population growth (84%) were also considered significant drivers of LULC change. On the other hand, ineffective laws governing natural resources were perceived as the least influential factor, with 68% of respondents acknowledging its role. Notably, ineffective laws recorded the highest level of disagreement, with 17% of respondents arguing its influence.
The pattern of responses was the same across all local government for all the major drivers of LULC except for Bali and Gassol, where a larger proportion of respondents disagreed with the opinion that ineffective laws significantly contributed to LULC change, compared to those who were undecided. This suggests some regional variability in the perception of legal enforcement as a driver of land use change (Table 8).
| Population growth | ||||
|---|---|---|---|---|
| Agree | Undecided | Disagree | Total | |
| Bali | 135 | 72 | 8 | 215 |
| Gassol | 180 | 4 | 2 | 186 |
| Sardauna | 291 | 17 | 11 | 319 |
| Kurmi | 100 | 18 | 2 | 120 |
| Total | 706 (84%) | 111 (13.2%) | 23 (2.7%) | 840 |
| High demand for timber | ||||
| Agree | Undecided | Disagree | Total | |
| Bali | 213 | 2 | 0 | 215 |
| Gassol | 183 | 1 | 2 | 186 |
| Sardauna | 316 | 2 | 1 | 319 |
| Kurmi | 118 | 2 | 0 | 120 |
| Total | 830 (98.8%) | 7 (0.8%) | 3 (0.3%) | 840 |
| Agricultural expansion | ||||
| Agree | Undecided | Disagree | Total | |
| Bali | 210 | 4 | 1 | 215 |
| Gassol | 186 | 0 | 0 | 186 |
| Sardauna | 310 | 7 | 2 | 319 |
| Kurmi | 117 | 2 | 1 | 120 |
| Total | 823 (98%) | 13 (1.6%) | 4 (0.6%) | 840 |
| Settlement Area | ||||
| Agree | Undecided | Disagree | Total | |
| Bali | 192 | 14 | 9 | 215 |
| Gassol | 169 | 17 | 0 | 186 |
| Sardauna | 293 | 20 | 6 | 319 |
| Kurmi | 111 | 9 | 0 | 120 |
| Total | 765 (91.1%) | 60 (7.1%) | 15 (1.8%) | 840 |
| Ineffective laws on natural resources | ||||
| Agree | Undecided | Disagree | Total | |
| Bali | 128 | 26 | 61 | 215 |
| Gassol | 160 | 25 | 1 | 186 |
| Sardauna | 189 | 51 | 79 | 319 |
| Kurmi | 96 | 22 | 2 | 120 |
| Total | 573 (68.2%) | 124 (14.8%) | 143 (17%) | 840 |
Table 8: Perception about the major drivers of land use land cover.
Kaiser-Meyer-Olkin Measure of Sampling Adequacy (KMO) measured on the data showed a significant value of 0.508 (p<0.05) as seen in Table 8, implying that the sampled factors or drivers were adequate to determine the effects of the drivers on the land use land cover change in the area (Table 9).
| Kaiser-Meyer-Olkin Measure of Sampling Adequacy. | 0.508 | |
|---|---|---|
| Bartlett’s Test of Sphericity | Approx. Chi-Square | 24.098 |
| Df | 10 | |
| Sig. | .007 |
Table 9: Kaiser-Meyer-Olkin Measure of Sampling Adequacy and Bartlett’s Test.
From the principal component analysis (PCA) that was used to examine the effects of the major drivers to land use land cover change in the area, results showed that the percentage contribution of the drivers on land use land cover change (Communalities) were 74.2% by ineffective laws on natural resources, followed by Settlement area, population growth agricultural expansion and high demand for timber with 67.0%, 65.5%, 62.5% and 50.6% respectively as shown in Table 10.
| Initial | Extraction | |
|---|---|---|
| Population growth | 1 | 0.655 |
| High demand for timber | 1 | 0.506 |
| Agricultural expansion | 1 | 0.625 |
| settlement area | 1 | 0.67 |
| ineffective laws in natural resources | 1 | 0.742 |
Table 10: Communalities.
However, three factors were grouped based on the correlation within the factors. The first group consisted of agricultural expansion and high demand for timber which contributed 22.32% with the highest eigenvalue 1.181 while factor two is made up of settlement area and population growth with eigenvalue of 1.015 as shown in Table 10. The third factor on the other hand is made up of only one driver which is ineffective laws on natural resources with eigenvalue of 1.002. Lambin, et al. [1] extensively explained that nations that are “weak” in Central Africa are heavily dependent on natural resources, as well as timber, for foreign export revenue. Lambin, et al. [1] note that the existing regulations of the industry are weak, owing to inadequate law enforcement and corruption. This has increased the area of forest logged with its attending environmental impacts. The significant values show that there was a generally high level of awareness on the major drivers of land use changes over the last decade (Table 11).
| Component | Initial Eigenvalues | Extraction Sums of Squared Loadings | Rotation Sums of Squared Loadings | ||||||
|---|---|---|---|---|---|---|---|---|---|
| Total | % of Variance | Cumulative % | Total | % of Variance | Cumulative % | Total | % of Variance | Cumulative % | |
| 1 | 1.181 | 23.613 | 23.613 | 1.181 | 23.613 | 23.613 | 1.116 | 22.323 | 22.323 |
| 2 | 1.015 | 20.304 | 43.917 | 1.015 | 20.304 | 43.917 | 1.059 | 21.184 | 43.507 |
| 3 | 1.002 | 20.049 | 63.966 | 1.002 | 20.049 | 63.966 | 1.023 | 20.458 | 63.966 |
| 4 | 0.957 | 19.145 | 83.111 | ||||||
| 5 | 0.844 | 16.889 | 100 |
Table 11: Total Variance Explained.
Extraction Method: Principal Component Analysis. Table 11: Total Variance Explained.
Table 12 shows multiple comparisons of respondents’ perceptions on the impact of population growth on land use and land cover (LULC) change. The Least Significant Difference (LSD) test reveals that there is a statistically significant difference between respondents who “agreed” and those who were “undecided” or “disagreed” on the impact of population growth, as indicated by a p-value less than 0.05. The mean difference between “agreed” and “disagreed” was 170.75, with a confidence interval between 89.03 and 252.47, highlighting a strong divergence in perception. However, there was no significant difference between the “undecided” and “disagreed” groups, suggesting similar views among these respondents.
| LSD | (I) Population_ Growth | (J) Population_ Growth | Mean Difference (I-J) | Std. Error | Sig. | 95% Interval | Confidence |
|---|---|---|---|---|---|---|---|
| Lower Bound | Upper Bound | ||||||
| Agreed | Undecided | 148.75000* | 36.12517 | 0.003 | 67.0292 | 230.4708 | |
| Disagreed | 170.75000* | 36.12517 | 0.001 | 89.0292 | 252.4708 | ||
| Undecided | Agreed | -148.75000* | 36.12517 | 0.003 | -230.4708 | -67.0292 | |
| Disagreed | 22 | 36.12517 | 0.558 | -59.7208 | 103.7208 | ||
| Disagreed | Agreed | -170.75000* | 36.12517 | 0.001 | -252.4708 | -89.0292 | |
| Undecided | -22 | 36.12517 | 0.558 | -103.7208 | 59.7208 |
Table 12: Multiple Comparisons on Perception of the Respondents on Population Growth.
*The mean difference is significant at the 0.05 level. Table 12: Multiple Comparisons on Perception of the Respondents on Population Growth.
Table 13 shows the results of the ANOVA analysis for respondents’ perceptions of the impact of high demand for timber on land use and land cover (LULC) changes. The significant F-value (25.003) and a p-value of less than 0.05 indicate that there is a statistically significant difference among the groups’ perceptions.
| Sum of Squares | df | Mean Square | F | Sig. | |
|---|---|---|---|---|---|
| Between Groups | 113439.5 | 2 | 56719.75 | 25.003 | 0 |
| Within Groups | 20416.5 | 9 | 2268.5 | ||
| Total | 133856 | 11 |
Table 13: ANOVA in Perception of the Respondents on High Demand for Timber.
Table 14 presents multiple comparisons of respondents’ perceptions regarding high demand for timber as a driver of LULC change using the Least Significant Difference (LSD) test. Significant mean differences are observed between those who “agreed” and both the “undecided” and “disagreed” groups, with mean differences of 205.75 and 206.75, respectively (p < 0.05). There is no significant difference between the “undecided” and “disagreed” groups, suggesting similar perceptions between these groups.
| (I) High_Demand | (J) High_ Demand | Mean Difference (I-J) | Std. Error | Sig. | 95% Confidence Interval | ||
|---|---|---|---|---|---|---|---|
| Lower Bound | Upper Bound | ||||||
| LSD | Agreed | Undecided | 205.75000* | 33.67863 | 0 | 129.5636 | 281.9364 |
| Disagreed | 206.75000* | 33.67863 | 0 | 130.5636 | 282.9364 | ||
| Undecided | Agreed | -205.75000* | 33.67863 | 0 | -281.9364 | -129.5636 | |
| Disagreed | 1 | 33.67863 | 0.977 | -75.1864 | 77.1864 | ||
| Disagreed | Agreed | -206.75000* | 33.67863 | 0 | -282.9364 | -130.5636 | |
| Undecided | -1 | 33.67863 | 0.977 | -77.1864 | 75.1864 |
Table 14: Multiple Comparisons on Perception of the Respondents on High Demand for Timber.
*The mean difference is significant at the 0.05 level. Table 14: Multiple Comparisons on Perception of the Respondents on High Demand for Timber.
Table 15 presents multiple comparisons on respondents’ perceptions of agricultural expansion as a driver of land use and land cover (LULC) change using the Least Significant Difference (LSD) test. The analysis shows significant differences between the “agreed” group and both the “undecided” and “disagreed” groups, with mean differences of 202.50 and 204.75, respectively (p < 0.05). However, no significant difference was found between the “undecided” and “disagreed” groups, suggesting similar perceptions among them.
| (I) Agric_ Expandsion | (J) Agric_ Expandsion | Mean Difference (I-J) | Std. Error | Sig. | 95% Confidence Interval | ||
|---|---|---|---|---|---|---|---|
| Lower Bound | Upper Bound | ||||||
| LSD | Agreed | Undecided | 202.50000* | 32.64412 | 0 | 128.6539 | 276.3461 |
| Disagreed | 204.75000* | 32.64412 | 0 | 130.9039 | 278.5961 | ||
| Undecided | Agreed | -202.50000* | 32.64412 | 0 | -276.3461 | -128.6539 | |
| Disagreed | 2.25 | 32.64412 | 0.947 | -71.5961 | 76.0961 | ||
| Disagreed | Agreed | -204.75000* | 32.64412 | 0 | -278.5961 | -130.9039 | |
| Undecided | -2.25 | 32.64412 | 0.947 | -76.0961 | 71.5961 |
Table 15: Multiple Comparisons on Perception of the Respondents on Agricultural Expansion.
*The mean difference is significant at the 0.05 level.
| Sum of Squares | Df | Mean Square | F | Sig. | |
|---|---|---|---|---|---|
| Between Groups | 110578.5 | 2 | 55289.25 | 25.942 | 0 |
| Within Groups | 19181.5 | 9 | 2131.278 | ||
| Total | 129760 | 11 |
Table 16: Multiple Comparisons on Perception of the Respondents on Agricultural Expansion.
The ANOVA results indicate a significant difference between groups (F = 25.942, p < 0.05), which confirms that perceptions about the impact of agricultural expansion on LULC change vary significantly among the different groups of respondents.
Table 16 shows the ANOVA analysis of respondents’ perceptions regarding the impact of settlement area expansion on land use and land cover (LULC) change. The significant F-value (22.858) with a p-value of less than 0.05 indicates that there are statistically significant differences among the groups’ perceptions.
| Sum of Squares | df | Mean Square | F | Sig. | |
|---|---|---|---|---|---|
| Between Groups | 88462.5 | 2 | 44231.25 | 22.858 | 0 |
| Within Groups | 17415.5 | 9 | 1935.056 | ||
| Total | 105878 | 11 |
Table 17: ANOVA in Perception of the Respondents on Settlement Area.
Table 17 presents multiple comparisons using the Least Significant Difference (LSD) test to determine differences in respondents’ perceptions. Significant mean differences were found between those who “agreed” and both the “undecided” and “disagreed” groups, with mean differences of 176.25 and 187.50, respectively (p < 0.05). However, no significant difference was found between the “undecided” and “disagreed” groups, indicating similar views among these respondents regarding settlement area expansion as a driver of LULC change.
| (I) Settlement_ Area | (J) Settlement_ Area | Mean Difference (I-J) | Std. Error | Sig. | 95% Confidence Interval | ||
|---|---|---|---|---|---|---|---|
| Lower Bound | Upper Bound | ||||||
| LSD | Agreed | Undecided | 176.25000* | 31.10511 | 0 | 105.8854 | 246.6146 |
| Disagreed | 187.50000* | 31.10511 | 0 | 117.1354 | 257.8646 | ||
| Undecided | Agreed | -176.25000* | 31.10511 | 0 | -246.6146 | -105.8854 | |
| Disagreed | 11.25 | 31.10511 | 0.726 | -59.1146 | 81.6146 | ||
| Disagreed | Agreed | -187.50000* | 31.10511 | 0 | -257.8646 | -117.1354 | |
| Undecided | -11.25 | 31.10511 | 0.726 | -81.6146 | 59.1146 |
Table 18: Multiple Comparisons on Perception of the Respondents on Settlement Area.
Table 18 presents the ANOVA results analyzing respondents’ perceptions regarding the impact of ineffective laws on natural resources as a driver of land use and land cover (LULC) change. The significant F-value (14.174) and p-value (0.002) indicate that there are statistically significant differences among the groups’ perceptions. This suggests that respondents hold varying views on the role of ineffective natural resource laws in influencing LULC changes in the study area.
| Sum of Squares | df | Mean Square | F | Sig. | |
|---|---|---|---|---|---|
| Between Groups | 32238.5 | 2 | 16119.25 | 14.174 | 0.002 |
| Within Groups | 10235.5 | 9 | 1137.278 | ||
| Total | 42474 | 11 |
Table 19: ANOVA in Perception of the Respondents on Ineffective Laws on Natural Resources.
Table 19 shows the results of the multiple comparisons on respondents’ perceptions regarding insufficient laws on natural resources as a driver of land use and land cover (LULC) change. The Least Significant Difference (LSD) test indicates significant mean differences between the groups.
Agreed vs. Undecided: A mean difference of 112.25 (p = 0.001) suggests that those who agreed that insufficient laws are a driver of LULC change perceive this impact significantly more than those who were undecided.
Agreed vs. Disagreed: A mean difference of 107.50
(p = 0.001) shows that those who agreed also perceive a significant difference compared to those who disagreed.
Undecided vs. Disagreed: There was no significant difference between the “undecided” and “disagreed” groups, as indicated by the non-significant mean difference of -4.75 (p = 0.847).
Overall, the results indicate a strong perception among respondents that insufficient laws on natural resources significantly influence land use changes.
| (I) Insufficient_ Law | (J) Insufficient_ Law | Mean Difference (I-J) | Std. Error | Sig. | 95% Confidence Interval | ||
|---|---|---|---|---|---|---|---|
| Lower Bound | Upper Bound | ||||||
| LSD | Agreed | Undecided | 112.25000* | 23.84615 | 0.001 | 58.3063 | 166.1937 |
| Disagreed | 107.50000* | 23.84615 | 0.001 | 53.5563 | 161.4437 | ||
| Undecided | Agreed | -112.25000* | 23.84615 | 0.001 | -166.1937 | -58.3063 | |
| Disagreed | -4.75 | 23.84615 | 0.847 | -58.6937 | 49.1937 | ||
| Disagreed | Agreed | -107.50000* | 23.84615 | 0.001 | -161.4437 | -53.5563 | |
| Undecided | 4.75 | 23.84615 | 0.847 | -49.1937 | 58.6937 |
Table 20: Multiple Comparisons on Perception of the Respondents on Insufficient Laws on Natural Resources.
*The mean difference is significant at the 0.05 level. Table 19: Multiple Comparisons on Perception of the Respondents on Insufficient Laws on Natural Resources.
Table 20 presents the results of the Kaiser-Meyer-Olkin (KMO) Measure of Sampling Adequacy and Bartlett’s Test of Sphericity, which are used to assess the suitability of the data for factor analysis.
Kaiser-Meyer-Olkin (KMO) Measure: The KMO value of 0.508 indicates a moderate level of sampling adequacy. Values above 0.5 are generally considered acceptable for factor analysis, suggesting that the data is suitable for this technique.
Bartlett’s Test of Sphericity: The approximate Chi-Square value of 24.098 with 10 degrees of freedom and a significance level (p-value) of 0.007 indicates that the correlation matrix is significantly different from an identity matrix. This means that there are sufficient relationships among the variables for factor analysis to be appropriate.
Overall, both tests confirm that the dataset is suitable for further analysis through factor analysis techniques.
| Kaiser-Meyer-Olkin Measure of Sampling Adequacy. | 0.508 | |
|---|---|---|
| Bartlett’s Test of Sphericity | Approx. Chi-Square | 24.098 |
| Df | 10 | |
| Sig. | 0.007 |
Table 21: Kaiser-Meyer-Olkin Measure of Sampling Adequacy and Bartlett’s Test of Sphericity.
Table 21 displays the communalities for each variable in the study after conducting Principal Component Analysis (PCA). Communalities indicate the proportion of each variable’s variance that can be explained by the extracted factors.
| Initial | Extraction | |
|---|---|---|
| Population growth | 1 | 0.655 |
| High demand for timber | 1 | 0.506 |
| Agricultural expansion | 1 | 0.625 |
| settlement area | 1 | 0.67 |
| ineffective laws in natural resources | 1 | 0.742 |
Table 22: Communalities**.**
Extraction Method: Principal Component Analysis. Table 21: Communalities.
Population Growth: Initial communalities are 1.000, with an extraction value of 0.655, meaning approximately 65.5% of the variance in this variable is explained by the factors identified in the PCA. High Demand for Timber: With an extraction value of 0.506, around 50.6% of its variance is explained by the factors. Agricultural Expansion: The extraction value of 0.625 indicates that 62.5% of its variance is accounted for by the identified factors. Settlement Area: This variable shows an extraction value of 0.670, suggesting that 67% of its variance is explained. Ineffective Laws in Natural Resources: This variable has the highest extraction value at 0.742, indicating that 74.2% of its variance is explained.
Overall, these communalities reflect the extent to which each variable is represented by the underlying factors, with higher values indicating a stronger relationship between the variable and the extracted factors.
Table 22 presents the total variance explained by the components identified through Principal Component Analysis (PCA). The first component has an initial eigenvalue of 1.181, accounting for 23.613% of the variance, which is the highest among the factors analyzed. The second component has an initial eigenvalue of 1.015, contributing 20.304% to the total variance, resulting in a cumulative explanation of nearly 44%. The third component also shows significant variance explanation, with an eigenvalue of 1.002 and 20.049% of the variance, leading to a cumulative total of 63.966%. In contrast, the fourth component has an eigenvalue of 0.957, explaining 19.145% of the variance, while the fifth component, with an eigenvalue of 0.844, accounts for 16.889%. Both the fourth and fifth components have eigenvalues below 1, indicating they may not be significant enough for retention in further analysis. Overall, the first three components collectively explain a substantial portion of the variance, highlighting their importance in understanding the underlying factors driving land use and land cover changes, while the latter components suggest diminishing returns in variance explanation.
| Component | Initial Eigenvalues | Extraction Sums of Squared Loadings | Rotation Sums of Squared Loadings | ||||||
|---|---|---|---|---|---|---|---|---|---|
| Total | % of Variance | Cumulative % | Total | % of Variance | Cumulative % | Total | % of Variance | Cumulative % | |
| 1 | 1.181 | 23.613 | 23.613 | 1.181 | 23.613 | 23.613 | 1.116 | 22.323 | 22.323 |
| 2 | 1.015 | 20.304 | 43.917 | 1.015 | 20.304 | 43.917 | 1.059 | 21.184 | 43.507 |
| 3 | 1.002 | 20.049 | 63.966 | 1.002 | 20.049 | 63.966 | 1.023 | 20.458 | 63.966 |
| 4 | 0.957 | 19.145 | 83.111 | ||||||
| 5 | 0.844 | 16.889 | 100 |
Table 23: Total Variance Explained.
Extraction Method: Principal Component Analysis. Table 22: Total Variance Explained.
Conclusion
The study assessed the socio-demographic drivers of land use and land cover (LULC) transformation in Central Taraba State, Nigeria. The findings reveal that population growth, agricultural expansion, high demand for timber, and ineffective resource governance are key drivers of LULC changes in the region. Analysis of respondents’ perceptions showed significant variation, reflecting the complexity of socio-demographic influences on land use. The “tragedy of the commons” framework effectively illustrates the challenges of managing shared resources, where individual needs often conflict with collective sustainability. To mitigate the adverse impacts of these drivers, it is essential to strengthen governance frameworks, promote sustainable agricultural practices, incentivize reforestation efforts, and engage communities in decision-making processes. Addressing these drivers collectively through policy and planning can enhance sustainable land management and improve community resilience in Central Taraba State.
Recommendations
Based on the findings from this study, the following recommendations are made;
Strengthen enforcement of natural resource laws and update outdated land-use policies: Enhance the capacity of law enforcement agencies to monitor and regulate land use, and revise existing policies, like the 1978 Land Use Act, to reflect current environmental challenges.
Promote sustainable agricultural practices, including agroforestry and land intensification: Encourage farmers to adopt sustainable farming methods that integrate tree planting, and intensify crop yields to reduce the need for expanding agricultural lands.
Incentivize reforestation and conservation efforts with financial compensation: Establish programs that provide financial rewards for individuals or communities who participate in reforestation or conservation activities, promoting the restoration of degraded lands.
Enhance community involvement in land-use monitoring and enforcement: Engage local communities in land management activities to promote transparency, reduce corruption, and foster collective responsibility for sustainable land use.
Foster multi-stakeholder collaboration for inclusive land management policies: Involve diverse stakeholders, including local communities, in developing land-use policies that consider the needs of all affected groups and promote sustainable practices.
Utilize geospatial technologies for real-time monitoring of LULC changes: Invest in Geographic Information Systems (GIS) and remote sensing technologies to monitor land-use changes in real-time, enabling timely intervention to prevent environmental degradation.
References
-
Lambin EF, Geist HJ, Lepers E (2001) Dynamics of Land- Use and Land-Cover Change in Tropical Regions. Annual Review of Environment and Resources 28(1): 205-241.
-
Turner BL, Lambin EF, Reenberg A (2007) The Emergence of Land Change Science for Global Environmental Change and Sustainability. Proceedings of the National Academy of Sciences 104(52): 20666-20671.
-
Adewuyi SA (2018) Urbanization and Land Use Changes in Nigeria: Implications for Sustainable Development. Journal of Environmental Studies 2(2): 78-90.
-
FAO (2020) Global Forest Resources Assessment 2020: Main Report. Food and Agriculture Organization of the United Nations.
-
Ololade AO, Afolayan AA (2018) Land use/land cover dynamics and its impact on the environment in Nigeria: A review. International Journal of Sustainable Development and Planning 13(4): 489-504.
-
Olagunju TE, Ifejika Speranza C, Odewumi SG (2019) Land-Use Dynamics and Climate Change in the Nigerian Savanna: Implications for Resilience Building in Rural Communities. Environmental Science & Policy 101: 25- 36.
-
Hardin G (1968) The Tragedy of the Commons. _Science_ 162(3859): 1243-1248.
-
Ostrom E (1990) Governing the Commons: The Evolution of Institutions for Collective Action. Cambridge University Press.
-
Taraba State Government (2019) Taraba State Development Plan, pp: 2019-2023.
-
NIMET (2020) Climate Report for Taraba State. Nigerian Meteorological Agency.
-
National Population Commission (2021) Population and Housing Census: National Summary. Federal Republic of Nigeria.
-
Bakoji YM, Elizabeth E, Philip AH, Isa MS, Abba UJ (2020) Urbanisation and its impact on agricultural lands in growing cities in developing countries: A case study of Makurdi, Benue State Nigeria. International Journal of Economy, Energy and Environment 5(4): 41-58.
-
Abba HM, Yuguda UA, Yila CN, Zhigila AD (2022) Woody Species Composition and Diversity of Wawa-Zange Forest, Gombe State, Nigeria. Asian Journal of Plant Biology 4(1): 30-35.
-
Njenga M, Gitau JK, Mendum R (2021) Women’s work is never done: Lifting the gendered burden of firewood collection and household energy use in Kenya. Energy Research & Social Science 77: 102071.
-
Dib JB, Krishna VV, Alamsyah Z, Qaim M (2018) Land-use change and livelihoods of non-farm households: The role of income from employment in oil palm and rubber in rural Indonesia. Land use policy 76: 828-838.
-
Munthali MG, Davis N, Adeola AM, Botai JO, Kamwi JM, et al. (2019) Local perception of drivers of land-use and land-cover change dynamics across Dedza District, Central Malawi Region. Sustainability 11(3): 832.
-
Zemba AA, Yusuf MB (2012) Implications of land use and land cover dynamics on arable lands in Jalingo region, Nigeria: Remote sensing and GIS approach. Adamawa State University Journal of Scientific Research 2(2): 62- 69.
-
Gideon PK, Verinumbe I (2013) The contribution of Agroforestry tree products to rural farmers in Karim- Lamido Local Government Area of Taraba state. Journal of Research in Forestry, Wildlife and Environment 5(1): 50-62.
-
Abubakar EM, Dau JH, Rabo EK (2018) Effect of socio- economic activities on tree species and conservation trend in eco-zones of Taraba State, Nigeria. Asian Journal of Research in Agriculture and Forestry 1(3): 1-6.
-
John N, Wilson AK (2016) Household wood fuel consumption and effect on climate change in Taraba state, Nigeria. Bassey Andah Journal 9: 1-13.
-
Yusuf MB, Jauro UA (2024) Impact of Land Use and Land Cover Change on Deforestation in the Central Taraba State: A Geographic Information System and Remote Sensing Analysis. Environmental Protection Research pp: 30-41.
-
Ajake AO, Anyandike RNC (2012) Assessment of forest management institutions and their initiatives in the rainforest communities of Cross River State, Nigeria. Journal of Geography and Geology 4(1): 257.
-
Aliyu A, Modibbo MA, Medugu NI, Ayo O (2014) Impacts of deforestation on socio-economic development of Akwanga Nasarawa State. International Journal of Science, Environment and Technology 3(2): 403-416.
-
Oruonye ED (2014) An assessment of the impact of road construction on land use pattern in urban centres in Nigeria, A case study of Jalingo LGA, Taraba State Nigeria. Mediterranean Journal of Social Sciences 5(10): 82-88.
-
Mba EH (2018) Assessment of environmental impact of deforestation in Enugu, Nigeria. Resources and Environment 8(4): 207-215.
-
Bunde M (2018) Threats and conservation status of woody plant species in different ecological zones of Taraba State, Nigeria. Adv Plants Agric Res 8(6): 443- 447.
-
Bariweni PA, Andrew CE (2017) Land use/Land cover changes and causes of deforestation in the Wilberforce Island, Bayelsa State, Nigeria. Journal of Applied Sciences and Environmental Management 21(6): 1063-1066.
- Lessons to Learn: Trees are More than the Lungs of the World
- Community Forestry Enterprises as a Model for Sustainable Forest Development: The Case Of The "Baja Tarahumara" in Chihuahua, Mexico
- Ecological and Socio-Economic Impacts of Chromolaena odorata and Mesosphaerum suaveolens, Two Invasive Alien Species in Central and Southern Benin, West Africa
- Epigenetic Sustainability: Modeling the Human Factor as a Natural Resource through Science 4.0 and the NR3C1 Biological Pilot
- Growth-at-Risk: A Framework for Assessing Economic Vulnerability
- The Rural Territory as a Socioecological System for the Management of Public Policy for Sustainable Rural Development