Transient Increase in the Terminal Negative Deflection of the P Wave in Lead V1 during Treadmill Testing Identifies Exercise Induced Aggravated Left Ventricular Dysfunction
Terminal negative deflection of the P wave in lead V1 is produced by posteriorly directed depolarization of the left atrium. A value of more than 0.04 mm sec suggests increase in left atrial pressure. Transient new appearance of this finding during treadmill testing suggests transient exercise induced increase in left atrial pressure. Indirectly it suggests transient exercise induced/aggravated increase in left ventricular end diastolic pressure. In presence of clinical and/or electrocardiographic findings of myocardial ischemia, this finding suggest ischemia induced left ventricular dysfunction. Earlier this finding appears during exercise and longer it lasts during recovery, more severe is the left ventricular dysfunction.
Introduction
It is known that left ventricular ischemia decreases left ventricular compliance. It results in increase in left ventricular end diastolic pressure and consequently left atrial pressure. Distension of the left atrium results in prolongation of left atrial depolarization wave [1, 2]. It was, therefore, expected that detection of electrocardiographic evidence of left atrial abnormality and it’s addition to ST- segment criteria may increase sensitivity of exercise testing in detecting myocardial ischemia [3, 4]. Several, criteria are suggested for electrocardiographic diagnosis of ‘left atrial abnormality’. These include notched P wave with a duration of 0.12 second or more with peak -to-peak interval of 40 msec or more between two humps, terminal negative component of P wave in lead V1 equal to or more than 0.04 mVsec and leftward shift of the P wave axis to less than +15 degrees [5, 6, 7].
Most of the previous workers in the field of treadmill testing have evaluated change in the duration of the P wave with exercise. They observed that with exercise, the P wave duration shortens by about 0.02 second in lead II in normal persons [1, 8]. They also observed that in the presence of myocardial ischemia, the duration of the P wave may increase slightly or may remain unchanged [8]. Previous workers also observed that increase in the duration of the P wave, even when present, was very small [9]. Any meaningful increase could be identified only by using computerized signal averaged electrocardiogram and magnifying the electrocardiogram several times [2, 4]. Authorities, therefore feel that use of P wave duration in the diagnosis of myocardial ischemia is possible only after the development of software for correct measurement of such a minimal change [9]. Tachycardia also results in progressive shortening of the T wave to the P wave interval. At fast heart rate, this results in overlapping of the T wave and the P waves [2]. This also interferes with correct measurement of P wave duration at fast heart rate during exercise. Leftward shift of the mean frontal plane P wave axis needs measurement of amplitude and direction of the P wave vector in different frontal plane leads and than calculation of exact mean frontal plane axis to correctly detect minor changes in the P wave axis. Computerized interpretation of the mean frontal plane P wave axis is not available in the treadmill software. Further, this criteria lacks sensitivity and specificity [10].
On the contrary, abnormalities of the terminal negative component of the P wave in lead V1 can be easily determined visually Gering LE, et al. [10] without any need for magnification of the electrocardiogram. It also does not need sophisticated facility for measurement. Evaluation of the terminal negative deflection of the P wave in lead V1 is also not influenced by the preceding T wave due to intervening initial positive deflection of the P wave in lead V1.
We therefore tried to correlate new appearance of this electrocardiographic finding during treadmill test with clinical and electrocardiographic profile and ST-segment changes during treadmill testing.
Material and Methods
Inclusion Criteria
- Angina or angina equivalent symptoms on effort.
- Unexplained breathlessness on effort.
- Patients of systemic hypertension and/or diabetes.
- Normal resting electrocardiogram without any evidence of left atrial abnormality.
- New appearance of electrocardiographic signs of left atrial abnormality during exercise.
- Absence of any regional wall motion abnormality on echocardiography at rest.
- Normal left ventricular systolic functions on echocardiography at rest.
- Diastolic dysfunction on Doppler evaluation of mitral valve flow and/or diastolic dysfunction on tissue Doppler imaging of mitral annulus.
- Absence of any other cardiac pathology, cardiac chamber enlargement or pulmonary artery hypertension on echocardiographic evaluation.
- Absence of any P wave abnormality on standing and during active hyperventilation.
- Resting heart rate above 55/minute to exclude any possibility of sinus node dysfunction.
Exclusion Criteria
• Conditions that could produce electrocardiographic findings suggestive of ‘left atrial abnormality’ at rest.
These conditions include. Wrong higher placement of leads V1 and V2, Mittal SR [11] pectus excavatum, ‘straight back’ mitral valve disease some cases of chronic obstructive pulmonary disease specially those with emphysema and vertical heart [10, 12]. Constritive pericarditis [13] and intra-atrial conduction defects [14].
- Unstable angina on minimal effort or angina at rest.
- Inability of the patient to perform adequate exercise.
- Persons with ectopic supraventricular rhythm at rest or during exercise.
- Inability to correctly interpret the electrocardiogram due to artifacts.
Treadmill Test Protocol
All leads were correctly placed by a qualified cardiologist who also supervised the whole procedure. Mason-Liker lead system Mason RE, et al. [15] was used. All the twelve leads were recorded simultaneously. The Bruce protocol Bruce R, et al. [16] was followed. Exhaustion rather than age predicted target heart rate was taken as the end point [17]. Exercise was also terminated if there was development of angina, ST-segment elevation in any lead, or appearance of any arrhythmia. There was no cool down wall to avoid any recovery of ECG changes. Patient was placed in supine position soon after completion of the exercise. Recovery was recorded for nine minutes.
• Calculation of Duration of the Terminal Negative Deflection of the P Wave in Lead V1 It was calculated as: Depth of the terminal negative deflection of the P wave (in millivolt or millimetres) x duration of the terminal deflection in second. At normal standardization (10 small square - = 1 mill volt along vertical axis 1 small square is equal to 0/millivolt). At conventional speed of recording of the ECG (25 mm/sec). 1 small square (1mm) along horizontal axis in equal to 0.04 second.
Case 1
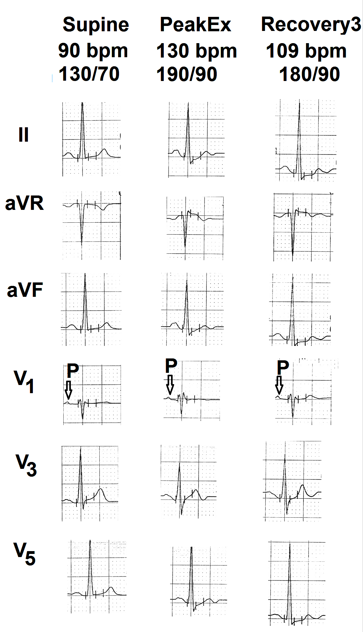
Treadmill test was performed on a 75 years old female for atypical chest pain. Supine heart rate was 90 beats per minute. Resting blood pressure was 130/70 mm Hg. Supine electrocardiogram was within normal limits (Figure 1 Supine). Patient could exercise for seven minutes (5.5 METs). Peak heart rate was 130 beats per minute. (90% of age predicted maximal heart rate) Peak blood pressure was 190/90 mm Hg.. There were no symptoms. There was no evidence of ischemia during exercise and recovery (Figure 1 Peak and Recovery 3 minutes). There was no change in the P wave in lead V1. This case shows that in persons with normal cardiovascular system, exercise induced sinus tachycardia does not make any change in the P wave of lead V1.
Case 2
Treadmill test was performed on a 36 years old male for routine checkup. He had mild hypertension (supine blood pressure 140/90 mm Hg). Supine heart rate was 95 beats per minute. Resting electrocardiogram was normal (Figure 2 supine). Patient could exercise for 10 minutes (10.9 METs). Peak heart rate was 157/minute (85% of age predicted maximal heart rate) and peak blood pressure was 170/102 mm Hg. There were no symptoms during exercise and recovery. There was no electrocardiographic evidence of ischemia (Figure 2 Peak and recovery 5). Negative component of the P wave in lead V1 progressively increased. At peak exercise P wave in lead V1 was totally negative (more than 0.04 mm sec) (Figure 2 Peak). P wave configuration returned to normal by the end of fifth minute of recovery (Figure 2 Rec5). This case shows that patients who have mild hypertension and have systolic hypertensive response during exercise develop electrocardiographic evidence of ‘left atrial abnormality’ during exercise.
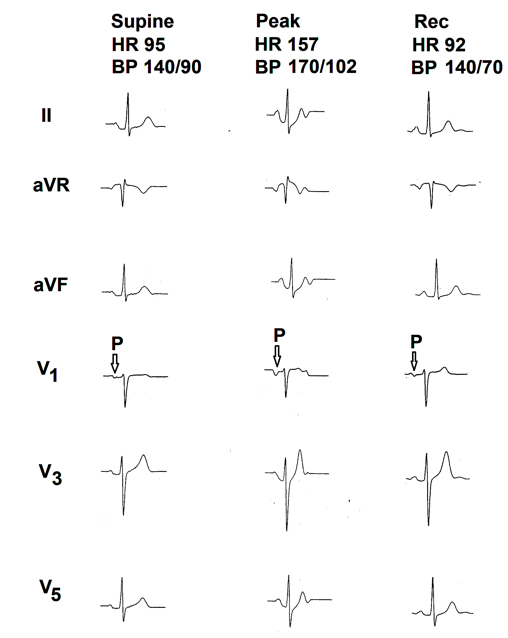
Figure 2: Selected electrocardiographic leads from the treadmill test of the second case. Supine electrocardiogram is normal. There is no electrocardiographic evidence of myocardial ischemia during exercise and recovery. There is increase in the terminal negative deflection of the P wave in lead V1 (marked as ⇩) at peak exercise. P wave normalized by the end of fifth minute of recovery.
Case 3
A 48 years old male performed treadmill test for the complaint of breathlessness on effort. He was a known hypertensive receiving antihypertensive medicines. Echocardiography revealed moderate concentric left ventricular hypertrophy with impaired relaxation of the left ventricle on mitral valve flow Doppler. Resting heart rate was 55 beats per minute and resting blood pressure was 130/90 mm Hg (on antihypertensive drugs). Resting electrocardiogram was normal except mild left deviation of mean frontal plane QRS axis. He could exercise for 7:29 minutes (8.6 METs). Peak heart rate was 168 beats per minute (98% of age predicted maximal heart rate). Peak blood pressure was 180/90 mm Hg. He complained of breathlessness at peak exercise. Negative component of the P wave in lead V1 progressively increased during exercise and was dominantly negative (more than 0.04 mm sec) by the end of third minute of recovery (Figure 3 Rec 3). P wave inversion in lead V1 persisted up to the end of seventh minute of recovery (Figure 3 Rec 7). There was no electrocardiographic evidence of myocardial ischemia (Figure 3 peak and recovery). There was mild prolongation of the P-R interval during recovery (Figure 3 Rec 7) as compared of resting ECG
(Figure 3 supine). P wave amplitude in leads II, III, aVF, V3 to V5 increased in amplitude during recovery. Recovery of heart rate and blood pressure was slow. At the end of the 7th minute of recovery, heart rate was still 96 beats per minute and blood pressure was 150/90 mm Hg. This case shows that patients with left ventricular hypertrophy and impaired relaxation of the left ventricle at rest develop prominent negative deflection of the P wave in lead V1 during exercise. P wave changes may be clear during recovery and may persist for several minute during recovery till the blood pressure and heart rate normalize.
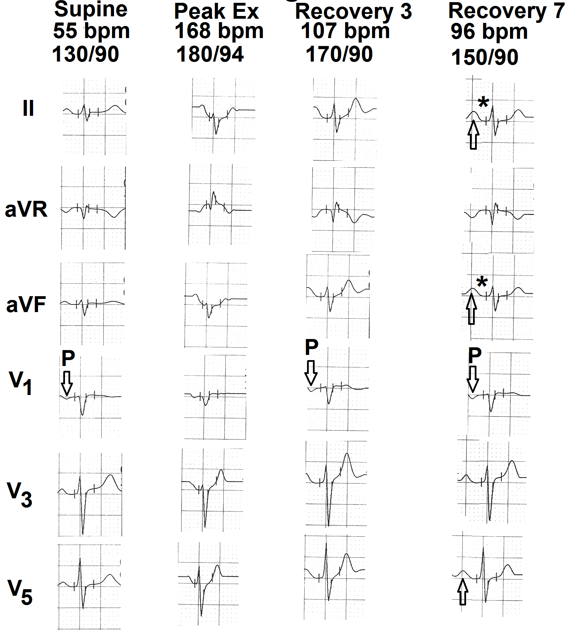
Figure 3: Selected electrocardiographic leads from the treadmill test of the third case. Resting supine electrocardiogram is normal. There is no electrocardiographic evidence of myocardial ischemia during exercise and recovery. Terminal negative deflection of the P wave in lead V1 (marked as ⇩) is more than 0.04 mm sec from third minute of recovery to seventh minute of recovery. There is mild prolongation of the P-R interval during recovery (marked as ∗). There is mild increase in the amplitude of P wave in leads II, aVF and V5 (marked as ⇧).
Case 4
A 55 years old male performed treadmill test for evaluation of chest pain on effort. Resting supine heart rate was 72 beats per minute and resting supine blood pressure was 120/80 mm Hg. Resting supine electrocardiogram was normal (Figure 4 supine). Patient could exercise for 9:31 minute (10.8 METs). Peak exercise heart rate was 161 beats per minute (98% of the age predicted maximal heart rate). Peak blood pressure was 170/80 mm Hg. There were no symptoms. There were no electrocardiographic signs of myocardial ischemia during exercise (Figure 4 peak). P wave in lead V1 that was positive in supine position (Figure 4 supine) became negative (more than 0.04 mm sec) at peak exercise (Figure 4 peak). Downsloping ST-segment appeared in leads II, III, aVF, V4, V5 and V6 during 5th minute of recovery (Figure 4 Rec 5). This case shows that new appearance of a negative P wave in lead V1 during exercise could give a suspicion of underlying left ventricular dysfunction. Myocardial ischemia may became clear only during recovery.
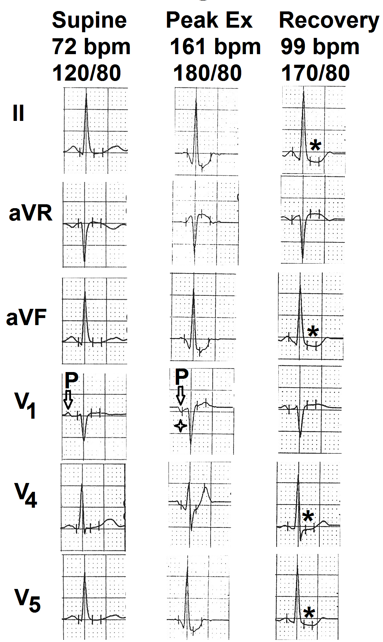
Figure 4: Selected electrocardiographic leads from the treadmill test of the fourth case. Resting supine electrocardiogram is normal. There is no evidence of myocardial ischemia during exercise and recovery. P wave in lead V1 (marked as ⇩) was positive in supine position. It became negative (more than 0.04 mm sec) at peak exercise (marked as ✦). Downsloping ST-segment depression appeared in leads II, aVF, V4 and V5 during 5th minute of recovery. (marked as ∗).
Case 5
A 62 years old male was evaluated for chest pain on effort. Resting heart rate was 75 beats per minute. Resting supine blood pressure was 130/80 mm Hg. Resting electrocardiogram was normal except slightly inverted P wave (less than 0.04 mm sec.) in lead V1 and low voltage biphasix (+/-) P wave in lead V2 (Figure 5 supine). Patient could exercise for 6:29 minutes (8.0 METs). Peak heart rate was 162 beats/minute (103 % of age predicted maximal heart rate). Peak blood pressure was 190/90 mm Hg. Leads
II, III, aVF, V5 and V6 showed ST-segment depression at peak exercise (Figure 5 peak). Lead aVR showed ST-segment elevation (Figure 6 peak). P wave negativity in lead V1 increased and P wave of lead V2 became inverted (Figure 5 peak). P wave depth decreased progressively during recovery and came to pre-exercise levels by the end of seventh minute of recovery (Figure 5 Rec 7, marked as P). This case shows that during exercise induced myocardial ischemia, negativity of the P wave can extend up to lead V2.
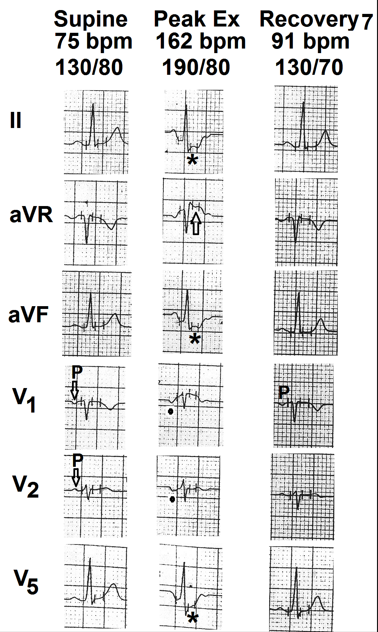
Figure 5: Selected electrocardiographic leads from the treadmill test of the fifth case. Resting supine electrocardiogram is normal. P wave shows shallow inversion in lead V1. P wave in lead V2 is biphasic (+/-) (marked as ⇩) There is ST-segment depression in leads II, III, aVF, V5 and V6 (marked as ∗) and ST-segment elevation in lead aVR (marked as ✦) at peak exercise. At peak exercise, P wave is prominently negative in leads V1 and V2 (marked as ⦁). P wave depth decreased progressively during recovery. At the end of seventh minute of recovery the P wave in lead V1 shows shallow inversion and the P wave in lead V2 has become position (marked as ⇧).
Case 6
A 26 years old male performed treadmill test for chest pain on effort. Resting heart rate was 76 beats per minute. Resting electrocardiogram showed inversion of initial part of T wave in lead II,III aVF, V4 , V5 (Figure 6 supine). P wave in lead V1 was low amplitude and biphasic +/- ve (Figure 6 supine). Negative component was less than 0.04 mm sec.
Patient could exercise for 9:15 minutes (10.6 METS). Peak heart rate was 160 beats per minute. During stage 1, P wave in lead V1 became negative (Figure 6 stage 1) and there was mild ST-segment depression in lead II, III, aVF, V4, V5 and V6 (Figure 6 stage 1). At peak exercise, P wave in lead V1 continued to be negative and leads V4, V5 and V6 showed clear ST-segment depression (Figure 6 peak). By the end of three minutes of (Figure 6 Rec 3) recovery P wave in lead V1 remained only mildly negative and ST-segment changes nearly normalized. This case shows that in patients with non-specific electrocardiogram at rest new development of prominent negative deflection of the P wave during exercise supports the possibility of a true positive diagnosis.
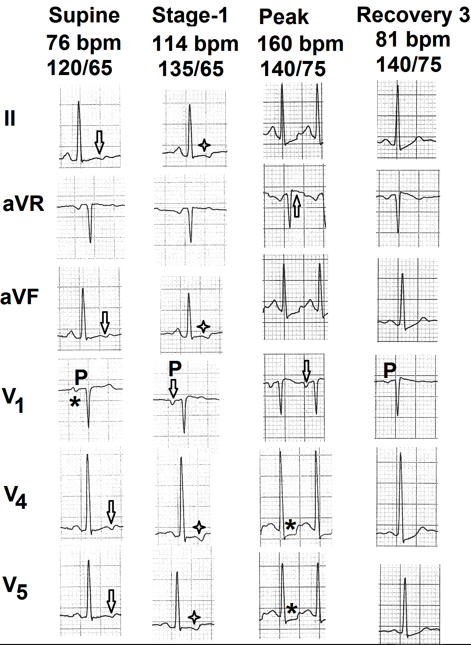
Figure 6: Selected electrocardiographic leads from the treadmill test of the sixth case. Resting supine electrocardiogram shows biphasic (+/-) P wave in lead V1 (marked as ∗). There is inversion of initial part of T wave in leads II, aVF, V4 and V5 (marked as ⇩). During stage 1 P wave in lead V1 is negative (marked as ⇩) and there is mild ST-segment depression in leads II, aVF, V4 and V5 (marked as ✦). At peak exercise P wave in lead V1 is negative (marked as ⇩). Leads V4 and V5 show clear ST- segment depression (marked as ∗). By the end of third minute of recovery (rec3) depth of the P wave in lead V1 is significantly reduced and the ST-segment depressions in leads V4 and V5 have normalized.
Case 7
A 59 years old man performed treadmill test for chest pain and nonspecific ST-segment changed. Resting supine heart rate was 62 beats per minute and resting supping blood pressure was 120/80 mm Hg. Resting electrocardiogram (Figure 7 Rest) showed mild nonspecific ST-segment changes in lead II, III, aVF, V5 and V6 (Figure 7- supine). P wave in lead V1 was slightly negative (less than 0.04 mm sec). Patient could exercise for 6:32 minutes (7.7 METs). Peak heart rate was 141 beats per minute and peak blood pressure was 160/90 mm Hg. P wave in lead V1 became progressively negative during exercise. At peak exercise, P wave in lead V1 was prominently negative (Figure 7 peak) and there was elevation of ST-segment in leads aVR and V1 Figure 7 peak). Negative deflection of P wave in lead V1 gradually normalized by the end of seventh minute of recovery (Figure 7 Rec 7). This case show that in patients with nonspecific ST-segment changes, new appearance of prominent negative deflection of the terminal part of P wave in lead V1 cam give a due to underlying myocardial ischemia.
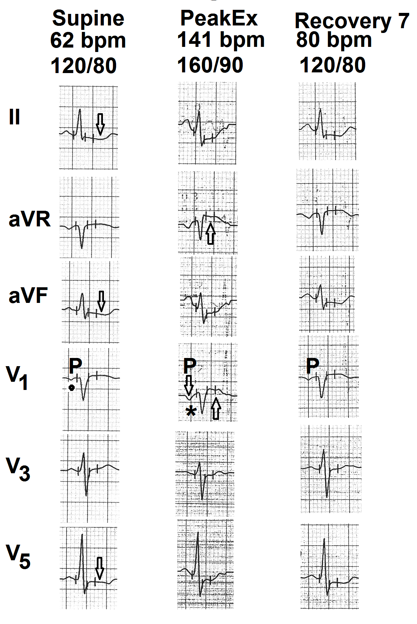
Figure 7: Selected electrocardiographic leads from the treadmill test of the seventh case. Resting supine electrocardiogram shows mild nonspecific ST-segment depression in leads II, aVF and V5 (marked as ⇩) P wave in lead V1 shows shallow inversion (marked as ⦁). At peak exercise P wave in lead V1 is prominently negative (marked as ∗). There is elevation of the ST-segment in leads aVR and V1 (marked as ⇧). By the end of seventh minute of recovery, depth of P wave in lead V1 is significantly reduced and ST- segment elevation in leads aVR and V1 have normalized.
Discussion
Normal P wave in lead V1 is usually small and biphasic (+/-). Initial positive deflection is due to anteriorly directed vector produce by depolarization of the anteriorly placed right atrium. This vector moves towards lead V1 and therefore produces initial positive deflection. Terminal negative deflection is produced by delayed depolarization of the posteriorly placed left atrium. This vector moves away from lead V1 and, therefore, produces terminal negative deflection. Normal duration of the terminal negative component of the P wave is 0.03 mV sec (mm sec) or less [10]. A value of 0.04 mV sec (mm sec) is considered suggestive of delayed and prolonged depolarized of the posteriorly placed left atrium [10].
Tachycardia occurs at the cost of diastolic interval (duration between end of the T wave and onset of the next QRS). Ventricles relax during the diastolic period. This reduces ventricular end diastolic pressure. Progressive reduction in the diastolic interval, therefore, does not allow normal fall in end diastolic pressure of the ventricles. End diastolic pressure of each ventricle is transmitted backwards to the corresponding atria as the atrioventricular valves are open during diastolie and corresponding atrium and ventricle act as a common chamber. Left ventricular end diastolic pressure, therefore, controls left atrial mean pressure. Progressive increase in left ventricular end diastolic pressure (left atrial mean pressure) is, therefore, much more in individuals with resting and /or exercise induced diastolic and/or systolic dysfunction. It results in transient dilatation of the left atrium. Left atrial depolarization, therefore, takes longer time resulting in transient increase in duration of the terminal negative component of the P wave in lead V1 during exercise induced tachycardia. During recovery heart rate rapidly settles down due to decrease in sympathetic tone and increase in vagal tone. Diastolic period progressively lengthens resulting in rapid decrease in left ventricular end diastolic pressure (left atrial mean pressure). Left atrial dimension rapidly normalizes. Delayed depolarization of the left atrium also rapidly normalizes resulting in simultaneous normalization of the terminal negative component of the P wave in lead V1.
Sutnick AI, et al. [18] have observed transient increase in the depth and duration of the terminal negative deflection of the P wave in lead V1 during left ventricular failure. Romhilt DW, et al. [19] have also observed that electrocardiographic signs of left atrial abnormality are seen transiently during episodes of pulmonary oedema. They also observed that half of such cases may not show the P wave changes after treatment for four days. These observations suggest that such P wave changes are probably due to transient increase in left atrial pressure rather than left atrial weight [20].
Earlier during exercise, the left ventricular end diastolic pressure rises, earlier is the appearance of the abnormal terminal negative deflection of the P wave in lead V1. At times the ischemia is more during recovery. In these cases abnormality of the P wave in lead V1 may be more apparent during recovery and may take longer to normalize.
As the left atrial volume increase only for a short period near peak exercise, there is no measurable increase in resting left atrial dimensions. Other modalities of investigations that evaluate the dimension of cardiac chambers in resting stage (e.g. echocardiography or magnetic resonance imaging), therefore, find normal dimensions of the left atrium.
We did not observe new appearance of wide and notched P wave in any case during exercise and recovery. It could be because of the fact that our cases had only transient increase in left atrial pressure during exercise with rapid recovery. Such patients are not expected to have permanent dilatation of the left atrium. Wide and notched P waves correlate with left atrial dilatation [21].
Sigwart, et al. [22] have shown transient increase in left atrial volume and pressure during acute transient left ventricular ischemia produced during percutaneous transluminal coronary angioplasty of the left anterior descending coronary artery. Martin CM, et al. [23] also observed progressive increase in pulmonary capillary wedge pressure (representing left atrial pressure) with increasing duration of exercise in patients with coronary artery disease.
In one of our cases (case no 3) P wave changes in lead V1 were most apparent during third minute of recovery and persisted up to the end of seventh minute of recovery. In another case (case no. 7) P wave changes normalized only by the end of seventh minute of recovery.
It is known that in large number of cases of coronary artery disease, ST-segment changes may be maximal during recovery Thomas GS, et al. [8] and such changes have the same significance as ST-segment depression occurring during exercise [24, 25]. Appearance of prominent negative terminal deflection of P wave in lead V1 could also be affected by blood pressure response during exercise. Persons with hypertensive response during exercise are more likely to develop this finding. Schamroth L [12] have also observed that maximum P wave change during exercise test in patients of coronary artery diease may be apparent in the third minute of recovery. Wsol A, et al. [4] also observed that P wave changes were most apparent in immediate recovery.
We did not correlate changes in the terminal negative component of the P wave in lead V1 with hemodynamic changes. It is possible that we could have missed mild or even mild to moderate increase in left atrial pressure. Sensitivity of this electrocardiographic finding, therefore, could be lower than expected. However, specificity of this electrocardiographic finding in suspecting significant increase in left atrial pressure is likely to be high.
Early appearance of such changes (during stage 1 and 2) and longer persistence during recovery (after five minutes) may represent greater left ventricular dysfunction. In the context of coronary artery disease, this finding may correlate with severity of coronary artery disease.
Wsol A, et al. [4] have also observed that P wave changes, when present, could be suggestive of left main and three vessel disease. Mirvis DM, et al. [7] also feel that presence of P wave changes suggest more severe LV dysfunction in patients with ischemic heart disease.
We did not perform coronary angiography, exercise echocardiographic or hemodynamic studies during exercise. Correlation of electrocardiographic findings with these investigation may be more informative.
Conclusion
Prominent terminal negative deflection of the P wave in lead V1 suggests increased left atrial pressure. New appearance of this finding during treadmill testing suggests exercise induced/aggravated systolic and/or diastolic left ventricular dysfunction. In presence of other clinical or electrocardiographic signs of myocardial ischemia, this finding suggests severe coronary artery disease.
References
-
Pandya A, Ellested MH, Crump R (1996) Time course of changes in P wave duration during exercise. Cardiology 87(4): 343-346.
-
Myrianthefs MM, Ellested MH, Startt-Selvester RH, Crump R (1991) Significance of P wave changes during exercise in patients with coronary artery disease and correlation with angiohraphic findings. Am J Cardiol 68(17): 1619-1624.
-
Magnis JC, Gupta V, Gamie SH, LaBarbera JJ, Startt- Selvester RH, et al. (2010) Usefulness of P wave duration to identify myocardial ischemia during exercise testing. Am J Cardiol 105(10): 1365-1370.
-
Wsol A, Wydra W, Chmietewski M, Swiatowiec A, Kuch M (2017) Increased sensitivity of prolonged P wave during exercise stress test in detection of angiographically documented coronary artery disease. Cardiol J 24(2): 159-166.
-
Morris JJ, Estes EH, Whalen RE, Thompson HK, Mcintosh HD (1964) P wave analysis in valvular heart disease. Circulation 29: 242-252.
-
De Luna AB, Goldwasser D, Fiol M, Bayes Genis A (2017) Surface electrocardiography. In: Fuster V, Harrington RA, et al. (Eds.), Hurst’s The Heart. Mc Graw Hill, New York, USA, pp: 252-317.
-
Mirvis DM, Goldberger AL (2019) Electrocardiography. In: Zipes DP, Libby P, et al. (Eds.), Braunwald’s Heart Disease. Elsevier, Philadelphia, pp: 117-161.
-
Thomas GS, Samtani SR, Ellestad MH (2018) Interpretation of the ECG during exercise and recovery. In: Thomas GS, Wann LS, et al. (Eds.), Ellested’s Stress Testing. Oxford, New Delhi, India, 18: 160-198.
-
Myrianthefs MM, Shandling AH, Startt-Selvester RH, Bernstein SB, Crump R, et al. (1992) Analysis of the signal averaged P wave duration in patients with percutaneous coronary angioplasty induced myocardial ischemia. Am J Cardiol 70(7): 728-732.
-
Gering LE, Surawicz B, Knilans TK, Tavel M (2008) Atrial abnormalities. In: Chou’s Electricardiography in Clinical Practice. Saunders, Philadelphia, pp: 29-44.
-
Mittal SR (2023) Technical errors and artefacts. In: Mittal SR (Ed.), Insights into electrocardiograms with MCQs. Springer Nature, Singapore, pp: 1-13.
-
Schamroth L (1982) The normal and abnormal P wave. In: Schamroth C (Ed.), An introduction to electrocardiography. Blackwell Science, France, pp: 49- 63.
-
Dalton JC, Parson RJ, While PW (1952) Constrictive pericarditis: a review and long term follow up of 78 cases. Ann Intern Med 45: 445-458.
-
Wenger R, Hofmann-Credner D (1952) Observations on the atria of the human heart by direct and semidirect electrocardiography. Circulation 5: 870-877.
-
Mason RE, Likar Z (1966) A new system of multiple lead exercise electrocardiography. Am Heart J 71(2): 196-
-
Bruce R, Blackman J, Jones J, Strait J (1963) Exercise testing in adult normal subjects and cardiac patients. Pediatrics 32: 742-756.
-
Jain M, Nikonde C, Lin BA, Walker A, Wackers FJ (2011) 85% of maximal age predicted heart rate is not a valid end point for exercise treadmill testing. J Nucl Cardiol 18(6): 1026-1035.
-
Sutnick AI, Soloff LA (1962) Posterior rotation of the atrial vector: an electrocardiographic sign of left ventricular failure. Circulation 26: 913-915.
-
Romhilt DW, Scott RC (1972) Left atrial involvement in acute pulmonary oedema. Am Heart J 83(3): 328-331.
-
Romhilt DW, Bove KE, Conradi S, Scott RC (1972) Morphologic significance of left atrial involvement. Am Heart J 83(3): 322-327.
-
Kasser I, Kennedy JW (1969) The relationship of increased left atrial volume and pressure in abnormal P wave on the electrocardiogram. Circulation 39(3): 339- 343.
-
Sigwart U, Grbie M, Govy JJ, Kappenberg L (1990) Left atrial function in acute transient left ventricular ischemia produced during percutaneous transluminal coronary angioplasty of the left anterior descending coronary artery. Am J Cardiol 65(5): 282-286.
-
Martin CM, Mc Conahay DR (1972) Maximum treadmill exercise electrocardiography: correlation with coronary arteriography and cardiac hemodynamics. Circulation 46(5): 956-962.
-
Goldschlager N, Selzer A, Cohn K (1976) Treadmill stress tests as indicators of presence and severity of coronary artery disease. Ann Intern Med 85(3): 277-286.
-
Lachterman B, Lehmann KG, Abrahamson D, Froelicher VF (1990) “Recovery only” ST-segment depression and the predictive accuracy of the exercise. Ann Intern Med 112(1): 11-16.
- Anomalous Origin of the Left Coronary System from the Right Coronary Cusp: A Rare Coronary Anomaly in a Patient Undergoing Aortic Stenosis Workup
- Optimizing the Therapeutic Potential of Sacubitril/Valsartan: The Promise of Co-Crystal Engineering
- Association between Mortality and Topography of Peripheral Arterial Disease due to Atherosclerosis Obliterans
- Mitral Valve Replacement vs Mitral Valve Repair
- Characteristics and Evolution of Patients with Heart Failure Hospitalized in the Cardiology Department of Dalal Jamm Hospital
- Distribution of Association between Basic Knowledge of Chest Pain and Myocardial Infarction (Heart Attack) and Demographic Variables: A Survey-Based Study