Impact Assessment of Gas Flaring on Soil Bacterial Community Structure and Physicochemical Property in Nigeria
Gas flaring is the wasteful emission of hydrocarbon gases into the atmosphere; it is routinely used to dispose flammable gas that either is assumed unusable or uneconomical to recover. The burning of the wasteful gas has been shown to have significant environmental consequences. Therefore, this study was designed to determine the impact of gas flaring on soil bacterial spectrum and its physicochemical property. Soil microbiological quality was investigated using culture techniques while physicochemical property of the soil was analyzed using standard analytical procedures. Results obtained showed that pH and Av. phosphorus decreased from 5.80 and 8.86mg/kg in control soil to 5.40 and 6.50mg/kg in flared soil respectively. Electrical conductivity and total organic carbon increased from 100μS/cm and 0.20% in control soil to 160μS/cm and 0.63% in flared soil respectively. Total nitrogen slightly increased from 0.01% in control soil to 0.02% in flared soil. Soil textural class was sandy-clay-loam for both control and flared soils. Mean counts of bacteria increased from 4x10³cfu/g in SD50m to 2.0x10⁴cfu/g in SD100m, 3.1x10⁴cfu/g in SD200m, 4.5x10⁴ in SD300m to 4.8x10⁵cfu/g in control soil. All the bacterial species were isolated from control and SD300m soils except Acinetobacter and Microbacteriun species which did not occur in SD300m soil. Six (6) organisms: Bacillus, Corynebacterium, Pseudomonas, Paenibacillus, Pusillimonas and Salinicoccus species were isolated from SD50m soil. The number of bacterial genera isolated increased to eleven (11) in SD100m soil with Cronobacter, Enterobacter, Escherichia coli, Kluyvera, and Microbacterium species added to those of SD50m soil. Fifteen (15) organisms occurred in SD200m soil as Acinetobacter, Arthrobacter, Brevibacterium, Klebsiella, Rathayibacter and Staphylococcus species were added. This study revealed that gas flaring decreased bacterial population in soil in close proximity to the flare point; the effect being reduced as the sampling distance from the flare point increased. Some physicochemical parameters decreased in flared soils and others increased when compared with control soils. Gas flaring selectively inhibited soil bacteria with more species occurring in soils farther away from the flare and soil closest to the flare point having less numbers of bacteria. In conclusion, gas flaring had negative impact on soil bacteria and varied effect on physicochemical properties of the soil; in this way soil fertility could have been hampered. Oil and gas companies as well as government agency need to adopt measures that would curb unnecessary gas flaring in Nigeria by putting the flared gas into economic use.
Introduction
Petroleum production processes result in separation
of crude oil into gas, oil and water; the oil is sent through expedition line for refining, the gas is usually flared and the water is discharged into the environment as wastewater [1, 2, 3]. During the process of crude oil exploration, exploitation and production, the by-products of natural gas is being flared into the atmosphere in the production field.
Gas flaring is the controlled burning of natural gases associated with oil production; it is the wasteful emission of hydrocarbon gases, CO2 and nitrogen oxides, into the atmosphere, which cause photochemical reactions resulting in ‘smog’. The consistent flaring of gases has left a devastating effect on the surrounding environment of the Niger Delta Area, where the activities of oil exploration and exploitation is greatest [4]. With a daily crude oil output in excess of two million barrels per day, Nigeria has over 200 gas flaring sites some of which have been on continuously for over 20years. While about 22 billion standard cubic feet of natural gas is produced daily, about 75% of this quantity is being flared [5]. Nigeria’s oil reserve is significant and is being viewed as a “natural gas province” and number one gas flamer more than anywhere else in the world [6]. A significant potential reserve of non-oil associated gas is yet to be discovered.
The routine/common practice in the oil production for decades is with elevated flare in which the combustion is carried out through the top of a pipe or stack where the burner and igniter are located. Also, flaring is used to consume waste gases in a safe and reliable manner through combustion in an open flame. In the petroleum industry, flaring occurs during well testing and production operation. Flaring is used to dispose the associated flammable gases that are either unusable or uneconomical to recover. However, modern scientific methods have made it possible for the gas to either be safely re-injected or put into effective and efficient use. Yet the situation has not changed in Nigeria, and is still ranked as the highest flamer of gas more than anywhere else in the world [6]. Nigeria is estimated to be flaring over 75% of its associated gas while only 12% is re-injected during production process to enhance oil recovery [6]. But Canada, for example in 1996 utilized in some manner, 92% of its gas, while only eight percent (8%) was flared [6].
Natural gas like crude oil is not a single chemical substance and may not be represented by a chemical formula. Rather it is a naturally occurring mixture of hydrocarbons and non-hydrocarbons existing as gas at ordinary temperatures and pressures [7]. In the raw state produced from the earth’s crust, natural gas consists predominantly of methane gas, ethane and fractional amounts of propane, pentane and other heavier hydrocarbons. In addition to the hydrocarbons, natural gas contains non-hydrocarbon gaseous contaminants such as CO2, water, N2, and O2, as well as small quantity of metals like mercury and zinc in the form of dissolved salts [8]. Many other by-products that are emitted in form of impurities and/or liquid droplets include particulate matters, volatile organic compounds such as benzene, toluene and xylene, small quantities of sulphur compounds such as carbon disulphide, carbon sulphide, sulphate (iv) oxide, hydrogen sulphide and oxides of nitrogen [7].
Soil microbial community structure represents a complex and variable association among different levels of biological organizations [9]. Brock and Machigam [10] described soil as a complex microbial habitat with differing microorganisms. Soil microorganisms, prokaryotics and eukaryotics, spend all or part of their lives in the soil environment [9]. These microorganisms live together interacting with each other and with other organisms in the soil. The chemical compositions of soil affect type and size of its microbial populations. Factors that may also affect microbial population in soil include temperature, pH, nutrient availability, and degree of aeration [11].
Gas flared products exert adverse effects on soil condition [12] and microorganisms [13]. Thus microbial populations are typically affected in various ways and soil bacteria vital for agriculture is also greatly reduced especially in proximity to flares [7, 14]. Also, gas flaring lowers soil pH, aluminum mobilization and increase temperatures which in turn can reduce populations of soil microorganisms [14]. The combination of toxic metals (such as lead, mercury, zinc and cadmium) may also adversely affect the growth of soil bacteria, algae, fungi and earthworms [14, 15]. The dangers of gas flared products are equivalent to the degree of the pollution, the nature of the immediate environment, and the general use of the soil [16].
The current situation in Nigeria is that oil exploration and production companies have failed to achieved zero gas emission Nigeria’s target of 2008 [7]. However, in line with the Nigeria’s target of flare-free environment, most oil and gas companies as well as refineries began a series of research on how to curb unnecessary gas flaring in Nigeria and monetize natural gas and associated gases in Nigeria’s oil and gas sector [7]. But that target has been difficult to meet and gas flaring on soil resources has not been fully evaluated. This study therefore was instituted to evaluate the effect of gas flaring on the bacterial flora and changes in physicochemical properties of a flared soil in Nigeria.
Materials and Methods
Study Area
The study area is Kolo creek flow station in Ogbia Local Government Area of Bayelsa State. The study area is located within the Niger Delta Region of Southern Nigeria. It is about
25km from the Atlantic Ocean. The study area is bounded in the South by Nembe Local Government Area, in the East and South–East by Rivers State, in the Southwest by Southern Ijaw Local Government Area and in the North by Yenagoa Local Government Area. Longitudinally, the study area is located between longitude 6o10″ West and 6o28″ East of the Green witch meridian. It is dissected by latitude 4o35″ and 5008″ North of Equator. The Kolo creek flow station which houses the gas flaring facility is owned by a leading petroleum exploration and production company, Shell Petroleum Development Company (SPDC), Nigeria. The gas flaring has lasted for over 40 years in the area and the flaring has been continuous for the number of years.
Collection of Soil Samples
Soil samples were collected from the study area along a transect at four sampling distances designated as SD50m, SD100m, SD200m and SD300m away from the flaring site and taken as flare impacted soils, and a control site (>500m) outside flare zone. Surface soil (0-15cm depth) was collected using a clean auger borer. The auger borer was dug into the soil and the bulk soil samples were put into the fresh unused black polythene bags capable of holding the required soil quantity. Two duplicate samples were collected from each sampling distance and control soil for four (4) weeks to give a total of 40 samples analyzed throughout the period of the study. All the soil samples were transported in ice- cooled container to the laboratory for microbiological and physicochemical analysis. Soil samples from flare impacted sampling distances were composited into one as well as control soils and analyzed for physicochemical parameters.
Microbiology of Soil Samples
Soil samples were analyzed for heterotrophic bacteria. Aliquot (0.1ml) of appropriate dilution of each soil sample was spread plated onto the surface of freshly prepared dried sterile nutrient agar media after serial one-tenth stepwise dilution of the soil samples; one gram (1g) in 10ml of normal saline. The inoculated plates were incubated at 37oC for 24-48hours, after which discrete bacterial colonies that developed were enumerated and recorded, and taken as population of bacteria in colony forming unit per gram (CFU/G) soil.
Identification of Bacteria
Pure cultures of bacteria were obtained by sub-culturing discrete colonies, based on their colonial characteristics, onto freshly prepared nutrient agar medium and incubated at 37oC for 24hours. Sterile 10% glycerol solution in Bijoul bottles was used to preserve pure isolates in the refrigerator and used for further characterization procedures [17].
Bacterial isolates were identified based on their colonial/morphological characteristics, and biochemical tests including gram’s reaction, motility, oxidase, catalase, coagulase, indole and citrate tests. Others are starch hydrolyses, methyl Red-Voges-Proskauer, nitrate reduction, oxidation/fermentation, urease and hydrogen sulphide production tests. Reference was made to the identification schemes of Buchanan and Gibbons [18]; Cowan and Steel [19]; Winn, et al. [18, 19, 20] to identify characterized bacteria and the species were confirmed with ABIS online identification tool.
Physicochemistry of Soil Samples
Composite air-dried and ground fine soil samples were used for physicochemical analysis. Parameters determined were: pH, electrical conductivity, available phosphorus, total hydrocarbon content, total organic carbon, total nitrogen and particle size of the soils.
Soil pH was measured in a 1:2.5w/v soil water suspension [21]. The Jenway 4020 pH meter was first standardized by dipping its probe into a buffer solation of pH7. After flushing the probe with distilled water, it was dipped into the beaker of mixture of distilled water and sand, and the pH reading taken. Electrical conductivity (µS/cm) was determined by dipping Jenway 4020 conductivity meter electrode into deionized water soil filtrate. Before the measurement, the electrode was dipped into deionized water to stabilize it.
Available phosphorus was determined using the ascobic acid molybdate (blue color) method described by Bray and Kurtz [22]; Murphy and Riley [23]. Five millimeter (5ml) soil HCl-distilled water extract was made up to 40ml with distilled water and 8ml of reagent was added and mixed thoroughly. After 30mins the absorbance of the solution was read on a spectrophotometer (Spectronic 20) at 882 wavelengths and the amount of phosphorus in the sample was read from the standard curve previously prepared.
Total organic carbon was determined by the wet combustion method of Walkley and Black [24]. One gram (1g) of soil and 10ml of 1N potassium dichromate was mixed to disperse the soil. Sulphuric acid (H2SO4) was gently added using automated pipette while being swirled for one minute. To the rotating beaker of the mixture standing on a sheet of asbestos was added 100ml of distilled water and 4 drops of 0.025M O-phenanthroline-ferrous complex indicator which was titrated with 0.5N ferrous sulphate (FeSO4) solution. Towards the end point, ferrous sulphate was added drop by drop until the colour changed from blue to red. Similarly, a blank was titrated with soil solution to standardize dichromate. Percent total organic carbon in the soil was calculated as follows:
2 2 4 (Mek CrO O-MeFeSO ×0.00 %TOC= 100 Gramof air driedsoil ×
Where correction factor, F = 1.33 Me = normality of solution x ml of solution used. % TOC = %TOC x 1.729.
Total nitrogen was analyzed by the Macro-Kjeldahl’s method of Jackson [25]. Soil samples were digested by first mixing 5g of fine soil and 20ml of distilled water. Then added after 30mins was 1g of potassium sulphate mercuric oxide mixture (K2S04-HgO) catalyst, 10g potassium sulphate (K2SO4) and 30ml conc. sulphuric acid (H2S04) in 500ml macro-kjeldahl flask. The flask was heated at low temperature and the clear liquid produced then boiled until the H2S04 condensed. The flask was allowed to cool and 10ml water slowly added. Five milliliter (5ml) of 2% boric acid (H2BO3) indicator solution was added onto the digest in another macro-kjeldahl flask. The mixture was distilled after adding 150ml of 10N sodium hydroxide (NaOH). After distillation, ammonium-nitrogen (NH4-N) in the distillate was titrated with 0.01N hydrochloric acid until the colour changed from green to pink at the end point. The percent nitrogen was calculated as follows:
T×M×1.4 %N = ×100 Weight of soilused Where T = Titer value, M= Molarity of acid (HCL) Particle size analysis was performed as described by Bouyoucos [26]. Fifty one gram (51g) of air-dried soil sample was placed in a baffled cup which was half-filled with sodium hexametaphosphate reagent and stirred until the sample aggregates were broken down. The suspension was transferred to Bouyoucos cylinder and filled with water while the hydrometer was in suspension.
Sand: Determined amount in soil sample in the hydrometer was removed and the content of the cylinder thoroughly mixed by inverting the cylinder several times, which was then placed on the desk and the time recorded. After 20secs, the hydrometer was carefully inserted and the reading recorded after 40secs. The hydrometer was removed and the temperature of the suspension recorded. Hydrometer reading was corrected by addition and subtraction of unit numbers [26]. Weight of sand = Corrected hydrometer reading - total weight of sample.
Weight of sand %Sand = ×100 Weight of sample Clay weight/amount determination: Sample suspension was re-shaken, the hydrometer inserted and temperature of the suspension taken. After 2 hours, the hydrometer reading was recorded and corrected as in sand.
Weight of clay
$$ \% \mathrm {Clay} = \frac {\mathrm {Weight of clay}}{\mathrm {Sample weight}} \times 100 $$ % Silt =100 - sum of % sand + %clay
Results
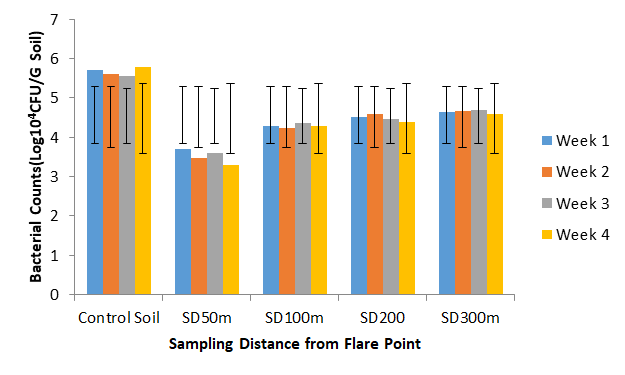
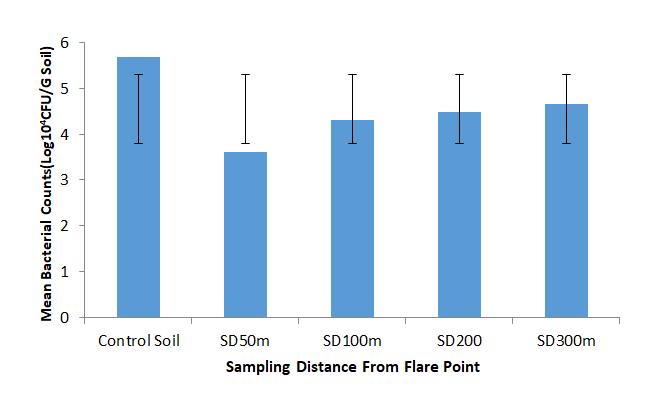
Population of heterotrophic bacteria and the bacterial organisms isolated were used to evaluate the effect of gas flaring on microbial community structure. Counts of heterotopic bacteria of soils at different sampling distances (SD) and control for 4 weeks are shown in Figure 1. Mean counts of bacteria of 4 weeks replicates are presented in Figure 2. The bacterial types isolated during the study are shown in Table 1. Values of the physicochemical parameters of composite soils analyzed during the study are presented in Table 2. Ranges of bacterial counts in control and flare- impacted soils were control 3.7 - 6.2X10⁵CFU/G with mean of 4.8±11.2X10⁵CFU/G; flared soils SD50m 2 – 5X10³CFU/G with mean of 4±0.01X10³CFU/G; SD100m 1.7 - 2.3X10⁴CFU/G with mean of 2.0±0.25X10⁴ CFU/G soil; SD200m 2.5 - 3.8X10⁴CFU/G with mean of 3.1±0.56X10⁴CFU/G, and SD300 3.9 - 5.0X10⁴CFU/G with mean of 4.5±0.47X10⁴CFU/G soil. Twenty five (25) bacterial species in 20 genera were isolated during the study and they include: Acinetobacter(2), Arthrobacter(3), Bacillus(10), Brevibacterium(3), Citrobacter(2), Corynebacterium(5), Cronobacter(3), Enterobacter(6), Escherichia coli(4), Klebsiella(6), Kluyvera(4), Pseudomonas(5), Paenibacillus(10), Pusillimonas(5), Microbacterium(3), Raoultella(4), Rathayibacter(3), Salinicoccus(4) Staphylococcus(3), and Streptococcus(2). Values of physicochemical parameters of control and composited gas flared-impacted soil respectively were pH 5.80 and 5.40, EC 100 and 160(µS/cm), TOC 0.20 and 0.63%, TN 0.01 and 0.02%, Av. P. 8.86 and 6.50mg/kg, sand 67 and 64%, silt 12 and 14%, clay 21 and 22%. Textural class was sandy-clay-loam for control and gas flared-impacted soil samples.
Discussion
Microbial population and diversity were used in this study as a measure of effect of gas flaring on the bacterial community structure in the soil. Changes in the concentrations of some physicochemical parameters of the study soils between unflared/control and gas flared soils were used as a measure of the influence of gas flaring on the physicochemical quality of the soils. Nigeria, like other oil producing countries benefits as well as suffers from the positive and negative effects of crude oil drilling and gas flaring [4, 27]. This study therefore evaluated the changes in microbiological quality and physicochemical properties of soils in the vicinity of gas flaring site of Kolo creek oilfield flow station in order to ascertain the effect of gas flaring on these soil resources.
Counts of bacteria were generally high in control soil, moderate in sampling distances of SD100m, SD200m and SD300m soils, and low in SD50m soils. Weekly fluctuations in the bacterial densities of control and gas flared soils were observed throughout the period of study (Figure 1). Ranges of bacterial counts of soils showed that control soil had the lowest counts in week 3 and highest counts in week 4 while SD50m soil had the lowest counts in week 4 and highest counts in week 1. Sampling distances SD100m soil had lowest bacterial densities in week 2 and highest counts in week 1. For sampling distances SD200m and SD300m soils, bacterial densities were lowest in week 4 and highest in weeks 2 and 3. The weekly fluctuations in the population of bacteria could be attributed to changes in the inherent properties within the soil environment influenced by changes in climatic conditions and possibly with combined effect of gas flaring.
During the study, 4 sampling distances from the flaring site and a control site outside the flared area were considered for collection and analysis of soil samples. Results of the weekly counts of heterotrophic bacteria showed that control soils generally had higher bacterial densities than those of the flared samples in all the weeks. Mean counts of bacteria of the four weeks’ study also revealed that the population of bacteria were higher in control soil than in the gas flare-impacted soils (Figure 2). Hence gas flaring from the Kolo creek oilfield flow station impacted negatively on the population of bacteria in the soil by reducing their numbers when compared to control soil. Furthermore, results of the bacterial densities observed in this study showed that bacterial counts were lowest at the sampling distance (SD50m) in close proximity to the gas flaring site. This increased significantly as the sampling distances increased to SD100m and SD200m with SD300m soil having the highest counts among the flared soils in all the weeks and throughout the study. The results can be explained that the negative impact of gas flaring on soil microbial population decreased with increasing distance from the flare site.
| Bacterial Type | Soil Type Isolated | ||||
|---|---|---|---|---|---|
| Control | SD50m | SD100m | SD200m | SD300m | |
| Acinetobacter species | + | - | - | + | - |
| Arthrobacterspecies | + | - | - | + | + |
| Bacillus alcalophilus | + | + | + | + | + |
| Bacillus species | + | + | + | + | + |
| Brevibacterium pityocampae | + | - | - | + | + |
| Citrobacter freundii | + | - | - | - | + |
| Corynebacterium species | + | + | + | + | + |
| Cronobacter sakazakii | + | - | + | - | + |
| Enterobacter aerugens | + | - | + | + | + |
| Eterobacter cancerogenus | + | - | + | + | + |
| Escherichia coil | + | - | + | + | + |
| Klebsiella oxytoca | + | - | - | + | + |
| Klebsiella pneumonia | + | - | - | + | + |
| Kluyvera ascorbata | + | - | + | + | + |
| Pseudamons xiamenensis | + | + | + | + | + |
| Paenibacillus barcinonensis | + | + | + | + | + |
| Paenibacillus chondroitinus | + | + | + | + | + |
| Pusillimonas soli | + | + | + | + | + |
| Microbacterium liquefaciens | + | - | + | + | - |
| Raoultella planticola | + | - | - | - | + |
| Raoultella lornithinolytica | + | - | - | - | + |
| Rathayibacter rathayi | + | - | - | + | + |
| Salinicoccus roseus | + | + | + | - | + |
| Staphylococcus aureus | + | - | - | + | + |
| Streptococcus species | + | - | - | - | + |
Table 1: Bacterial Types Isolated from Control and Gas Flared Impacted Soils.
Also revealed in this study was the fact that bacterial densities of the farthest and less impacted sampling soil (SD300m) were lower than the control (unflared) samples in all the weeks and throughout the study. This could be explained that the impact of gas flaring extended up to distance of 300m away from the flared site probably because gas has been flared in the area for several years. Charles [14] reported that gas flaring affected microbial populations in various ways, and that soil bacteria vital for agriculture were greatly reduced in proximity to flare site. This was observed in this study in which bacterial population was greatly reduced at SD50m soil in closest proximity to the flared site. However, population of bacteria increased as the proximity away from the flare site increased, and the effect of gas flaring on bacterial species isolated from the sampling distances increased as sampling distance moved away from the flared point. Statistically, there was no significant difference (p<0.005) between the weekly bacterial counts of each soil status but significant difference exists between the counts for control soil and those of the flared soils. This showed that gas flaring had real effect on the counts of soil bacterial in this study.
| Control Soil | Gas Flared Soil | |
|---|---|---|
| pH (1:2.5w/v) | 5.80 | 5.40 |
| Electrical conductivity (μS/cm) | 100 | 160 |
| Total Organic carbon (%) | 0.20 | 0.63 |
| Total Nitrogen (%) | 0.01 | 0.02 |
| Available phosphorus (mg/kg) | 8.86 | 6.50 |
| Sand (%) | 67 | 64 |
| Silt (%) | 12 | 14 |
| Clay (%) | 21 | 22 |
| Textural Class | Sandy-clay-loam | Sandy-clay-loam |
Table 2: Values of Physicochemical Parameters of Control and Flared Soil Samples.
Of the 20 bacterial genera isolated and identified, all occurred in control (unflared) soils. Five (5) genera: Bacillus, Corynebacterium, Pseudomonas, Paenibacillus, and Pusillimonas species were isolated from all the flared soils. Enterobacter, Escherichia coli and Kluyvera species occurred in three of the flared soils and not in SD50m soil. Microbacterium species was isolated from SD100m and SD200m flared soils not from SD300m soil. Arthrobacter, Brevibacterium, Klebsiella, Rathayibacter and Staphylococcus species were isolated from SD200m and SD300m not from SD50m and SD100m flared soils. Salinicoccus occurred in three of the flared soils not in SD200m soil while Acinetobacter was isolated from SD200m flared soil and Citrobacter, Raoultella, and Streptococcus species occurred in SD300m soil only not in the other three flared soils. Cronobacter species occurred in SD100m and SD300m soils not in the other two flared soils. This study revealed that the bacterial species occurred in one or two flared soils and not in the other flared soil, and that gas flaring affected bacterial diversity of the study soil in a significant way. Different bacterial species were inhibited differently by the flare at each sampling distance.
The distribution of number of bacterial species among control soil and gas flared impacted soils showed that eight (8) species of bacteria were isolated at SD50m soil which increased to 14 and 19 species at SD100m and SD 200m soils respectively. The number of bacterial species isolated increased to 23 at SD300m soils. Twenty (25) species were isolated from control soil which was far outside the flared area. Hence, this study showed that certain bacteria such as Bacillus, Corynebacterium, Pseudomonas, Paenibacillus and Pusillimonas species have the capacity to withstand the negative impact of gas flaring and survive at the distance in very close proximity to the flaring site. The reason may be that most of the organisms are spore formers and/or possess enzyme systems that help them to withstand the harsh environmental conditions created by the effect of flaring of hydrocarbon gases. The study also showed that bacterial diversity increased with increase in distance from the flared point. Hence more bacteria were isolated in SD100m soil, SD200m and SD300m soils in increasing order up to the control soil while few bacteria were isolated at SD50m soil.
Results of the study showed that gas flaring affected concentrations of physicochemical parameters in different ways. The pH of the soils tended towards acidity but reduced in flared samples and was higher in control samples. The value of available phosphorus also reduced in flared soil samples when compared with the control soil. On the other hand, values of electrical conductivity, total organic carbon and total nitrogen were higher in flared soil samples than in control soil. In this study, gas flaring increased some physicochemical parameters of soil and decreased the values of others. Charles [14] had reported that gas flaring lowered soil pH, aluminum mobilization and increased temperature which in turn reduced populations of soil microorganisms. In the case of particle size, the value of sand was higher in unflared soil than flared soils while silt and clay values were higher in flared soils than the unflared (control) soil. Based on these values, the textural class of the two soil status was given as sandy-clay-loam. Hence, it can be deduced that gas flaring had little or no effect on the textural class of the soil since the results of the particle size analysis showed that the textural class of unflared and flared soils was sandy-clay-loam. There was no statistical significant difference (p<0.005) between the physicochemical parameters of control soil and those of flared soils.
Previous researchers had stated that gas flared products exert adverse effects on soil properties [12] and microorganisms [13]. Also reported is the fact that gas flaring affects microbial populations in various ways and greatly reduced agriculturally important soil bacteria [14]. Also, the alterations in physicochemical properties of soil due to influence of gas flaring, alters both microbial populations and diversity. One such condition is the acid rain that results due to combination of oxides of nitrogen released by flare and rain water which alters pH of soil towards acidic range [7] and in turn reduced population of soil bacteria vital for agriculture. Furthermore, gas flaring releases toxic metals, which include lead, mercury and zinc. The combination of the toxic metals may also adversely affect the growth of soil microorganisms and reduce their densities [14, 15].
Conclusion
This study has shown that gas flaring from Kolo creek oilfield flow station significantly reduced bacterial population of soils; the impact decreased as the proximity to flare site increased. This was deduced from counts of bacteria obtained during the study which showed that control soils recorded increased densities of bacteria while flare-impacted soils recorded reduced bacterial population. The study revealed that the impact of gas flaring was greatest in soils nearest to the flare site. Sampling distance 50m in close proximity to flared site had the lowest bacterial densities followed by sampling distance 100m and the counts increased gradually to sampling distance 200m and then to 300m. Control soil which is outside the flare zone had highest population of bacteria. The study showed that impact of gas flaring on bacterial densities extended up to 300m sampling distance from the flare site probably due to constant gas flaring for several years.
Generally revealed was the fact that bacterial community structure and diversity were adversely altered by gas flaring in Kolo creek oilfield location. Sampling distance 300m which was farthest from flared site had the highest counts of bacteria but far lower than the counts of bacteria of oilfield location. Least numbers of bacterial organisms were recorded in SD50m soil and the number increased with increasing sampling distance from the flare site with SD300m soil having above ninety percent of the bacteria isolated. All the bacterial species isolated during this study occurred in control soils located far outside the vicinity of the flaring zone. Considering the influence of gas flaring on physicochemical properties of soil, results showed that values of pH, available phosphorus and sand increased in control soil and decreased in flared soils showing negative impact of the flare. Values of Electrical conductivity, total organic carbon, total nitrogen, silt and clay increased in flared soils and decreased in control (unflared) soil showing positive influence of gas flaring. Particle size results put the textural class of both control and flared soil as sandy-clay- loam. Gas flaring did not alter the textural class of the soils.
In conclusion, gas flaring in Kolo creek oilfield location had negative impact on bacterial population and diversity by significantly reducing their numbers and altering the community structure in significant ways. Furthermore, this study showed that gas flaring had both negative and positive impact on soil physicochemical properties decreasing some parameters and increasing others when compared to the control (unflared) soils but their concentrations were within permissible ranges for a good quality soil.
References
-
Obire O, Wemedo SA (1996) The Effect of Oilfield Wastewater on the Microbial Population of a Soil in Nigeria. Niger Delta Biologia 1(1): 77-85.
-
Wills J (2000) A Survey of Offshore Oilfield Drilling Waters and Disposal Techniques to Reduce the Ecological Impact of Sea Dumping Sakhalin. Environment Watch 13: 23-29.
-
Zara K, Paul V (2001) Water Management in Shell Water to Value Team. Exploration and Publication Newsletters (EPNL) SPDC 7028: 4-6.
-
Adeniye EO, Olu-Sule R, Anyaye A (1983) Environment and Socio-Economic Impacts of Oil Spillage in the Petroleum Production of Riverrine Area in Nigeria: The Petroleum Industry and the Nigerian Environment. Proceedings of 1983 International Oil Seminar NNPC 3: 130-35.
-
Bailey W, Crabree M, Tyrie J, Elphick J, Kuchuk F, et al. (2000) Water Control, Oilfield Review: Shell International Exploration and Production Newsletter 70: 17-19.
-
Environment Watch (2006) 2(60): 1119-2739.
-
Chuks IO, Nwanna BO (2001) Modern Text in History and Philosophy of Science. Crystal Publishers, Owerri, Imo State, pp: 154-195.
-
Eman AE (2015) Gas Flaring in Industry: An Overview. Petroleum and Coal 57(5): 532-555.
-
Isiam KR, Wright SR (2003) Microbial Communities, Encyclopedia of Soil Science, pp: 1-6.
-
Brock TD, Machigam MT (1991) Biology of Microorganisms. 6th (Edn.), Prentice-Hall, New Jersey.
-
Marshall TR and Devinny JS (1988) Biochemical Reactions carried out on Bacterial isolates: The Microbial Ecosystems in Petroleum Wasteland Treatment. Wat Sci Tech 20(11-12): 285-291.
-
Rowell MJ (1977) In: Too good, JA (Eds.), Reclamation of Agricultural Soil after Oil Spills, Part 1 Research. AIP Publication, pp: 1-27.
-
Odu CTI (1972) Microbiology of Soils Contaminated with Petroleum Hydrocarbons. Extent of Contamination and some Soil and Microbial Properties after Contamination. Journal of Institute of Petroleum 58: 201-208.
-
Charles EO (2003) Virtual Chemistry Book, Elmhurst College.
-
Campbell WB, Harris RW, Beneoit RE (1993) Response of Alaskan Tundra Microflora to Crude Oil Spill. Proceedings of the Symposium on the Impact of Oil Resources Development on Northern Plant Communities. Inst. Arctic. Biology, University of Alaska, Farbanks. Occas Publs 1: 53-62.
-
Jones JG (1977) The Long-Term Effects of Kerosene Pollution on the Microflora of Moorland Soil. Journal of Applied Bacteriology 43(1): 123-128.
-
Wellington EMH, Williams ST (1978) Preservation of _Actinomyces_ inoculum in frozen glycerol. Microbiological Letters 6(23-24): 151-157.
-
Buchanan RE, Gibbons NE (1974) Bergey’s Manual of Determinative Bacteriology. 8th (Edn.), The Williams and Wilkins Company, Baltimore.
-
Cowan ST, Steel KJ (1976) Manual for the Identification of Medical Bacteria. 3rd (Edn.), Cambridge University Press, London.
-
Winn WC, Allen SD, Janda WM, Koneman EW, Procop GW, et al. (2006) Koneman’s Color Atlas and Textbook of Diagnostic Microbiology, 6th (Edn), Lippincott Williams and Wilkins, Baltimore.
-
Flowers TH, Pulford ID, Duncan HJ (1984) Studies on the Breakdown of Oil in Soil. Environmental Pollution (Ser. B) chemical & physical 8(1): 71-82.
-
Bray RH, Kurtz LT (1945) Determination of Total Organic and Available Forms of Phosphorus in Soils. Soil Science 59(1): 39-46.
-
Murphy J, Riley JP (1962) A modified Single Solution Method for the Determination of Phosphorus in Natural Waters. Analytica Chimica Acta 27: 31-36.
-
Walkley A, Black IA (1917) A Critical Examination of a Rapid Method for Determining Organic Carbon in Soils. Effect of Variation in Digestion Conditions and on Inorganic Soil Constituents. Soil Science 63(4): 251-264.
-
Jackson ML (1962) Soil Chemical Analysis, Prentice Hall, New York.
-
Bouyoucos GH (1951) A Recalibration of the Hydrometer for Making Mechanical Analysis of Soils. Agronomy Journal 43(9): 434-438.
-
Awobajo AS (1981) An Analysis of Oil Spill Incidents in Nigeria 1976-1980. The Petroleum Industry and the Nigerian Environment. Proceedings of 1981 International Oil Seminar NNPC 2: 124-129.
- Antifungal Activity of New Acetophenone Derivatives
- Interconnected Microbiomes Human Health Within an Environmental Framework
- Silkworm-Based Vaccine Production for H5N1: A One Health Approach to Pandemic Preparedness
- Microbial Diversity and Lipolytic Activity of Bacteria and Fungi from Oil-Contaminated Sites in Makurdi Metroplois
- Antibiotic Resistance Profile of Bacteria Isolated at the Central Laboratory of the National Hospital Center of Nouakchott
- Epidemiology and Sensitivity to Antibiotics of Germs Isolated from Blood Cultures in the Laboratory of the National Hospital Center of Nouakchott-Mauritania