Stability Indicating Method Development and Validation of Selexipag in Bulk and Pharmaceutical Dosage form by using RP-HPLC
A simple, efficient, precise, accurate & stable method has been developed and validated for determination of Selexipag in pharmaceutical tablet dosage form. An efficient high performance liquid chromatographic method was developed for Selexipag. The HPLC method was developed by using Symmetry C18 column; (150×4.6×5µ) column at 281nm, flow rate of 0.6ml/min., Injection volume of 20µl, column oven temperature of 25°C using equal volume of Methanol and Water used as mobile phase (50:50v/v). The retention times were found to be 2.682mins. The % purity was found to be 99.9 w/w. The analytical method was validated according to ICH guidelines (ICH, Q2 (R1)). The correlation coefficient (r2) was found to be 0.999%, recovery was 100.0%, %RSD for precision was found to be 0.2. The HPLC method was found to be accurate, precise, economical and reproducible. The method can be suggested for routine analysis and method can be recommended for determination of substance related, relative substance of Selexipag in pharmaceutical dosage form.
Introduction
High Performance Liquid Chromatography
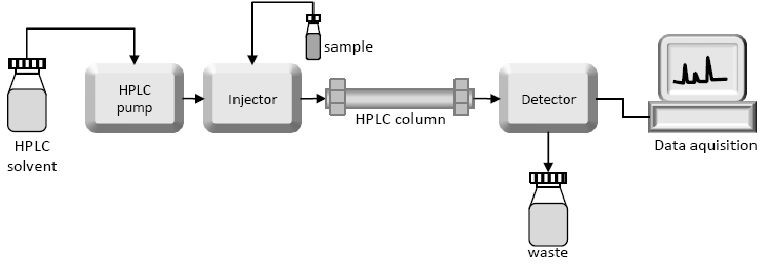
HPLC is a form of liquid chromatography used to separate compounds that are dissolved in solution. HPLC instruments consist of a reservoir of mobile phase, a pump, an injector, a separation column, and a detector.
Compounds are separated by injecting a sample mixture onto the column. The different component in the mixture pass through the column at differentiates due to differences in their partition behavior between the mobile phase and the stationary phase [1, 2].
High performance liquid chromatography (HPLC) is basically a highly improved form of column liquid chromatography. Instead of a solvent being allowed to drip through a column under gravity, it is forced through under high pressures of up to 400 atmospheres. That makes it much faster.
All chromatographic separations, including HPLC operate under the same basic principle; separation of a sample into its constituent parts because of the difference in the relative affinities of different molecules for the mobile phase and the stationary phase used in the separation. Types of HPLC In general there are five techniques of HPLC. They are as follows:
1. Based on Polarity
Normal Phase HPLC: NP-HPLC uses polar stationary phase and non-polar mobile phase. Reverse Phase HPPLC: The stationary phase is nonpolar (hydrophobic), while the mobile phase is a polar.
2. Based on principle of separation
- Adsorption chromatography
- Ion exchange chromatography
- Ion pair chromatography
- Size exclusion chromatography
- Chiral chromatography 3. Based on Elution technique
- Isocratic
- Gradient 4. Based on scale of preparation
- Analytical HPLC
- Preparative HPLC 5. Based on type of analysis
- Qualitative
- Quantitative.
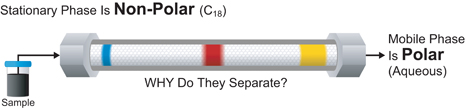
Reversed Phase Chromatography
In 1960s, chromatographers started customizing the polar nature of the silanol group by chemically responding silicon with organic silanes. The object was to make silica much less polar or non-polar so that polar solvents will be used to divide water-soluble polar substances. Because the ionic nature of the chemically customized silica in now turned around i.e., it is non-polar or the nature of the stage is returned, the chromatographic split up carried out with such silica is described as reversed-phase chromatography. For numerous purposes, reversed phase fluid chromatography (RPLC) is considered to be the tool of choice for the study of pharmaceutical substances, such as its compatibility with aqueous and natural solutions along with various detection systems and its high accuracy and repeatability.
Whether in the pharmaceutical or bio-analytical field, sensitive as well as precise RPLC analysis requires the use of stationary phases which offer proportional and reliable peaks. As a result, fixed stage suppliers are continually improving and offering new RPLC goods as well as high options for various forms of reversed fixed phase stages. The criteria for continuity as well as the globalization of the pharmaceutical industry demand that the strategies can definitely be moved from website to website, using either the same brand names or their matches. The fixed phase in the Turned around Stage chromatographic columns is a hydrophobic assistance that is consisted mainly of permeable particles of silica gel in various forms (spherical or irregular) at different diameters (1.7, 3, 6, 7, 10 µm etc.) at various pore dimensions (such as 50, 100, 120, 300). The surface area of these particles is covered with various chemical entities, such as numerous hydrocarbons (C1, C6, C4, C8, C18, etc). In many techniques utilized currently to separate medical materials, C18 columns are utilized, which often are called ODS (octedecylsilane) or RP-18. A polar solvent is made use of as mobile phase. The criteria that govern the retention backwards Stage systems are the following: A. The chemical nature of the fixed stage surface area. B. The sort of solvents that compose the mobile stage C. pH as well as ionic strength of the mobile phase
Normal Phase Chromatography
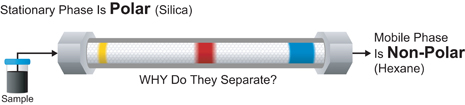
The mobile phase is the polar adsorbent in normal stage chromatography. A mixture of non-aqueous solvents is usually the mobile step. In standard stage separations, the silica structure is filled with the silanol team at the end.
These OH teams are statistically dispersed over the entire of the surface area. Thesilanol groups represent the energetic websites (extremely polar) in the stationary phase. This forms a weak bond with lots of particles in the vicinity when any one of the following interactions exist. Dipole- induced dipole, dipole-dipole, hydrogen bonding,-complex bonding. These circumstances occur when the particle has one or numerous atoms with single set electrons or a dual bond.
The adsorption toughness as well as for this reason ‘K’ value (elution series) rise in the complying with order. Saturated hydrocarbon < olefins < aromatic < natural < halogen substances <sulphides< ethers < esters < aldehydes and also ketones < amines <sulphones< amides < carboxylic acids. The stamina of communications depends not only on the practical groups in the sample particle yet also on stearic aspects. If a molecule has numerous useful groups, then one of the most polar one determines the reaction buildings.
Chemically customized silica, such as aminopropyl, cyanopropyl as well as diol stages are the stationary stages alternate to silica gel in typical phase chromatography. The aminopropyl and also cyanopropyl stages offer opportunities for particular communications in between the analyte as well as the stationary phase and therefore supply extra alternatives for the optimizations of splittings up.
| Proprietors | Normal Phase | Reversed Phase |
|---|---|---|
| Polarity of Stationary Phase | High | Low |
| Polarity of mobile Phase | Low to medium | Low to high |
| Sample elution order | Leader polar First | Most polar First |
| Retention will increase by | Increasing surface of stationary phase Increasing of n-alkyl chain length of stationary phase. Decreasing polarity of mobile phase Increasing polarity of sample | Increasing surface of stationary phase. Increasing polarity of mobile phase Decreasing polarity of sample molecules |
Table1: Showing the comparison of NP-HPLC and RP-HPLC adsorption Chromatography.
The fixed phase is an adsorbent (like silica gel or any other packaging based on silica) and the separation is based on duplicated steps of adsorption-desorption. Instrumentation of HPLC The specific components HPLC and their working roles are reported below [3].
- Mobile phase and reservoir
- Solvent degassing system
- Pump
- Injector
- Column
- Detector
- Data system
Principle involved in HPLC
HPLC principle is based on both Adsorption as well as Partition, depending upon the nature of stationary phase. If stationary phase is solid then it is adsorption and if stationary phase is liquid then it is partition. When a mixture of components is introduced into a HPLC Column, they travel according to their relative affinities towards the stationary phase. The component which has more affinity towards the adsorbent, travels slower. The component which has less affinity towards the stationary phase travels faster. Since no two components have the same affinity towards the stationary phase, the components are separated.
Materials And Methods
Determination of absorption maxima by UV/ Visible Spectroscopy
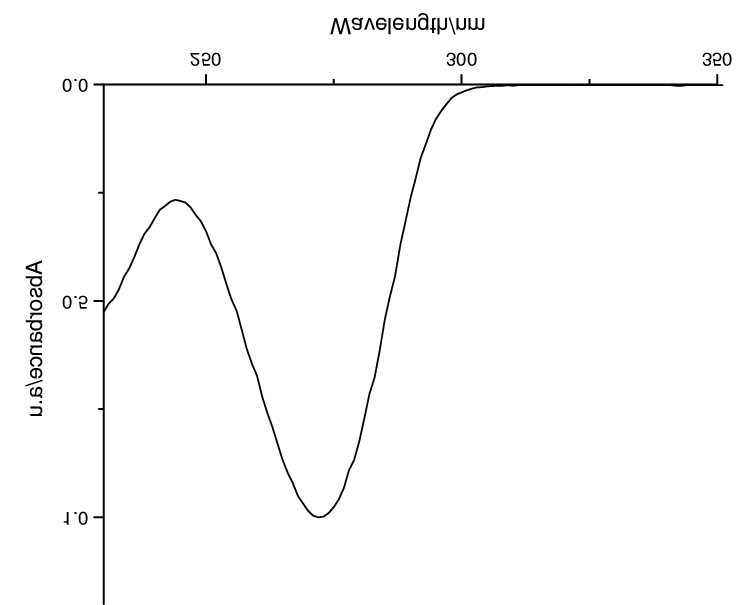
Precisely 50 mg of Selexipag was soaked up right into a 100 ml volumetric flask, and additionally 2 ml of methanol was added as well as sonicated for 2 mins to liquify in addition to watered down approximately the mark with Milli-Q water and also blended well. 1 ml of the above service was absorbed a 10 ml volumetric flask along with the volume was adjusted to 10 ml with water as well as combined well. (Focus of Selexipag is about 100µg/ ml). The resulting treatment was signed in the range of 200 nm to 400 nm [4, 5, 6, 7, 8, 9]. From range 281 nm was selected as discovery wavelength. At this wavelength Selexipag showed great absorbance and also spectrum is displayed in Figure 14.
Preparation of Standard Solution
Properly 50 mg of Selexipag is taken right into a 100 ml volumetric flask, as well as 2 ml of methanol was added and sonicated for 2minutes to dissolve and watered down to the mark with Milli-Q water and mixed well. 1 ml of the above solution was added a 10 ml volumetric flask and the volume was adjusted to 10 ml with water as well as mixed well. (Concentration of Selexipag has to do with 5-30 µg/ ml).
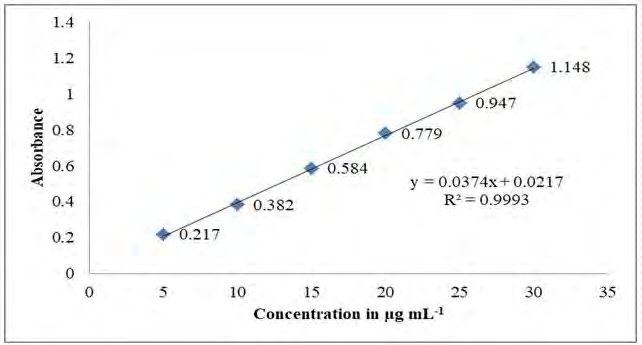
The resulting option was scanned in the range of 281nm. The mean value represents the point present on the calibration curve in the below figure y = 0.0374x + 0.0217 was the linear regression equation. The correlation coefficient was greater than 0.999 [10, 11].
Preparation Of Calibration Curve
Working solution was prepared from stock solution and a concentration range 5, 10 15, 20, 25, 30 μg/ml, respectively. These solutions were scanned from the range 301nm and calibration curve was obtained between concentrations of 5-30 μg/ml.
| Concentration | Absorbance |
|---|---|
| 5 | 0.217 |
| 10 | 0.382 |
| 15 | 0.584 |
| 20 | 0.779 |
| 25 | 0.947 |
| 30 | 1.148 |
Table 2: Showing the Absorbance obtained in the calibration curve.
Trials
Trial – 1 Chromatographic Conditions Stationary phase : Seas C18 column (100 mm x 4.6 mm i.d, 5µm). Mobile phase : Methanol: Water (70:30 v/v). Flow rate : 0.6 ml/ minute. Detector wavelength : 281 nm. Column temperature : Ambient. Injection quantity : 20 µl
Observation: Fronting and Tailing of the peaks was reported.
Trial – 2 Chromatographic Conditions Stationary phase : C18 column (100 mm x 4.6 mm i.d, 5µm). Mobile phase : Phosphate buffer pH 4.6: Methanol (50:50 v/v) Flow rate : 0.7 ml/ minute. Detector wavelength : 281 nm. Column temperature : Ambient. Injection quantity : 20 µl
Observation: Fronting and Tailing of the peaks was reported, so another trail was performed.
Trial – 3 Chromatographic Conditions Stationary phase : C18 column (100 mm x 4.6 mm i.d, 5µm). Mobile phase : Methanol: Water (40:60 v/v) Flow rate : 0.7 ml/ minute. Detector wavelength : 281 nm. Column temperature : Ambient. Injection quantity : 20 µl
Observation: Fronting and Tailing of the peaks was reported, so another trail was performed.
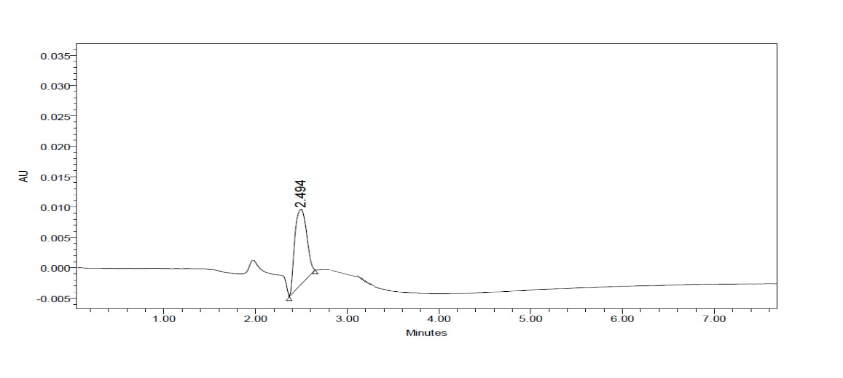
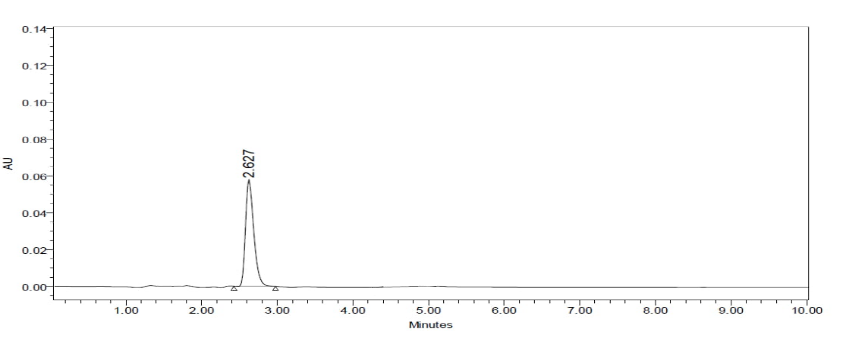
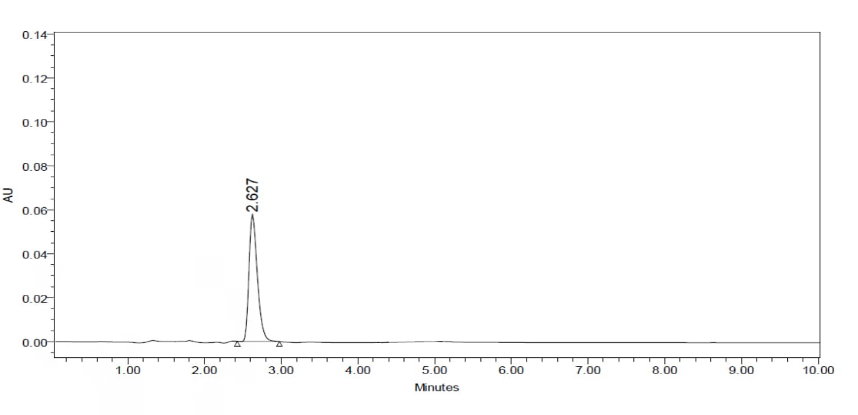
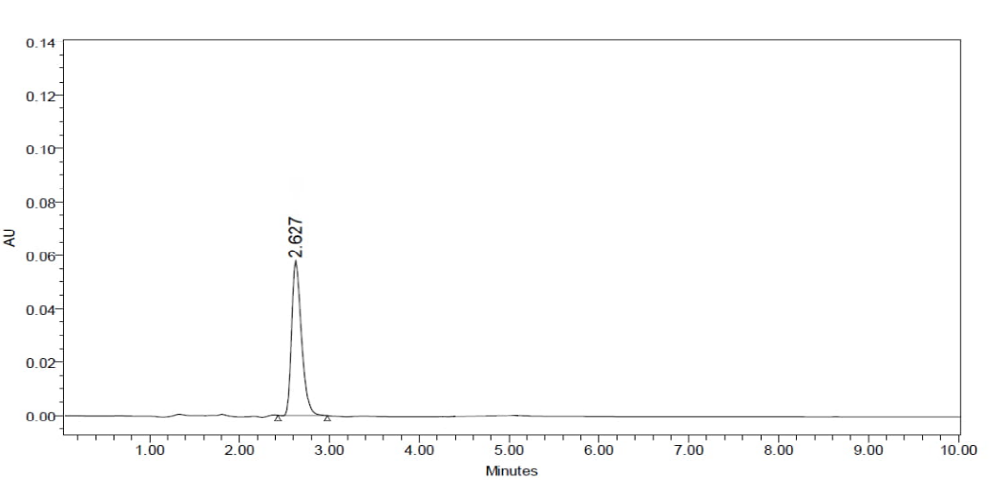
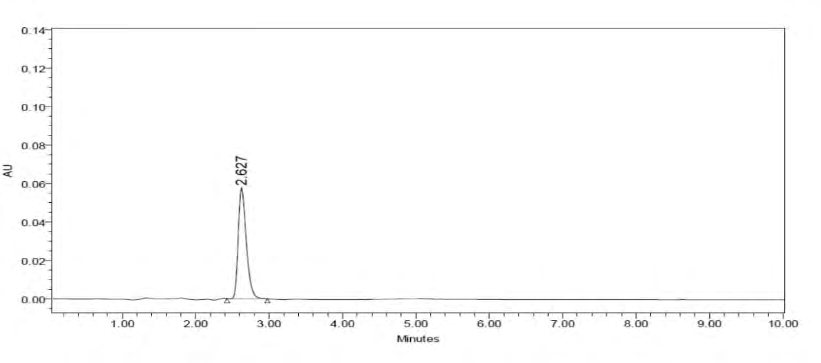
Trial – 4 (Optimized Method) Chromatographic Conditions Stationary phase : C18 column (100 mm x 4.6 mm i.d, 5µm). Mobile phase : Methanol: Water (50:50 v/v) Flow rate : 1.0 ml/ minute. Detector wavelength : 281 nm. Column temperature : Ambient. Injection quantity : 20 µl
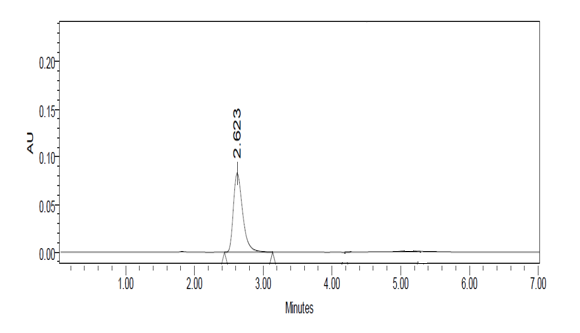
Observation: Sharp peak is observed. Retention is found to be 2.627.
Preparative Measures For Assay Method Development
Preparation of Solutions
Preparation of mobile phase: Mix a blend of HPLC Grade Water 500 ml (50%), 500 ml of Methanol HPLC (50%) and degas in ultrasonic water bath for 5 minutes. Filter through 0.45 microfilter under vacuum cleaner filtration. Diluent Preparation: Use the mobile phase as diluents. Preparation of the Selexipag Standard Solution Preparation: Accurately weigh 10 mg of Selexipag functioning standard into a 10ml in a tidy dry volumetric flask add accurately 7ml of Diluent and sonicate to dissolve it completely as well as make volume as much as the mark with the same solvent. Stock solution: Add 0.3 ml of the above stock into a 10ml volumetric flask and fill up to the mark with diluent.
Sample Solution Preparation
Accurately weigh and transfer 50 mg of Selexipag sample into a 100ml clean fully dry volumetric flask include about 70ml of Diluent and sonicate to dissolve it totally and make quantity as much as the mark with the exact same solvent.
Stock solution
Pipette out 0.1 ml of Selexipag of the above supply remedy right into a 10 ml volumetric flask and dilute up to the mark with diluent.
Procedure
Infuse 20ml of the required sample into the chromatographic system and determine the area for Selexipag optimal and determine the % Assay by utilizing the formulae. %ASSAY = Sample area Wt. of standard Dilution of sample Purity Weight of tablet ×100 Std. area Dil. of standard Wt. of sample 100 Label claim
Assay
Selexipag is discovered to be soluble in methanol and water. The compound was dissolved in water to get concentration of 100µg/ ml and the resulting remedy was checked under UV area. For this reason, 281nm was found maximum absorbance and the discovery wavelength for the suggested approach. In HPLC technique, the method was optimized to get an appropriate elution of compounds. Originally, various mobile phase make-ups were attempted to separate the labelled components.
The system with mobile phase of Methanol: Water in the proportion of 50:50(v/v) as well as a circulation rate of 1.0 ml/ minutes was located to be durable. The optimal wavelength for discovery was 281 nm as well as a run time of 7 minutes at which better detection was obtained. The standard chromatograms were considered the recommended approach and different system suitable specification.
The verified HPLC approach was utilized for the decision of Selexipag in solid dose form. In the assay experiment seven examples were evaluated independently and also analyzed. The mean assay results expressed as a percent of the label claim. The outcomes indicate that the quantity of each drug in the tablet computers is within the requirements of 90- 110% of the label claim.


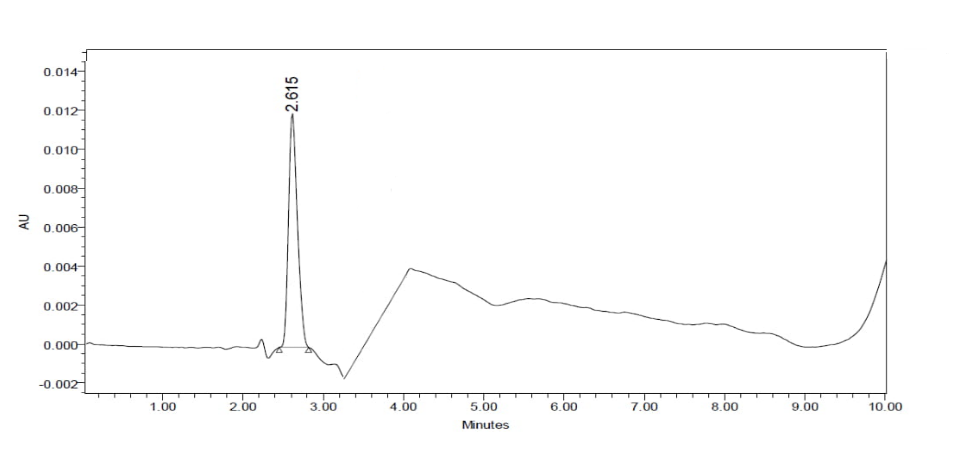
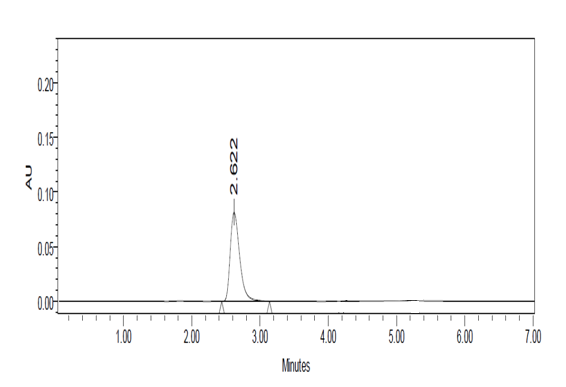
| S.no | Peak Name | RT | Area | Height |
|---|---|---|---|---|
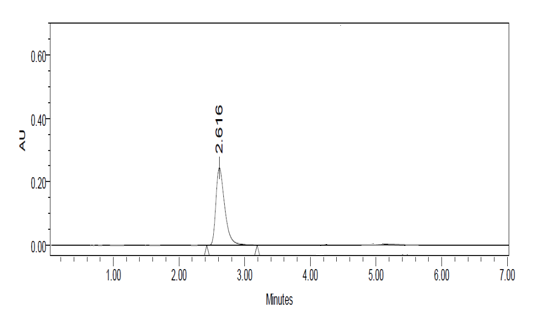
| 1 | Selexipag | 2.615 | 6008963 | 163883 |
Table 3: Showing the Area under the curve for the Assay.
| Selexipag | Observations |
|---|---|
| Standard area | 6008963 |
| Sample area | 6014491 |
| Standard wt. | 20mg |
| Sample wt. | 1442mg |
| Avg wt. | 1442mg |
| %purity | 99.9 |
Table 4: Showing the observations for the Assay.
Retention time was reported to be 2.6 min and the percentage purity of the Selexipag was reported to be 99.9 % w/w.
System Suitability
To check the reproducibility of a chromatographic system, system suitability tests are used. System suitability tests on freshly prepared standard solutions were performed to assess their effectiveness.
| Parameter | Selexipag | Acceptance criteria | |
|---|---|---|---|
| 1 | % Relative standard deviation | 0.1 | Should not be more than 2.0% |
| 2 | Tailing factor for analyte peak in standard solution | 1.4 | Should not be more than 2.0 |
| 3 | Plate count for analyte peak in standard solution | 2684.8 | Should be not less than 2000 |
Table 5: Showing the System suitability values for Selexipag.
Specificity
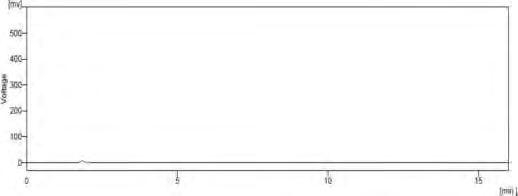
The specificity of the method was defined by the non- interference of the null, internal and mobile phases of the standard. The process demonstrated excellent specificity. Based on these chromatograms, we may tell that blank interference is not present.
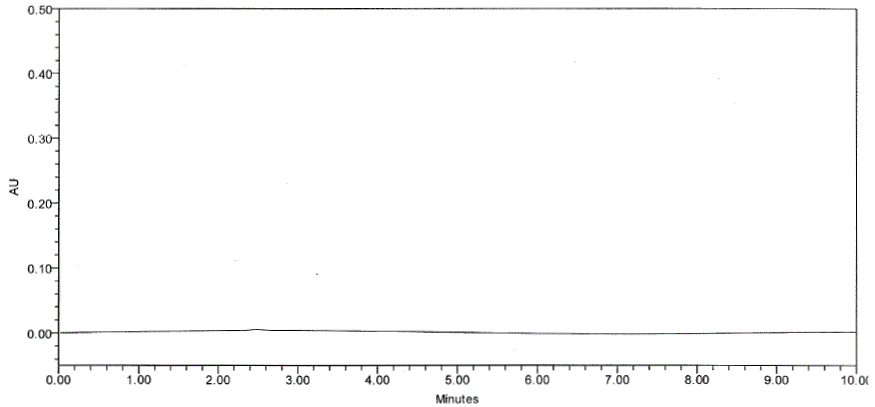
The specificity analysis for the blank was carried out and the chromatograms indicate that there is no interference in the analyte’s retention time.
Linearity
Linearity of an analytical method can be explained as its capability to show results that are directly proportional to the concentration of the analyte in the sample.
| Linearity level | Volume of stock solution(ml) | Diluted to(ml) | Linearity conc. (μg/ml) of Selexipag |
|---|---|---|---|
| 1 | 0.1 | 10 | 10 |
| 2 | 0.2 | 10 | 20 |
| 3 | 0.3 | 10 | 30 |
| 4 | 0.4 | 10 | 40 |
| 5 | 0.5 | 10 | 50 |
Table 7: Showing the observations for the Linearity.
Procedure
The linearity of the technique was demonstrated over the concentration range of 10-50µg/ ml. Aliquots of 0.1, 0.2, 0.3, 0.4, 0.5 µg/ ml was prepared from example remedy. Each level remedy was injected into chromatographic system as well as the peak area was determined. A chart of peak location versus focus (on X-axis concentration and also on Y-axis Peak location) was outlined and the relationship coefficient was calculated.
Acceptance Criteria
Regression coefficient need to not be less than 0.999.
| Concentration μg / ml | Response |
|---|---|
| 10 | 543883 |
| 20 | 1082795 |
| 30 | 1540742 |
| 40 | 2044051 |
| 50 | 2524015 |
Table7: Showing the observations for the response of Selexipag at various concentrations.

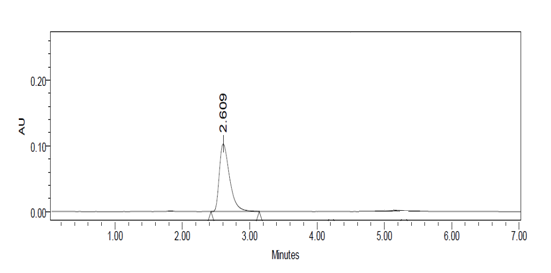
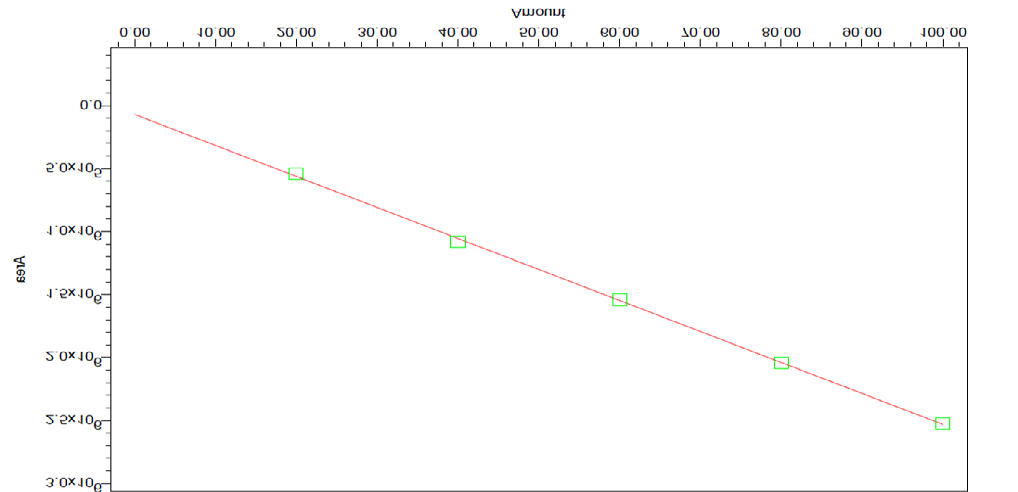
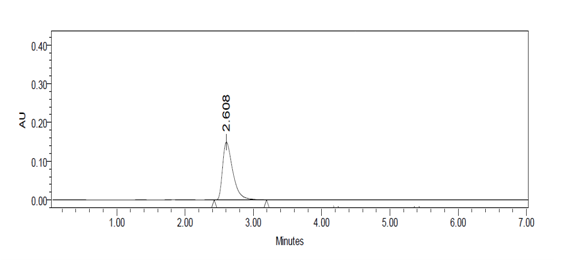
Figure17: Chromatogram for Linearity Level – 4.
Acceptance Criteria
Regression co-efficient need to not be less than 0.999. The regression coefficient was found to be 0.999 which is within the limits.
Accuracy
The accuracy of an analytical method is the degree of agreement of test results generated by the method to the true value.
Determination
Accuracy is executed in 3 various levels of Selexipag. Spiked the amount of Selexipag at 50%, 100%, and 150% level into the placebo. Analyzed examples in three for each level. From the results, % recuperation was determined.
Preparation of Standard stock solution
Accurately weigh and transfer 10 mg of Selexipag working standard into a 10ml tidy completely dry volumetric flask add concerning 7 ml of Diluent and sonicate to dissolve it totally and make volume as much as the mark with the same solvent.
Stock Solution
Further pipette 0.3 ml of Selexipag of the above supply service right into a 10ml volumetric flask and thin down up to the mark with diluents.
For preparation of 50% solution (Relative to target Assay concentration)
Preparation of Standard stock solution: Accurately weigh and transfer 0.5ml of Selexipag working standard into a 10ml
tidy completely dry volumetric flask add concerning 7ml of Diluent and sonicate to dissolve it totally and make volume as much as the mark with the same solvent.
For preparation of 100% solution (Relative to target Assay concentration)
Preparation of Standard stock solution: Accurately weigh and transfer 1ml of Selexipag working standard into a 10ml tidy completely dry volumetric flask add concerning 7 ml of Diluent and sonicate to dissolve it totally and make volume as much as the mark with the same solvent.
For preparation of 150% solution (Relative to target Assay concentration)
Preparation of Standard stock solution: Accurately weigh and transfer 1.5ml of Selexipag working standard into a 10ml tidy completely dry volumetric flask add concerning 7ml of Diluent and sonicate to dissolve it totally and make volume as much as the mark with the same solvent.
Procedure
Infuse the common solution, Accuracy-50%, Accuracy -100% and Accuracy-150% solutions. Compute the Quantity found as well as Quantity added for Selexipag and also compute the recuperation and imply healing worth and recovery research information for Selexipag are tabulated.
Acceptance Criteria
% Recuperation at each spike level will be not less than 98.0 and not greater than 102.0%.
Level 1 (50%)
Level 2 (100%)


Level 3 (150%)


| Injection sample | Conc.(µg) | Area 1 | Area 2 | Area 3 | Avg. area |
|---|---|---|---|---|---|
| Selexipag | 50% | 3202.879 | 3193.192 | 3213.687 | 3203.252 |
| 100% | 5994.595 | 6016.317 | 6008.074 | 6006.328 | |
| 150% | 8744.326 | 8742.155 | 8736.633 | 8741.038 |
Table 8: Showing the Peak results for Accuracy of Selexipag.
| Drug | Conc. of sample(mg) | Avg area | %recovery | Mean % Recovery |
|---|---|---|---|---|
| Selexipag | 50% | 3203.253 | 101.7% | 100.0% |
| 100% | 6006.329 | 100.9% | ||
| 150% | 8741.038 | 98.1% |
Table 9: Showing the Percentage recovery for Accuracy of Selexipag.
Acceptance criteria
The percentage recovery of Selexipag was reported to be 100% (NLT-98% & NMT-102%).
Precision
It is the degree of agreement among individual test results when the procedure is applied repeatedly to multiple samplings. Precision is measured by injecting a series of standards or analyzing series of samples from multiple samplings from a homogeneous lot.
Preparation of Standard stock solution
Accurately weigh and transfer 10 mg of Selexipag working standard into a 10ml tidy completely dry volumetric flask add concerning 7 ml of Diluent and sonicate to dissolve it totally and make volume as much as the mark with the same solvent. Later transfer 3ml from above solution and make up to 10ml with same diluent.
Procedure
The standard solution was infused for 5 times and determined the area for all five shots in HPLC. The % RSD for the location of five replicate shots was located to be within the defined restrictions.
Acceptance Criteria
The % RSD for area of five conventional shots results should not be greater than 2%.
| S. No. | Retention Time | Area |
|---|---|---|
| 1 | 2.616 | 1547.033 |
| 2 | 2.619 | 1545.256 |
| 3 | 2.619 | 1548.422 |
| 4 | 2.620 | 1549.235 |
| 5 | 2.621 | 1541.013 |
| Mean | - | 1546191.9 |
| SD | - | 3265.0 |
| %RSD | - | 0.2 |
Table 11: Showing the AUC for precision of Selexipag.
Acceptance Criteria
The % RSD for area of five conventional shots was found to be 0.2% (NMT 2%).
Intermediate Precision
It is the variation within the laboratory such as different days, i.e. Intraday and Inter day, different laboratories etc.
Preparation of Standard stock solution
Accurately weigh and transfer 10 mg of Selexipag working standard into a 10ml tidy completely dry volumetric flask add concerning 7 ml of Diluent and sonicate to dissolve it totally and make volume as much as the mark with the same solvent. Later transfer 3ml from above solution and make up to 10ml with same diluent.
Procedure
The standard solution was infused for 5 times and determined the area for all five shots in HPLC. The % RSD for the location of five replicate shots was located to be within the defined restrictions.
Acceptance Criteria
The % RSD for area of five conventional shots results should not be greater than 2%.
Intermediate Precision/ Ruggedness
Using different columns of the same scale, the intermediate precision analysis was performed on different days. Each normal injection in the chromatographic system has been injected. For the percent RSD measurement, the area of each standard injection was used.
| Parameter | Selexipag |
|---|---|
| Precision (%RSD) | 0.2 |
| Intermediate precision (%RSD) | 0.2 |
| 2.616 | 1547.033 |
| 2.619 | 1545.256 |
Table 10: Showing the Values obtained for precision & Intermediate precision of Selexipag.
The precision study was conducted and the percentage RSD of Selexipag was reported to be 0.2 and 0.2 (Intermediate precision).
Limit Of Detection
LOD is defined as the lowest amount of analyte in the sample that can be detected.
Preparation of Standard stock solution
Accurately weigh and transfer 10 mg of Selexipag working standard into a 10ml tidy completely dry volumetric flask add concerning 7ml of Diluent and sonicate to dissolve it totally and make volume as much as the mark with the same solvent. Later transfer 3ml from above solution and make up to 10ml with same diluent.
Preparation of 0.02µg/ml solution
Pipette 1ml of the above solution into a 10ml volumetric flask and thin down approximately the mark with diluent. Additional pipette out 1ml of the above supply option into a 10ml volumetric flask as well as dilute as much as the mark with diluent. Pipette 0.2 ml of service into a 10 ml of volumetric flask and water down as much as the mark with diluent.
Acceptance Criteria
S/N Proportion value will be 3 for LOD.
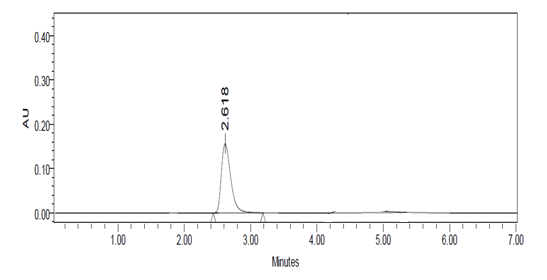
| S.No. | Peak Name | RT | Area | Height |
|---|---|---|---|---|
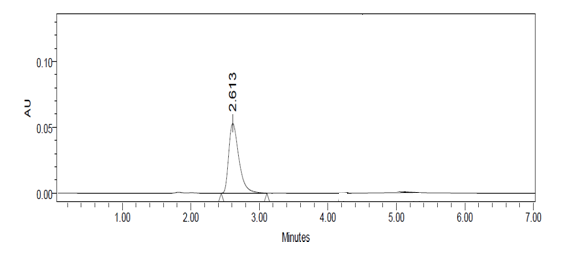
| 1 | Selexipag | 2.613 | 1295 | 127 |
Table 14: Showing the Peak results for LOD for Selexipag.
Limit Of Quantification
LOQ is defined as the lowest amount of analyte in the sample that can be quantitatively determined.
Preparation of Standard stock solution
Accurately weigh and transfer 10 mg of Selexipag working standard into a 10ml tidy completely dry volumetric flask add concerning 7ml of Diluent and sonicate to dissolve it totally and make volume as much as the mark with the same solvent. Later transfer 3ml from above solution and make up to 10ml with same diluent.
Preparation of 0.08µg/ml solution
Pipette 1ml of the above solution into a 10ml volumetric flask and thin down approximately the mark with diluent. Additional pipette out 1ml of the above supply option into a 10ml volumetric flask as well as dilute as much as the mark with diluent. Pipette 0.8 ml of service into a 10 ml of volumetric flask and water down as much as the mark with diluent.
Acceptance Criteria
S/N Proportion value will be 10 for LOQ.

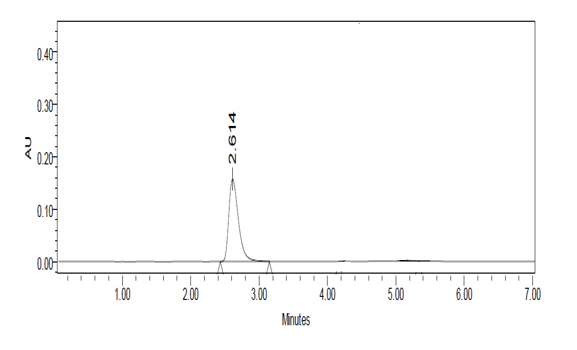
| S.No. | Peak Name | RT | Area | Height |
|---|---|---|---|---|
| 1 | Selexipag | 2.616 | 4365 | 428 |
Table 12: Showing the Peak results for LOQ for Selexipag.
| Validation parameter | Results |
|---|---|
| Retention time (Minutes) | 2.627 |
| Accuracy (% Recovery) | 100% |
| Linearity and Range | 10 μg/ml-50 μg/ml |
| Regression coefficient (r²) | 0.999 |
| Limit of Detection By equation method | 0.102 μg/mL |
| Limit of Quantification By equation method | 0.309 μg/mL |
| Precision Repeatability | 0.2% |
| Intermediate precision Intraday Precision | 0.2% |
| Assay | 99.9% |
| System suitability | Meets the System Suitability Criteria |
Table 13: Consolidated results of all the Validation parameters for Selexipag.
Stability Studies
Acid Degradation
Degradation of drug sample is carried out by acid stress agents in which 1 ml of drug stock solution and 2 ml of 0.1 N HCl solution mixed in 10 ml of flask and kept for five hours at 70 ºC temperature and refluxed in to 250 ml of round bottom flask kept the solution on bench top to attain the room temperature. Then the final volume was made up with diluent to achieve 10µg/ml for Selexipag concentrations and the chromatograms were recorded to access the stability of sample.

Base Degradation
Degradation of drug sample is carried out by alkali stress agents in which 1 ml of drug stock solution and 2 ml of 0.1 N NaOH solution mixed in 10 ml of flask and kept for five hours at 70 ºC temperature and refluxed in to 250 ml of round bottom flask. Kept the solution on bench top to attain the room temperature.
Then the final volume was made up with diluent to achieve 10µg/ml for Selexipag concentrations and the chromatograms were recorded to access the stability of sample.


Oxidative Degradation
Degradation of drug sample is carried out by oxidative stress agents in which 1 ml of drug stock solution and 2 ml of 3% H2O2 solution mixed in 10 ml of flask and kept for 3.5 hours at 70 ºC temperature and refluxed in to 250 ml of round bottom flask. Kept the solution on bench top to attain the room temperature.
Then the final volume was made up with diluent to achieve 10µg/ml for Selexipag concentrations and the chromatograms were recorded to access the stability of sample.

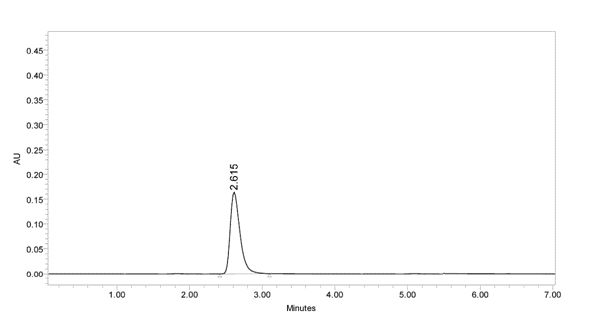
Photo Degradation
Degradation of drug sample is carried out by photolytic stress agents in which 1ml of drug stock solution was transferred in to 10 ml of volumetric flask and kept for 48 hours at natural sun light. Then the final volume was made up with diluent to achieve 10µg/ml for Selexipag concentrations and the chromatograms were recorded to access the stability of sample

Thermal Degradation
Degradation of drug sample is carried out by temperature stress agents in which 1 ml of drug stock solution was incorporated in to 10 ml of volumetric flask and kept for 5 hours at 110 ºC temperature in oven.
Then the final volume was made up with diluent to achieve 10µg/ml for Selexipag concentrations and the chromatograms were recorded to access the stability of sample.
| API Area of Standard 1539.291 | ||||
|---|---|---|---|---|
| Condition | Area | % Degradation Standard | Area | % Degradation Sample |
| Acid | 1341.793 | 3.654 | 1351.065 | 3.765 |
| Base | 1388.33 | 3.548 | 1355.336 | 3.832 |
| Thermal | 1315.35 | 2.434 | 1326.248 | 2.21 |
| Oxidation | 1301.3 | 2.81 | 1288.948 | 2.798 |
| Photolytic | 1353.082 | 1.078 | 1366.62 | 1.202 |
Table 15: Consolidated results of Stability studies for Selexipag.
Summary and Conclusion
The project summarizes a method development and validation for determination of Selexipag in pharmaceutical tablet dosage form.
An effective HPLC (high performance liquid chromatographic) technique was established for Selexipag. The HPLC method was using C18 column; (150 × 4.6 × 5µ) column at 281nm, flow rate of 1.0 ml/min., Injection quantity of 20µl, column temperature was maintained ambient, equal quantity of Methanol as well as Water used as mobile phase (50:50 v/v). It was found that retention time were 2.627 mins. It was found that the percent purity was 99.9 w/w. According to ICH guidelines, the logical approach was validated (ICH, Q2 (R1)). The regression coefficient (r2) was 0.999, recovery was 100.0%, and % RSD was found to be 0.2. The present stability indicating method for Selexipag in pharmaceutical formulations is specific because the drug peak was well separated even in presence of degradation products. Overall, the data demonstrated that the excipients and the degradation products did not interfere with Selexipag peak, indicating the selective method.
The HPLC method was found to be reliable, specific, economical, stable and reproducible for routine analysis, the technique can be suggested, and the approach can be recommended for the resolution of the associated drug Selexipag compound and in pharmaceutical dosage form.
References
-
Skoog DA, Holler FI, Niemen TA (2005) Separation Techniques, Principles of Crucial Evaluation. 5th (Edn.), Thomson Asia Pte. Ltd, pp: 673-688.
-
Kasture AV, Mahadik KR, Wadodker SG, More HN (2006) Crucial techniques of Drug analysis, NiraliPrakashan Pune. 14th (Edn.), pp: 48.
-
Chatwal GR, Anand SK (2006) Instrumental Methods of Evaluation. 4th (Edn.), ShingHanse, Mumbai, pp: 670.
-
Snigdha Damireddy K, Pravalika M, Praveen (2017) Method development and validation of selexipag in its bulk and dosage form by RP-HPLC. International Journal of Pharmacy & Biological Sciences 7(4): 84-92.
-
Aashka Joshi MS, Patel CN (2019) World Journal of Pharmaceutical Research pp: 293-304.
-
Bhadru B, Rao VV, Vidhyadhara S (2019) Journal of Pharmaceutical Science & Research pp: 2722-2727.
-
Prathyusha SM, Deepti CS, Naik RR, et al. (2019) Research Journal of Pharmacy & technology 13.
-
Sharma BK (2003) Instrumental approaches of chemical analysis, Intro Analytical chemistry. 19th (Edn.), Meerut: Goel Posting Residence, pp: 56-84.
-
Yogesh Gupth (2003) Pharmaceutical Drug Evaluation, 2nd (Edn.), New Age International (P) Ltd, New Delhi, India, pp: 157.
-
Introduction to High performance fluid chromatography.
- Acido Labile or Gastro Irritant Apis and Enteric Release in Galenic Practice: An Overview
- A Study on Knowledge, Attitude and Practice of Hand Hygiene among Healthcare Professionals at a Tertiary Care Hospital, India
- Influence of Inoculum Concentration on In Vivo Incubation Period of Emmia lacerata, Pathogenesis and Management of Wilt in Pepper (Capsicum annuum L.)
- Vanilla’s Chemistry
- Marine Anti-Cancer Compounds and Adverse Effects of Global Warming on Oceans: An Overview
- Serological Investigation of Chikungunya Virus Antibody among Malaria-Suspected Febrile Patients in Some Healthcare Facilities in Rivers State