UPLC–MS/MS-Based Targeted Proteomics Assay to Evaluate the Relationship between CYP3A2 Expression and Enzymatic Activity
Traditional analytical methods such as western blotting and reverse transcription-polymerase chain reaction only allow semiquantitative assessments and cannot accurately quantify the expression of the cytochrome P450 (CYP) enzyme. Therefore, the relationship between excess CYP enzyme and enzymatic activity is not been systematically studied yet. In the present study, we developed a new method using ultra-high-performance liquid chromatography (UPLC) mass spectroscopy (MS)/MS and determined the accurate quantification of CYP3A2 in rat liver. The linear range was 0.1329–8.508 ng/mL. The intra- and interday precisions and accuracies data fulfilled the acceptance criteria of food and drug association guidelines for bio analytical method validation. We compared the quantitative results with CYP3A2 activity obtained by the cocktail assay. The developed method was successfully used for the quantitative analysis of CYP3A2. It provided a good background for determining the differences in drug metabolism caused by different CYP expression.
Introduction
Hepatic cytochrome P450 (CYP450) is the main enzyme in the hepatic biotransformation of various drugs. The activity of CYP450 enzymes determines the metabolic rate of a majority of drugs [1, 2, 3]. Therefore, determining the activity of CYP450 is crucial for the preclinical development of new drugs [4]. However, the activity of CYP450 is not only affected by inter individual differences but also by its abundance [5]. Therefore, the relationship between the abundance of CYP450 and its enzyme activity should be studied [6, 7].
Even though many studies have reported the differences in drug metabolism due to the abundance of CYP450 at the genetic level [8, 9, 10], the relationship between CYP450 expression and enzymatic activity has rarely been studied. The lack of sufficient studies is probably due to the insufficient accuracy, reproducibility, and specificity of traditional analytical methods [11]. In some studies, researchers have quantified CYP450 mRNA by reverse-transcription polymerase chain reaction (RT-PCR) as an alternate in some vitro enzyme induction experiments [12, 13, 14]. However, because of the post-translational modifications and delayed expression, the mRNA quantification cannot be used to determine the actual expression of CYP450 [15]. Western blotting (WB) is a semi-quantitative method with low accuracy and limited specificity [16]. Moreover, considering the specificity and interaction of probe reactions induced by different CYP enzymes is a challenge in the Cocktail method [17]. Therefore, a highly sensitive and accurate quantification method should be established for CYP450 to determine the relationship between CYP450 abundance and drug metabolism.
Targeted proteomics is a new technique for the quantification of a target protein using mass spectrometry (MS) [18]. The multi-response monitoring mode (MRM) of the mass spectrometer is used to filter precursor and fragment ions. Compared with traditional methods, targeted proteomics can provide more accurate and reproducible protein quantification data that can aid further research.
CYP3A2 enzyme found in rats is the homologous enzyme of the CYP3A4 enzyme found in humans [19]. It is one of the most significant metabolic enzymes that accounts for about 30% of total CYP proteins [20]. CYP3A2 metabolizes various drugs such as Cyclosporine, Quinine, Midazolam, and Tacrolimus [20, 21]. Therefore, CYP3A2 was selected as the research object to develop the quantitative technique of the CYP enzyme line based on the principle of targeted proteomics. The analytical method was established and confirmed for the quantitative determination of CYP3A2 in rat liver. For protein quantification, A surrogate peptide was selected that exists in both humans (CYP3A4) and rats (CYP3A2). This ensured that the new method can simultaneously quantify the corresponding enzyme of both species. Additionally, this method was compared with WB and RT-PCR, and that was used to determine the mathematical relationship between CYP3A2 quantification and activity.
Materials and methods
Chemicals and reagents
The bicinchoninic acid assay (BCA) kit was obtained from Pierce Biotechnology (Rockford, IL, USA) and the Sequencing Modified Trypsin from Merck (Madison, USA). Acetonitrile and HPLC-grade methanol were provided by Merck (Germany). The surrogate peptide was obtained from KE Biochem Co., Ltd. (Shanghai, China). Urea, dithiothreitol (DTT), iodoacetamide (IAA), Tris-HCl, TFA, and Triton X-114 were supplied by Sigma-Aldrich. Phosphate buffer salt (PBS) was provided by the Beyotte Institute of Biotechnology, Jiangsu Province, China. Water was purified and deionized through the purification system derived from Millipore Inc. (Bedford, Massachusetts, USA). Chlorazolone, 6-OH ketazolone, and hydrochlorothiazide were provided by the Institute of Clinical Pharmacology, Central South University.
Surrogate Peptide Determination
Surrogate peptide was first selected in silicon and then experimentally verified. In particular, surrogate peptide was selected using Skyline (which predicts the mass spectrum of target proteins and peptide segments) [22], in combination with Uniprot (excluding uncertain and unstable regions), PeptideAtlas (predicting MRMs of a specific peptide segment), and BLAST (theoretically verifying the specificity of peptide segments). The selected peptide was GSIHPYVYLPFGNGPR. Then, the surrogate peptide and stable isotope-labeled internal standards (SIL-IS) substance were synthesized.
Standard Calibration and Method Validation
The standard calibration curve was prepared by using digested human serum albumin (HSA). The standard concentrations of surrogate peptide were 0.1329, 0.2658, 0.5316, 1.063, 2.127, 4.253, and 8.508 ng/mL, respectively. The concentration of standard quality control (QC) solutions used for the determination of the lower limit of quantification (LLOQ) was 0.1329 ng/mL, for low QC (LQC) was 0.2658 ng/ mL, for mid-QC (MQC) was 1.063 ng/mL, and for high QC (HQC) was 6.806 ng/mL. The IS solution was prepared at the concentration of 50 ng/mL by diluting the stock solution with ultrapure water (50:50, v/v).
The UPLC-MS/MS validation method included the determination of the specificity, linearity, precision, accuracy, and stability. The calibration curve, including the double- blank sample (the blank matrix without any peptide) and the single-blank sample (with IS solely) was determined twice. The QC samples with analytical peptides were added to the matrix in 5 repetitive tests.
Preparation of Rat Liver Microsome and S9 Fraction
Healthy Sprague–Dawley (SD) male rats were fasted for 24 h and then sacrificed by cervical dislocation. Their livers were weighed after perfusion with cold saline through the portal vein. Next, the liver was cut into small pieces, ground in mortar with liquid nitrogen, and homogenized in the Tris-HCl (50 mM) buffer (1:4 w/v). The homogenate was centrifuged at 10,000 xg for 20 min at 4℃. The liver S9 fraction was obtained through supernatant filtration. The liver microsomal pellets were obtained by ultra-centrifuging the liver S9 fraction at 100,000 xg for 60 min at 4℃, followed by washing of the liver microsomes with PBS and 20% glycerol buffer. Finally, these samples were stored at -80℃ until analyses. The total protein concentration of liver micro some and liver S9 was assayed by using a BCA kit. All procedures implemented in this study met the ethical standards of the institutional and national research committee and adhered to the Helsinki Declaration in 1964 and its later amendments or other comparable ethical standards.
Sample Processing
Liver microsomal proteins (20μg/μL) were denatured at 95℃ for 2 min and then cooled at 56℃ for 20 min in 30-mM DTT. IAA (80 nM) was alkylated at 37℃ and then incubated in the dark for 20 min. Next, 15 μL of NH4HCO3 (50 mM) buffer were added to the mixture.
After addition of the IS solution, the samples were treated with trypsin and incubated for 30 s, followed by digested in the dark at 37℃ for 24 h. The digestion was discontinued by adding 20 μL of 10% TFA. The digestion liquid was centrifuged at 16,000 xg for 15 min at 4℃. The supernatant was evaporated to the waterless form with nitrogen at 45℃ and dissolved in 100 μL of the mobile phase. The resultant solution was then centrifuged at 16,000 xg for 15 min at 4℃ and 5 μL of the supernatant was injected into the UPLC-MS/ MS system for further analyses.
Quantification of CYP3A2 by LC-MS/MS
A prerequisite factor to attain the accurate quantification of proteins is the high-quality MRM. To develop the optimal MRM methods for the detection of peptides, we identified and optimized the appropriate mass transition for each peptide by using surrogate peptides and the corresponding stable isotope-labeled IS.
The chromatographic method was performed using the Zorbax EcLipse C18 column (2.1 × 50 mm, 1.7 μm) at 50℃. The mobile phase composed of (A) 0.2% formic acid and (B) acetonitrile was at the flow rate of 0.4 mL/min. Gradient elution steps were 5% B (0-11 min), 20% B (11-12 min), 60% B (12-14 min), 90% B (14-15 min), and 5% B (15-16.5 min).
A triple quadrupole mass spectrometer (UPLC-XEVO TQ-S MS, Waters, and Milford, MA) was used to analyze the samples under the following conditions: the positive ion mode with MRM of electrospray ionization (ESI) was adopted. Gas temperature was 350℃, capillary was 3000 V, and the desolation gas flow rate was fixed to 1000 L/h. The precursor-to-product transition for the measured peptide was set to 592.24.7 m/z→372.76 m/z, fragmentation voltage was 25 V, and the collision energy was 14 eV. The transition for SIL-IS peptide was 596.76.3 m/z→372.76 m/z, fragmentation voltage was 17 V, and the collision energy was 12 eV.
Assessment of CYP3A2 by RT-PCR
Total RNA was extracted from liver homogenates by Trizol. The PrieScript RT reagent kit protocol of ABI 7500 (Bio-Rad, California, USA) was employed for the iQ5 Real Time PCR with the following primers: CYP3A2 (F), 5’-TGGGAAACAGGGTAATGAG-3’; CYP3A2 (R), 5’-CTGCCTTTGGTCTTTTTTTGA-3’; GAPDH (F), 5’-TGCCCATTTTTGATG-3’; and GAPDH (R), 5’-TGGTGCAGGATGCAT-3’. GAPDH was used as the reference for calibration.
Assessment of CYP3A2 by WB
The total protein concentration of each sample was determined by using the BCA kit. The proteins were separated by SDS-PAGE. The initial voltage was 80 V, which was then increased to 120 V as the protein samples entered the gel. The appropriate gel regions were cut and transferred onto PVDF membranes. The membrane was incubated with a primary antibody for overnight at 4°C, washed with TBST, and incubated with horseradish peroxidase-conjugated secondary antibody for 2 h at room temperature, after which the protein bands were observed by using an enhanced chemiluminescence (ECL) system.
Determination of CYP3A2 Enzyme Activity
The activity of CYP3A2 was detected based on the probe substrate assay method. Briefly, rat liver microsomes were mixed with nifedipine and incubated in PBS (pH 7.4). The reaction was initiated by NADPH and terminated by adding cold acetonitrile. After centrifugation at 20,000 xg for 10 min at 4℃, the supernatant (10 μL) were employed and then analyzed by the UPLC-MS/MS. The enzyme activity was calculated according to the metabolic rate of nifedipine.
Data Statistics
Data were analyzed by the SPSS statistical software package version 19.0 (SPSS Inc., Chicago, IL, USA). All data in this study were subjected to the Shapiro–Wilke test. In case of normality (homogeneity of variance), the differences between the groups were assessed using t-tests or LSD, and any hypothesis testing was performed using an alpha value of 0.05. Pearson correlation test (R) was adopted to evaluate the data correlation.
Results
Experimental Verification of Peptide Specificity
The selected surrogate peptide was GSIHPYVYLPFGNGPR, which was suitable for the evaluation of both CYP3A4 (human) and CYP3A2 (rat).
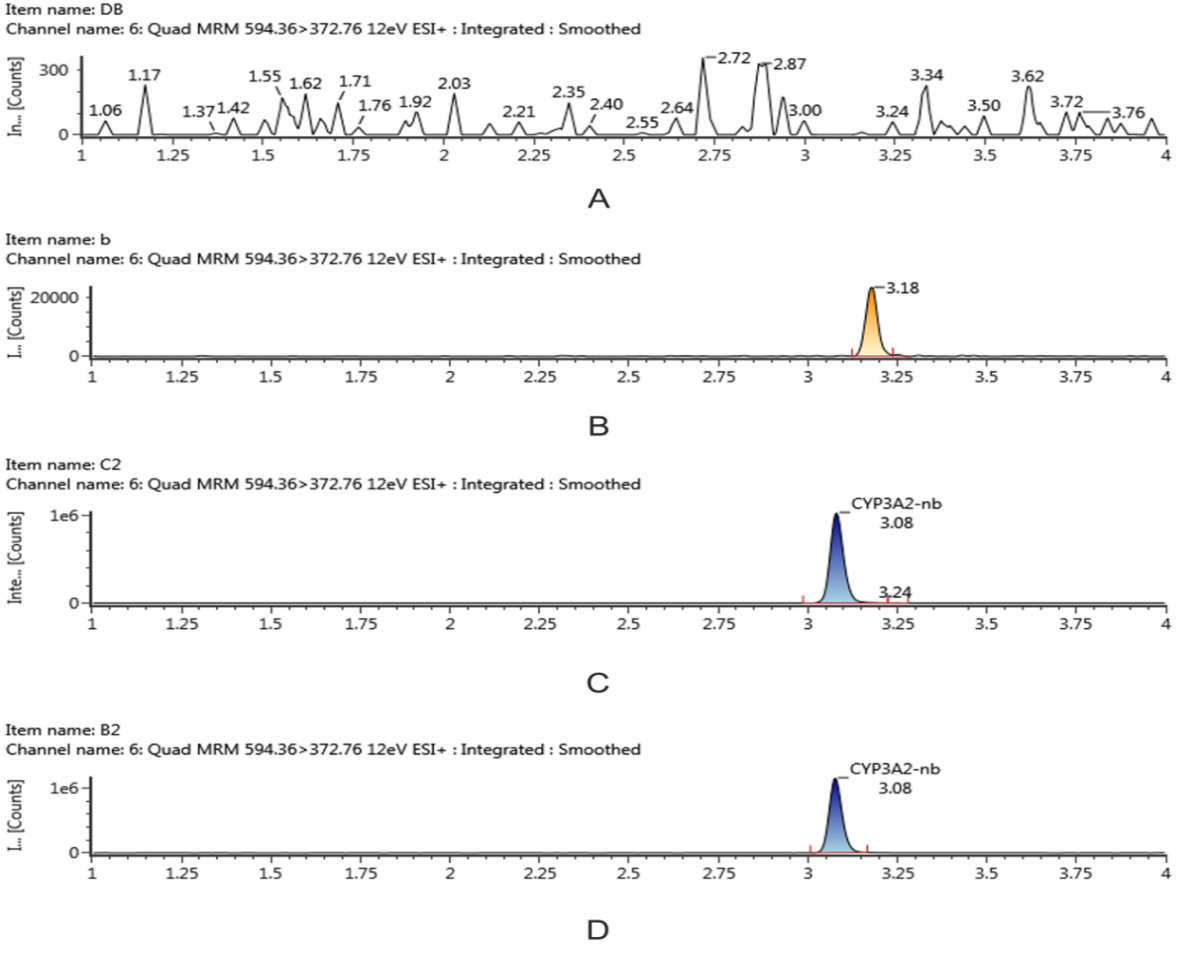
The experimental verification was performed to ensure that the signal intensity generated by the selected surrogate peptide was not interfered with by the biological matrix. Because no blank matrix was available, HSA was used as a validation matrix to determine the matrix effect. HSA without surrogate peptide segment or IS was digested as described in Section 2.5 and the matrix validation was then performed. As shown in the chromatogram diagram (Figure 1), the peak time of the target peptide was 3.08 min and was not disturbed by other substances.
Ultra-High Performance Liquid Chromatography (UPLC)-MS/MS Analysis and Method Verification
Peptide concentration was positively correlated with the signal strength within the validation range of 0.1329- 8.508 ng/mL. The correlation coefficient (r) of the CYP3A2 calibration curve was 0.9940 (Y = 0.138X + 0.0136, weight: 1/X2).
The result showed that the lower limit of quantification (LLOQ) of CYP3A2 was 0.1329 ng/ml, with precision (% relative standard deviation [RSD]) within ± 10% and accuracy (% relative error [RE]) within ± 15% (Table 1). Which was lower than the value previously reported for the LC-MS/MS method for CYPs [22, 23, 24]. Compared with other methods previously reported, this method was more sensitive, which ensured the detection of CYP3A2 with low abundance in vivo.
| LLOQ | LQC | MQC | HQC | |
|---|---|---|---|---|
| 0.1329 ng/mL | 0.2658 ng/mL | 1.063 ng/mL | 6.806 ng/mL | |
| Mean (ng/mL) | 0.1217 | 0.2488 | 1.001 | 6.969 |
| Accuracy (%) | 91.54 | 93.59 | 94.18 | 102.4 |
| Intra-day precision | ||||
| (RSD, %) | 8.61 | 7.319 | 6.435 | 5.45 |
| Inter-day precision (RSD, %) | 9.436 | 10.56 | 9.143 | 7.757 |
Table 1: Accuracy and intra-day, inter-day precision for the determination of CYP3A2 in HAS.
The accuracy and precision were determined by using three patterns of concentrations of QC samples (LQC, MQC, and HQC) prepared with the surrogate peptide in HSA. As shown in Table 1, the intra- (n = 5) and inter-day (n = 3) precision were within ±15%, whereas the accuracy was within ±15%. The stability of QC samples was determined at room temperature before processing for 6 h, 3 freeze- thaw cycles (−20°C), at room temperature after processing for 48 h, and at auto-sample condition after processing for 24 h, respectively. As shown in (Table 2), the accuracy and precision of LQC, MQC, and HQC were all within ±15%, which indicated that the surrogate peptide was stable under the abovementioned conditions.
| QC Levels | Stability tests | Conditions | |||
|---|---|---|---|---|---|
| at room temperature before processing for 6 h | 3 freeze-thaw cycles (-20) | at room temperature after processing for 48 h | at auto-sample condition after processing for 24 h | ||
| LQC | Mean (ng/mL) | 0.2563 | 0.2783 | 0.2492 | 0.2241 |
| Accuracy (%) | 95.62 | 104.7 | 93.75 | 84.31 | |
| RSD (%) | 9.433 | 10.32 | 6.375 | 10.37 | |
| MQC | Mean (ng/mL) | 0.99 | 0.9742 | 0.9739 | 1.104 |
| Accuracy (%) | 93.11 | 91.65 | 91.62 | 103.8 | |
| RSD (%) | 9.584 | 8.427 | 8.287 | 7.439 | |
| HQC | Mean (ng/mL) | 6.578 | 6.949 | 6.773 | 6.97 |
| Accuracy (%) | 96.64 | 102.1 | 99.52 | 102.4 | |
| RSD (%) | 6.542 | 7.228 | 5.751 | 9.319 |
Table 2: Stability of QC samples under different conditions.
| Sample | Microsomes | S9 | ||||||||
|---|---|---|---|---|---|---|---|---|---|---|
| Intra-day precision | ||||||||||
| Batch | 1 | 2 | 3 | 4 | 5 | 1 | 2 | 3 | 4 | 5 |
| Mean (ng/ mg) | 11.36 | 9.065 | 8.9 | 9.5 | 12.05 | 2.107 | 4.253 | 3.03 | 3.27 | 2.13 |
| RSD (%) | 6.604 | 4.42 | 6.28 | 7.4 | 5.552 | 4.933 | 5.645 | 8.1 | 6.65 | 7.42 |
| Intra-day precision | ||||||||||
| Mean (μg/ mg) | 10.17 | 2.958 | ||||||||
| RSD (%) | 8.71 | 8.05 |
Table 3: Intra-day, inter-day precision of the real samples.
Furthermore, the precision and stability of the real samples were determined simultaneously because of the differences between the real samples and surrogate peptides in the blank matrix. As shown in (Tables 3 & 4), the intra- day and inter-day precision of the samples were both within ±15%. In addition, the stability of the real sample was within ±15%, which indicated that the real sample was stable under different conditions. This pretreatment and UPLC-MS/MS method is validated to be reliable for quantifying CYP3A2 expression in authentic samples.
| Sample | Stability tests | Conditions | |||
|---|---|---|---|---|---|
| at room temperature before processing for 6 h | 3 freeze- thaw cycles (-20℃) | at room temperature after processing for 48 h | at auto-sample condition after processing for 24 h | ||
| Microsomes | Mean (ng/mg) | 7.015 | 11.28 | 9.311 | 10.61 |
| RSD (%) | 5.832 | 6.418 | 5.338 | 6.287 | |
| S9 | Mean (ng/mg) | 3.271 | 2.776 | 2.894 | 2.427 |
| RSD (%) | 7.218 | 5.091 | 9.171 | 8.826 |
Table 4: Stability of samples under different conditions.
Digestion Efficiency
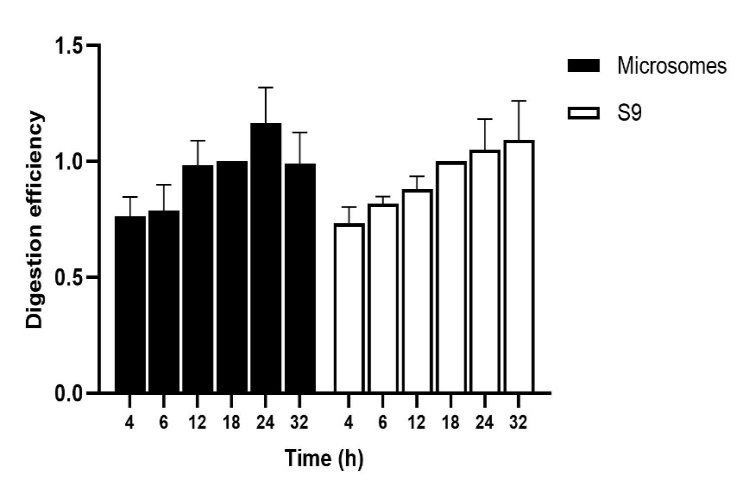
To eliminate the risk of peptidase interference as much as possible, the experimental conditions for tryptic digestion was optimized. The liver microsomes and the S9 fraction were performed at 37 °C for 4, 6, 12, 18, and 24 h (n=5). As shown in (Figure 2), the digestion efficiency differed with different samples. The maximum efficiency was reached at 24 h for the liver microsomes, whereas it was 32 h for S9 fractions. Therefore, as a compromise, 24 h at 37°C was the most appropriate time and temperature for the liver microsomes and the S9 fractions.
Comparison of UPLC-MS/MS Method with RT- PCR and WB
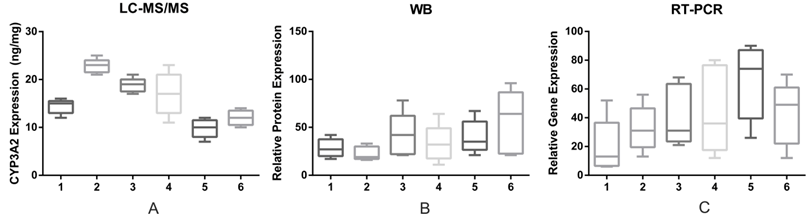
To compare the accuracy of the three different methods, samples from 6 rats that were randomly selected were tested using UPLC-MS/MS method, RT-PCR, and WB, respectively, five times. The results are shown in (Figure 3). UPLC-MS/ MS showed statistically significant differences in CYP3A2 expression between liver microsomes of 6 rats (P <0.05). WB and RT-PCR cannot distinguish these differences properly can be because they are semi-quantitative methods and lack reproducibility. Therefore, UPLC-MS/MS method showed higher accuracy and precision than traditional methods and appeared more suitable for quantitating individual differences in protein expression.
Correlation Between CYP3A2 Expression and Enzyme Activity
We analyzed the correlation between CYP3A2 expression, which was quantified by the validated UPLC-MS/MS method, and activity. We also compared the correlation results of three different quantitative methods (UPLC-MS/MS, WB, and RT-PCR). As shown in (Figure 4), the correlation between CYP3A2 expression obtained by UPLC-MS/MS method was strong in both the liver microsomes and S9 (P <0.01).
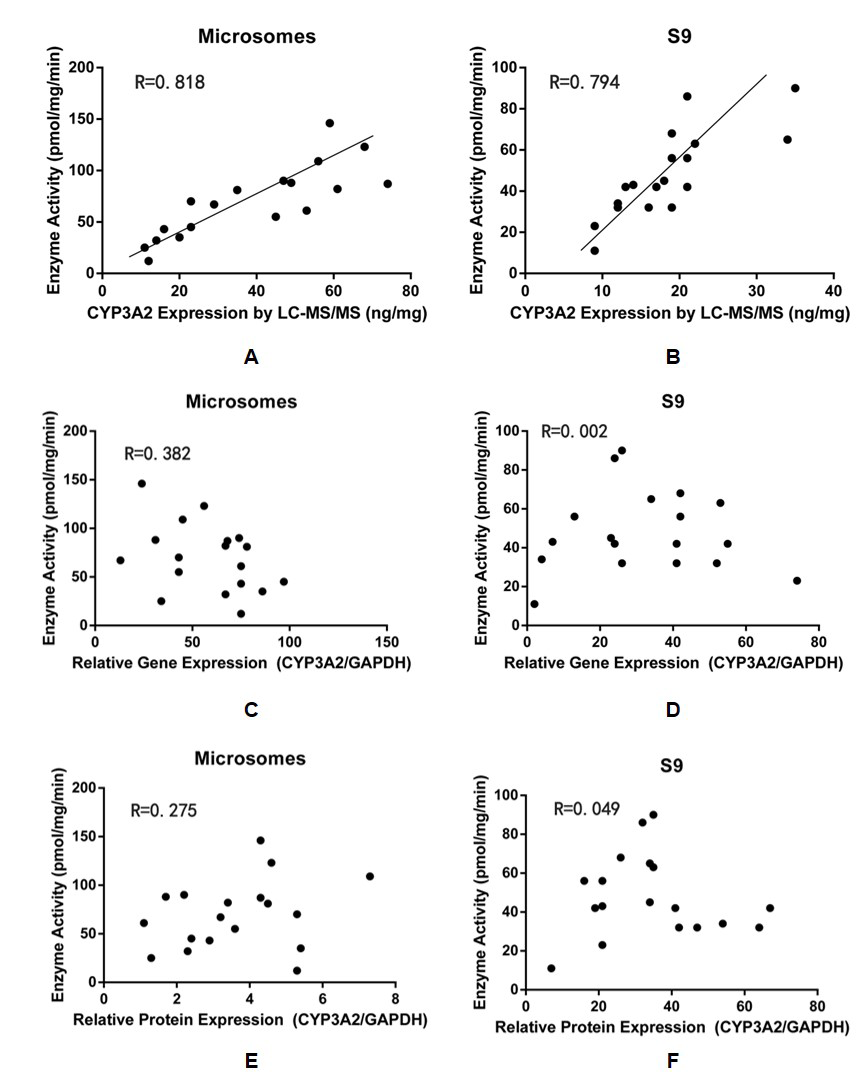
Notably, no significant correlation was found between WB or RT-PCR quantitative results and enzyme activity which was mainly due to the shortcomings of the two traditional methods. First, the quantitative result of mRNA by RT-PCR cannot reflect the expression of the protein. Because the translation process from mRNA to protein is not simple, it will be disturbed by many factors, such as post-translational modifications [23, 24, 25]. Second, quantification by WB is dependent on the antigen-antibody reaction, which is limited by the high sequence homology and cross-reactivity of the available antibodies [16].
Individual differences in enzyme expression can lead to significant variations in drug metabolism. The methods for absolute quantification of enzyme expression should be established. The established UPLC-MS/MS method can be used as a supplement along with traditional methods in drug metabolism and enzyme activity studies.
Discussion
CYP450 is the major class of enzymes for drug metabolism. Its metabolic efficiency is influenced by various factors, such as genetics, disease, diet, drugs, and environmental factors, which lead to inter-individual differences in drug therapeutic effect. CYP450 individual expression will affect the efficiency of drug metabolism in vivo. Therefore, phenotypic cocktails can be useful because it allows the simultaneous determination of some CYP activity through the use of probes with minimal within-subject variability over time. However, this strategy has a formidable difficulty on how to select probes to prevent metabolic interactions from occurring [26]. Protein activity, perhaps the most key factor in biological pathways, can be precisely mediated by post-translational modifications [27].
Compared with RT-PCR and WB, UPLC-MS/MS method showed higher accuracy and sensitivity and was more suitable for high-throughput analysis. In this study, the quantitative results obtained by UPLC-MS/MS method were linearly correlated with enzyme activity and can be used to distinguish differences between sample groups, which indicated that this method has enough precision and accuracy for the quantitative determination of CYP3A2. Based on the strong correlation found between Nifedipine metabolic rate and enzyme determination by UPLC-MS/ MS, CYP3A2 activity can be inferred from its expression. Previous studies reported that the difference in expression of CYPs could account for the interindividual difference in drug metabolism [28]. Therefore, we speculated that the absolute quantification of CYP enzymes can further determine the direct mathematical relationship between the expression of drug-metabolizing enzymes and the metabolism process and distinguish individual variations of drug metabolism.
Considering that hepatic drug enzymes are mainly present in liver microsomes, where the traditional cocktail method was used to detect the activity of the enzyme, we used liver microsomes as samples for the quantitative analysis of enzymes expression by UPLC-MS/MS11 [29]. However, the preparation of liver microsomes is generally difficult and complex. To simplify the pretreatment, rat liver homogenate S9 fraction was also used to study the correlation between the expression of CYP3A2 and enzyme activity. We found that the protein expression in the S9 fraction was also proportional to the enzyme activity. This suggested that liver homogenate can be used to replace liver micro some to quantify proteins by targeted proteomics, thereby simplifying the experimental procedure.
Conclusion
In the present study, we established and verified the UPLC-MS/MS method and presented its several advantages including higher sensitivity, accuracy, precision, and reproducibility. Moreover, the relationship between the abundance and activity of CYP3A2 in rat liver was determined using different methods. Compared with RT-PCR and WB, the UPLC-MS/MS quantitative results showed a strong correlation with enzyme activity, which indicated that the UPLC-MS/MS-based targeted quantitation methods, can be a reliable choice of technique to overcome the limitations of RT-PCR and WB. Moreover, the strong correlation provided a good background to study the individual differences in drug metabolism due to different CYP enzyme expression.
Accession Codes CYP3A4:P08684 CYP3A2:P05183
Conflicts of interest
All authors have no potential conflicts of interest to declare. References
1. Nebert DW, Russell DW (2002) Clinical importance of the cytochromes P450. Lancet (London, England) 360(9340): 1155-1162.
2. Gueguen Y, Mouzat K, Ferrari L, Tissandie E, Lobaccaro JMA, et al. (2006) Cytochromes P450: xenobiotic metabolism, regulation and clinical importance. Ann Biol Clin 64(6): 535-548.
3. Sinz M, Wallace G, Sahi J (2008) Current Industrial Practices in Assessing CYP450 Enzyme Induction: Preclinical and Clinical. AAPS J 10(2): 391-400.
4. Mishra NK (2011) Computational modeling of P450s for toxicity prediction. Expert opinion on drug metabolism & toxicology 7(10): 1211-1231.
5. Snawder JE, Lipscomb JC (2000) Interindividual Variance of Cytochrome P450 Forms in Human Hepatic Microsomes: Correlation of Individual Forms with Xenobiotic Metabolism and Implications in Risk Assessment. Regulatory toxicology and pharmacology: RTP 32(2): 200-209.
6. McGraw J, Waller D (2012) Cytochrome P450 variations in different ethnic populations. Expert opin Drug Metab Toxicol 8(3): 371-382.
7. Zaigler M, Tantcheva-Poór I, Fuhr U (2000) Problems and perspectives of phenotyping for drug-metabolizing enzymes in man. Intern J Clin Pharmacology & Therapeutics 38(1): 1-9.
8. Saruwatari J, Nakagawa K, Ishizaki T (2002) Nihon rinsho. Japanese journal of clinical medicine 60: 58-63.
9. Ma MK, Woo MH, McLeod HL (2002) American journal of health-system pharmacy. AJHP: official journal of the American Society of Health-System Pharmacists 59: 2061-2069.
10. Ma JD, Nafziger AN, Bertino JS (2004) Genetic polymorphisms of cytochrome P450 enzymes and the effect on interindividual, pharmacokinetic variability in extensive metabolizers. J Clin Pharmacol 44(5): 447- 456.
11. Liu X, Hu L, Ge G, Yang B, Ning J, et al. (2014) Quantitative analysis of cytochrome P450 isoforms in human liver microsomes by the combination of proteomics and chemical probe-based assay. Proteomics 14(16): 1943- 1951.
12. Jiang B, Meng L, Zhang F, Jin X, Zhang G (2017) Life sciences 189: 1-7.
13. Saurabh K, Sharma A, Yadav S, Parmar D (2010) Polycyclic aromatic hydrocarbon metabolizing cytochrome P450s in freshly prepared uncultured rat blood lymphocytes. Biochemical pharmacology 79(8): 1182-1188.
14. Liu L, Mugundu GM, Kirby BJ, Samineni D, Desai PB, et al. (2012) Quantification of human hepatocyte cytochrome P450 enzymes and transporters induced by HIV protease inhibitors using newly validated LC-MS/MS cocktail assays and RT-PCR. Biopharmaceutics & Drug Disposition 33(4): 207-217.
15. Sy SK, Ciaccia A, Li W, Roberts EA, Okey A, et al. (2002) Modeling of human hepatic CYP3A4 enzyme kinetics, protein, and mRNA indicates deviation from log-normal distribution in CYP3A4 gene expression. Europ J Clinical Pharmacol 58: 357-365.
16. Gorr TA, Vogel J, (2015) Western blotting revisited: critical perusal of underappreciated technical issues. Proteomics. Clinical applications 9(3-4): 396-405.
17. Spaggiari D, Geiser L, Daali Y, Rudaz S (2014) A cocktail approach for assessing the in vitro activity of human cytochrome P450s: an overview of current methodologies. J Pharma Biomed Anal 101: 221-237.
18. Kamiie J, Ohtsuki S, Iwase R, Ohmine K, Katsukura Y, et al. (2008) Quantitative atlas of membrane transporter proteins: development and application of a highly sensitive simultaneous LC/MS/MS method combined with novel in-silico peptide selection criteria. Pharm Res 25(6): 1469-1483.
19. Aiba T, Takehara Y, Okuno M, Hashimoto Y (2003) Pharmaceutical research 20(5): 745-748.
20. Thummel KE, Wilkinson GR (1998) In Vitro and In Vivo Drug Interactions Involving Human Cyp3a Annual Review of Pharmacology and Toxicology 38: 389-430.
21. Andreu F, Colom H, Elens L, van Gelder T, van Schaik RHN, et al. (2017) A New CYP3A5*3 and CYP3A4*22 Cluster Influencing Tacrolimus Target Concentrations: A Population Approach. Clin pharmacokinet 56(8): 963- 975.
22. Shao Y, Yin X, Kang D, Shen B, Zhu Z, et al. (2017) An integrated strategy for the quantitative analysis of endogenous proteins: A case of gender-dependent expression of P450 enzymes in rat liver microsome. Talanta 170: 514-522.
23. Hersman EM, Bumpus NN (2014) A Targeted Proteomics Approach for Profiling Murine Cytochrome P450 Expression. J Pharmacol Exp Ther 349(2): 221-228.
24. Achour B, Feteisi AH, Lanucara F, Rostami-Hodjegan A, Barber J (2017) Global Proteomic Analysis of Human Liver Microsomes: Rapid Characterization and Quantification of Hepatic DrugMetabolizing Enzymes. Drug metabolism and disposition 45(6): 666-675.
25. Groer C, Bruck S, Lai Y, Paulick A, Busemann A, et al. (2013) LC–MS/MS-based quantification of clinically relevant intestinal uptake and efflux transporter proteins. Journal of pharmaceutical and biomedical analysis 85: 253-261.
26. Jerdi MC, Daali Y, Oestreicher MK, Cherkaoui S, Dayer P (2004) A simplified analytical method for a phenotyping cocktail of major CYP450 biotransformation routes. Journal of pharmaceutical and biomedical analysis 35(5): 1203-1212.
27. Catherman AD, Skinner OS, Kelleher NL (2014) Top Down proteomics: facts and perspectives. Biochem Biophys Res Commun 445(4): 683-693.
28. Dandara C, Swart M, Mpeta B, Wonkam A, Masimirembwa C (2014) Cytochrome P450 pharmacogenetics in African populations: implications for public health. Expert Opin Drug Metab Toxicol 10(6): 769-785.
29. Michaels S, Wang MZ (2014) The Revised Human Liver Cytochrome P450 “Pie”: Absolute Protein Quantification of CYP4F and CYP3A Enzymes Using Targeted Quantitative Proteomics Drug Metab Dispos 42(8): 1241-1251.
- Acido Labile or Gastro Irritant Apis and Enteric Release in Galenic Practice: An Overview
- A Study on Knowledge, Attitude and Practice of Hand Hygiene among Healthcare Professionals at a Tertiary Care Hospital, India
- Influence of Inoculum Concentration on In Vivo Incubation Period of Emmia lacerata, Pathogenesis and Management of Wilt in Pepper (Capsicum annuum L.)
- Vanilla’s Chemistry
- Marine Anti-Cancer Compounds and Adverse Effects of Global Warming on Oceans: An Overview
- Serological Investigation of Chikungunya Virus Antibody among Malaria-Suspected Febrile Patients in Some Healthcare Facilities in Rivers State