Recognition of Effectivity Waste Management in the Selected Urban-Rural Commune – Case Study from Poland
The analysis of waste management in the urban - rural commune in the mountain region in three years showed a difference between the declarations and the number of segregating inhabitants due to the development of internal emigration. The highest indicators determining the amount of generated waste occurred in the city, which was conducive to the amount of generated waste. The highest average mass of generated waste 262.93 Mg occurred in 2013. Generally in three years, there was an increase in collected municipal waste, which confirms the need to promote solutions conducive to the "zero waste" economy.
Introduction
Waste management in Poland, comparable to other municipal sectors, was subject to transformation mechanisms after 1989. This industry has transformed into one of the municipal spheres most susceptible to competition, especially in the field of waste disposal. This sphere is very promising, among others, due to the constant demand for the services offered, relatively slow technological changes and the possibility of integration, which, with a moderately low profitability class, may result in a high level of revenue [1]. Continuous development is possible by creating a continuous practice of integrating waste management with other sectors of municipal management, such as urban greenery, heating or electricity, or gas generation. According to the Waste Act, waste management is the collection, transport, recovery and disposal of waste, including the supervision of such activities and waste disposal sites [2]. The dynamic increase in consumption results in the generation of ever-increasing amounts of industrial and municipal waste. This waste is the cause of many difficulties in all countries of the world, and preventing its excessive accumulation, its thoughtful use and, if necessary, failure-free disposal is one of the most important issues for modern societies. Waste management is also a field of interest of the European Union, which is related to the legal conditions for conducting this management in Poland, and in the entire community [1].
The aim was the essence of the efficiency of the municipal waste management system for an urban-rural commune in Southern Poland in 2013-2015.
Characteristics of Research Unit
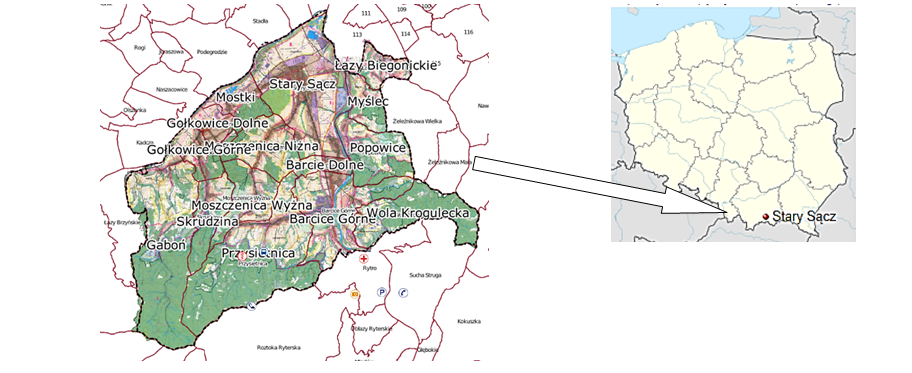
Stary Sącz is located in southern Poland in the centre of Sądecka Valley in the southern part of Poland (Lesser Poland Voivodeship) (49°34′N 20°38′E). It is a rural-urban commune covering an area of 102 km2 with 23,538 inhabitants. There
are 15 villages in the commune. The largest agglomeration and the only city in Stary Sącz.
Climate
The Nowy Sącz land is usually characterized by various climatic conditions, with strong winds, heavy rainfall, and long winters. However, when it comes to the area of the Sądecka Valley, it is slightly milder. The average annual temperature oscillates in the range of 5-8°C. The first frost can be noticed already at the end of September, while the last frosts occur until mid-May. The largest amount of precipitation occurs in July and amounts to approx. 110-130 mm of precipitation (Figure 1) (http://www.stary.sacz.pl/).
Methods and Materials
Annual data on the amount of waste collected in the city and commune in 2013-2015 was obtained based on a survey inquiry addressed to the Stary Sącz City and Commune Office.
The data obtained based on the inquiry contained information on waste producers and the amount of collected waste according to 24 types, including non-segregated municipal waste and segregated, including glass, cardboard, and plastics; biodegradable waste; glass, paper, cardboard, and plastic packaging. A qualitative and quantitative analysis of the obtained waste data was carried out in the work.
Waste Management
Waste management in the commune guarantees the collection of municipal waste generated in real estate, temporarily inhabited and real estate where economic activity is conducted or there are cultural and educational facilities or public utility facilities. This includes the following types of municipal waste: segregated (paper, glass, plastic, metals), non-segregated (mixed) municipal waste, biodegradable, including green, bulky, used tires, used electrical and electronic equipment, renovation and construction, expired medicines, ashes from individual furnaces and hazardous waste. Municipal waste was collected from the property with variable frequency:
- Selectively collected municipal waste: once a month
- Mixed municipal waste: once a month; and from June 1 to September 30 twice a month
- Biodegradable waste, including green waste: twice a month from April 1 to October 31
- Bulky waste, used electrical and electronic equipment, used tires: twice a year
- Renovation waste - on individual request
- Ashes from individual furnaces once a month in the period from 1 October to 30 April There is a Selective Collection of Municipal Waste Collection Point (PSZOK) in the commune, to which real estate owners can transfer the following fractions of municipal waste: plastic, metals, paper, glass, used electrical and electronic equipment, furniture and other bulky waste, used tires, green waste and construction and renovation waste, chemicals and other hazardous waste (http://bip. stary.sacz.pl/).
Waste Collection
The number of containers per household, with the current population of 23,538 people, is currently three (120 dm3), including a container for organic waste, mixed waste, and ash from individual furnaces. In addition, for people segregating waste, bags for plastic / metal (yellow bag), glass (green bag), waste paper (blue bag), mixed waste, residues after sorting waste (black bag) and a bag for green waste is used. Ashes from individual furnaces are placed in a separate container, bulky waste, waste electrical and electronic equipment are collected from individual households twice a year.
There are three main ways of collecting waste in the study area:
- Individual collection of waste, directly at the place of its generation, at home, and a display of bulky waste.
- Stationary containers, sockets, or local waste collection points.
- Mobile hazardous waste collection points through a special vehicle for collecting hazardous waste from the place of its generation.
- A selective waste collection point where waste can be delivered.
Waste Recovery and Disposal
The commune does not have any installations for mechanical and biological treatment of municipal waste, hence the waste goes outside its area [3]. In this area, there is an installation intended for the storage of municipal waste being the remains of waste sorting. This facility received waste from cemeteries, market places, mixed with concrete, brick rubble and ceramic materials.
Analysis and Discussion
The analysis of the population, which was included in the submitted declarations on the amount of the fee for municipal waste management, differed from the number of segregating inhabitants because many people, including students, continue their education outside their place of permanent residence, similarly, people work outside the commune. Some researchers (Begum et al. 2009) have shown that contractor attitudes and behaviours are necessary to effectively improve waste management. 5,107 inhabited properties were covered by the communal municipal waste management system. According to Passarini, et al. [4] the efficiency of waste management depends on various territorial conditions, in particular on the number of inhabitants (Table 1).
| Towns | Registration data | Data according to submitted declarations | |||
|---|---|---|---|---|---|
| Number of inhabitants | Number of houses | Number of people | Number of people | Number of inhabitants segregating waste | |
| Inhabited | Inhabited | ||||
| Stary Sącz | 9,038 | 1,745 | 6,747 | 1,918 | 6,622 |
| Barcice | 2,681 | 558 | 2,145 | 626 | 2,112 |
| Barcice Dolne | 791 | 180 | 588 | 187 | 574 |
| Gaboń | 1,382 | 275 | 1,050 | 284 | 1,040 |
| Gołkowice Dolne | 1,217 | 206 | 952 | 216 | 941 |
| Gołkowice Górne | 977 | 205 | 759 | 218 | 746 |
| Łazy Biegonickie | 922 | 197 | 774 | 231 | 728 |
| Mostki | 706 | 167 | 568 | 180 | 560 |
| Moszczenica Niżna | 1,103 | 232 | 807 | 237 | 805 |
| Moszczenica Wyżna | 680 | 133 | 498 | 144 | 497 |
| Myślec | 385 | 80 | 334 | 93 | 328 |
| Popowice | 654 | 131 | 477 | 140 | 476 |
| Przysietnica | 2,116 | 433 | 1,528 | 447 | 1,516 |
| Skrudzina | 486 | 111 | 363 | 112 | 363 |
| Wola Krogulecka | 400 | 71 | 269 | 74 | 268 |
| Total | 23,538 | 4,724 | 1,786 | 5,107 | 17,576 |
| Average | 1,569.20 | 314.93 | 1,190.60 | 340.47 | 1,171.73 |
| Min. | 385 | 71 | 269 | 74 | 268 |
| Max. | 9,038 | 1,745 | 6,747 | 1,918 | 6,622 |
Table 1: Numerical data on individual villages in the city and commune.
Analysing the numerical (registration) data concerning individual villages, the number of which is 15, it can be stated that the largest population was in the city of Stary Sącz and amounted to 9,038 people. This is a large number when comparing the remaining towns in the order of Barcice (2,681 people) or Przysietnica (2,116 people). In Stary Sącz there are by far the most houses (1,745) among other towns. Further data concerned the submitted declarations along with the number of people living in real estate and the number of inhabitants segregating waste. This commune was inhabited by an average of 6,747 people, with the smallest being 1,190. The total number of inhabited properties was 5,107, most of which were located in the town. Similarly, Panainte-Lehadus, et al. [5] showed greater involvement of the city’s inhabitants in the development of the selective waste collection. The average number of inhabitants segregating waste is 1,171 people. The largest number of inhabitants segregating waste occurred in the city (6,622). The lowest number of people segregating waste was recorded in the town with the smallest number of properties. Acc. Gómez-Sanabria, et al. [6] this result may be a consequence of the lack of social awareness about the principles of proper waste management.
The analysis of the research results showed a noticeable decrease in the amount of waste: paper, plastics and glass. In the case of non-biodegradable waste, a slight decrease can be seen in 2014-2015 (Table 2).
| Lp | Kind of waste | Amount of collected waste [Mg/year] | Contribution [%] | ||
|---|---|---|---|---|---|
| 2013 | 2014 | 2015 | |||
| 1 | Paper | 59.13 | 47.5 | 36.8 | 1,30 |
| 2 | Plastics | 115.6 | 85.2 | 53.3 | 2.3 |
| 3 | Glass | 169.3 | 66.4 | 8.1 | 2.21 |
| 4 | Multi-materiale waste | 1.6 | 1.72 | 1.8 | 0.05 |
| 5 | Metals | 3.4 | 3.8 | 4 | 0.1 |
| 6 | Demolution waste | 72.74 | 144.1 | 284.2 | 4.53 |
| 7 | Biodegradable waste including green | 119.36 | 529.6 | 421.9 | 9.69 |
| 8 | Bulky waste | 75.7 | 107.4 | 158.6 | 3.09 |
| 9 | Ash from home | - | - | 175.8 | 1.59 |
| 10 | Mixed municipal waste | 1,058.89 | 2,673.30 | 2,699.30 | 58.21 |
| 11 | Waste from cemetery | 34.84 | - | - | 0.32 |
| 12 | Waste Electrical and Electronic Equipment | 0.25 | - | - | 0.002 |
| 13 | Used tires | 15.1 | 4.5 | 7.7 | 0.25 |
| 14 | Paper packing | - | 99.2 | 102 | 1.82 |
| 15 | Plastics packing | - | 235.7 | 213.3 | 4.06 |
| 16 | Glass packing | - | 260.7 | 309.4 | 5.16 |
| 17 | Other waste nonorganic | - | 62.2 | 57.5 | 1.08 |
| 18 | Mixed concrete waste and demoli- tion | - | 143.4 | 284.2 | 3.87 |
| 19 | Organic waste from the kitchen | - | 4.9 | 15 | 0.18 |
| 20 | Anxieties | - | 0.185 | 0.023 | 0.002 |
| 21 | Mixed package waste | - | - | 5.7 | 0.05 |
| 22 | Fluorescent lamps | - | - | 0.05 | 0.002 |
| 23 | Other waste (selectively fraction collected waste metal and plastics) | - | - | 10.3 | 0.09 |
| 24 | Waste from cleaning streets and squares | - | - | 3.8 | 0.03 |
| Total | 1,725.91 | 4,469.81 | 4,852.77 | 100 | |
| Average | 143.83 | 262.93 | 220.58 | - | |
| Min. | 0.25 | 0.185 | 0.023 | 0.0005 | |
| Max. | 1,058.90 | 2,673.30 | 2,699.30 | 58.2 |
Table 2: Amount of waste collected in the city and commune in 2013-2015.
Other waste fractions, such as multi-material waste, metals, renovation waste, bulky waste, unsorted municipal waste, paper, and cardboard packaging, glass packaging, mixed waste from concrete, brick rubble, waste ceramic materials, and biodegradable kitchen waste (2014-2015) showed an increase. Vinti and Vaccar [7] showed that toxic waste is not usually found in rural communes. The largest amount was for mixed municipal waste, amounting to 2,699.3 Mg in 2013, with the highest average of 262.93 Mg in the reported year. It should be noted that the largest share (over 50%) was for unsorted municipal waste and the lowest for fluorescent lamps (0.0005%). Przydatek [8] showed a similarly significant share of unsorted waste in Poland. This indicates to achieve “zero waste” it will be necessary to intensify activities for the development of selective collection [9]. In general, in the years 2013-2015, an increase in the amount of collected waste is noticeable. Przydatek and Oana [10] also showed an upward trend in the amount of waste generated in selected settlements in Poland and Romania [11, 12].
Conclusion
Based on the analysis of waste management in the years 2013-2015 in the city and commune of Stary Sącz, the following conclusions can be drawn:
- In the examined unit, the number of people included in the submitted declarations differed from the number of inhabitants segregating waste because some people stayed outside its area.
- The largest number of people, real estate, and segregating waste (with an average of 1,171.73) was found in the city.
- The largest amount was for mixed municipal waste 2,699.3 Mg (2013) with an average of 262.93 Mg (2014).
- The largest share (over 50%) was for unsorted municipal waste and the lowest was fluorescent lamps (0.0005%).
- A noticeable increase concerned multi-material waste, metals, renovation waste, large-size waste, non- segregated municipal waste, paper and cardboard packaging, glass, mixed concrete waste, brick rubble, waste ceramic materials and biodegradable kitchen waste, and a decrease in the paper, plastics, and glass.
- In the analysed years there was an increase in the amount of collected waste.
References
-
Grzymała Z, Jeżowski P, Maśloch G (2011) Directions for the development of waste management in Poland in terms of the effectiveness of the adopted solutions. Main Business School in Warsaw pp: 86.
-
Kowal E, Kucińska-Landwójtowicz A, Misiołek A (2013) Environmental Management pp: 236
-
Przydatek G, Pietrzak A (2016) Analysis of technical assumptions of selection of elements of a landfill site on the municipal area. Agricultural Engineering 20(3): 171- 182.
-
Passarini F, Vassura I, Monti F, Morselli L, Villani B (2011) Indicators of waste management efficiency related to different territorial conditions. Waste Management 31(4): 785-792.
-
Panainte-Lehadus M, Vulpe M, Nedeff V, Mosnegutu E, Przydatek G, et al. (2022) Study on the Method of Household Waste Collection: Case Study. Applied Sciences 12(59): 7490.
-
Gómez-Sanabria A, Kiesewetter G, Klimont Z, Haberl H (2022) Potential for future reductions of global GHG and air pollutants from circular waste management systems. Nat Commun 13(1): 106.
-
Vinti G, Vaccari M (2022) Solid Waste Management in Rural Communities of Developing Countries: An Overview of Challenges and Opportunities. Clean Technol 2022 4: 1138-1151.
-
Przydatek G (2020) Assessment of changes in the municipal waste accumulation in Poland. Environmental Science and Pollution Research 27: 25766-25773.
-
Zaman AU, Lehmann S (2011) Urban growth and waste management optimization towards ‘zero waste city’. City Culture and Society 2(4): 177-187.
-
Przydatek G, Tirtoaca O (2021) Comparative analysis of the waste management system efficiency in some counties from Romania and Poland. Journal of Engineering Studies and Research 27(2): 96-106.
-
Rawshan RA, Siwar Ch, Jacqueline PJ, Jaafar HA (2009) Attitude and behavioral factors in waste management in the construction industry of Malaysia. Resources Conservation and Recycling 53(6): 321-328.
-
(2012) Waste Act of 14.
- Electronic Waste Management in the Top Ten Economies in the World: A Critical Review on Waste Generation, Regulations, Collection, Recycling and Environmental Challenges
- Some Challenging Transdisciplinary Aspects of the Sustainable Waste Management in the Permacrisis Context
- Use of Mobile Autonomous Systems for Pollution Control of Inland Water Bodies
- Environmental Impact Perspective Sustainable Online Textile Retailing: Harnessing Augmented Reality-Based Digital Twins in Bangladesh
- Composite Treatment Module for Removing Acidity and Metal (Loid)S from Acid Rock Drainage
- Household E-Waste Management Systems [E-Wms] in Malaysia