
Citation: Kadowaki S and Kaburagi T. Different Effects on Hepatic Lipid Metabolism of Low Carbohydrate Diet on Obese and Non-Obese Mice. Diabetes Obes Int J 2017, 2(3): 000156.
*Corresponding author: Tomoko Kaburagi, Department of Health Science, Faculty of Sports and Health Sciences, Daito Bunka University, 560 Iwadono, Higashi-matsuyama, Saitama 355-8501, Japan, Tel: +81-493-31-1553; Email: t-kabu@ic.daito.ac.jp
Aim: The safety and efficacy of a low-carbohydrate (LC) diet in obese and non-obese conditions are not fully understood. This study investigated the effects of a moderate LC diet (40% carbohydrate diet) on metabolic conditions in obese and non-obese mice using hepatic mRNA expression profiles and protein expression of metabolic-related enzymes.
Methods: C57BL/6J male mice were fed an eight-week high-fat diet to induce obesity. Non-obese mice were fed a control diet for the same period. Then, both the obese mice and non-obese mice were fed an LC diet (PFC energy ratio: 40, 16, 44) and control diet (PFC energy ratio: 20, 16, 64) for 13 weeks.
Results: The obese mice on the LC diet had significantly lower bodyweight gain and visceral adipose tissue weight than those that were on the control diet. In the hepatic mRNA expression metabolic profiles, obese mice on the LC diet had increased Sirt1expressionand decreased Fabp4, Gpx1, and Sod1expression. In addition, obese mice on the LC diet had significantly up regulated acetyl-CoA carboxylase (ACC) phosphorylation than those on the control diet. In the non-obese mice, there were no differences between mice on the LC diet and those on the control diet; however, the non-obese mice on the LC diet tended to have decreased phosphorylated ACC and AMP-activated protein kinase (AMPK).
Conclusion: The effects of an LC diet varied according to the state of obesity at the time of implementation, suggesting that up regulated lipid metabolism occurs only in obese conditions.
Keywords: Low-Carbohydrate Diet; Obese Mice; Phosphorylated Acetyl-Coa Carboxylase; Metabolism
The effects and safety of a low-carbohydrate (LC) diet have been studied extensively [1-5]. Most of the previous studies have specifically focused on obese and diabetic conditions, demonstrating the effects of an LC diet on weight loss, and blood glucose and lipid level regulation [6-9]. Conversely, there have also been studies investigating the negative health effects of an LC diet, such as increase of oxidative stress [10], as well as impaired insulin and glycemic responses [11].
Long-term implementation of an LC diet increases the risk of arteriosclerotic disease [12,13], all-cause mortality [13], and weight reduction [9,11]. Given the differences in these previous reports, there is speculation regarding the association of these disorders with obese conditions. In obese conditions, adipocyte hypertrophy causes changes in adipocytokines [14], and abnormality occurs in glucose and lipid metabolism [15]. In non-obese conditions, many of the cases had normal metabolic states. Therefore, it is doubtful that an LC diet in non-obese conditions will produce the same changes observed in previous studies targeting obese conditions [6-9]. However, in recent years, LC diets have become popular and have been advertised by the media as a diet therapy for prevention of aging and obesity, and health maintenance regardless of obese conditions [16]. However, the effects of an LC diet in non-obese conditions remain poorly understood.
Hepatic lipid metabolism is regulated by gene and protein expressions of factors related to fatty acid synthesis, uptake, and transport, all of which are influenced by obesity [17,18]. AMP-activated protein kinase (AMPK) is a well-known regulator of hepatic lipid metabolism involved in the acetyl-CoA carboxylase (ACC) activation loop with phosphorylation at Thr172 in the liver [18-20]. In its activated state, AMPK phosphorylates ACC at Ser79, which down regulates lipid synthesis [21]. AMPK plays a critical role in energy balance through gene expression [21].The high-fat diet (HFD) induces changes in AMPK activation, which is involved in SIRT1/AMPK-mediated signaling, and expression of transcription factors Foxo1 and PGC1alpha.These expressions reduce lipid metabolism and anti-oxidative enzyme expression [22,23].
This phenomenon leads to mitochondrial loss or dysfunction, which can cause the development of metabolic diseases such as insulin resistance and diabetes. A few studies have investigated the effects of an LC diet on the activation of metabolic markers, such as AMPK and Sirt1, in skeletal muscles or adipose tissue [24]. However, little is known about the effect of an LC diet on hepatic metabolism and oxidative function.
In our previous report using non-obese mice, an LC diet was shown to influence increments of oxidative stress by reduction of hepatic SOD activity, which may affect the development of various diseases. In the present study, non-obese mice and HFD-induced mice were used to determine the effects of an LC diet according to difference in obesity conditions, including oxidative stress and metabolic state in the liver.
Material and MethodsThe following antibodies were used for western blot analysis: anti-AMPKα (#5832), anti-p-AMPK (#2535), anti-ACC (#3662) and anti-p-ACC (#3661) from Cell Signaling Technology (Danvers, MA, USA), and anti-β acting HRP conjugate (PM053-7) from Medical and Biological Laboratories (Nagoya, Japan). Primer-probe sets for mRNA quantification were purchased from Life Technologies (Carlsbad, CA, USA).
Animals and DietThirty-six 6-week-old male C57BL/6J mice were obtained from Charles River Laboratory, Inc. (Kanagawa, Japan). Mice were randomly housed with three animals per cage in a 24°C temperaturecontrolled room with a 12-hour light-dark cycle, with the lights turned on at 21:00. Mice received a control diet (16% fat diet, based on AIN-93G, D10012G; Research Diets, Inc., New Brunswick, NJ, USA) for 1 week during the acclimation period. Obesity was induced using an 8-week high-fat diet (60% fat diet, Research Diets, Inc.).
Non-obese mice were on a control diet during the same period. The obese mice and non-obese mice were sacrificed (n=6 in each group) in part at 8 weeks after initial experimental diet, and the remaining mice were divided into the following two secondary experimental diet groups: an LC diet and a control diet group. The secondary experimental diet groups were fed for 13 weeks and all experimental groups contained 6 mice. The composition of the experimental diet groups is shown in Table 1. The carbohydrate content of the experimental diets was modified using casein as a protein source. The mineral contents were adjusted to the same level in all experimental diet groups. The mice were allowed free access to food and drinking water throughout the acclimation and experimental periods. Individual mouse weights and food consumption rates per cage were recorded twice weekly. This study was approved by the Daito Bunka University Animal Experiment Committee and complied with the guidelines of the Japanese Council on Animal Research at Daito Bunka University in Saitama, Japan.
Tissue SamplingMice were anaesthetized with diethyl ether and exsanguinated through the orbital cavity. Sera were separated through centrifugation. Immediately after the mice were sacrificed, the livers and epididymal adipose tissues (EATs) were removed and weighted. The livers were homogenized with TBS containing 1% Triton X- 100, a protease inhibitor cocktail and phosphatase inhibitors (Roche Applied Science, Mannheim, Germany), and centrifuged at 5000 rpm for 15 minutes. The supernatants were removed and protein concentrations were measured using the BCA protein assay (Thermo Fisher Scientific).
Western Blot AnalysisProteins were separated with 5-20% gradient SDSPAGE using the Laemmli buffer system and then transferred to PVDF membranes. After blocking with 5% non-fat dry milk in TBS containing 0.05% Tween 20, the membranes were incubated with primary antibodies, diluted with the blocking buffer, and followed by HRP-conjugated secondary antibodies. Proteins were detected with Western lightning ECL Pro (PerkinElmer, Waltham, MA, USA) using an Image Quant LAS-4000mini (GE Healthcare Life Science, Issaquah, WA, USA).
Total RNA Extraction, cDNA Synthesis, and Real-Time PCRTotal RNA was extracted from the liver was extracted using TRIzol reagent (Invitrogen, Carlsbad, CA, USA), according to the manufacturer's protocol. The purity and concentration of total RNA were measured using a spectrophotometer at 260 and 280 nm. Subsequently, 1μg of total RNA was reverse transcribed using Superscript III reverse transcriptase (Life Technologies). Real-time PCR was carried out with SYBR Green master mix and gene-specific primers (Applied Biosystems, Foster City, CA, USA). Primer sequences are shown Table 2. The 2−ΔΔCT method was used to analyze the relative changes in each gene's expression, normalized against 18S rRNA expression. All samples were measured twice.
Statistical AnalysisResults are expressed as mean ± SEM. After a normality test, the statistical analysis was performed using the Student’s t test or the Mann–Whitney U test to compare the LC diet and control diet mice. All p values <0.05 were considered statistically significant. All statistical calculations were performed using SPSS version 19.0 (IBM, Armonk, NY, USA).
ResultsTo investigate the effects of a moderate LC diet (40% carbohydrate diet) on metabolic conditions in obese and non-obese mice, experiments were designed using HFD-induced obese mice and checked metabolic conditions. HFD-induced obesity in mice is a wellknown obese model with dysregulated metabolism of glucose and lipid levels [25-27]. Results indicated that after 8 weeks of experimental diets, the mice on HFD had heavier bodyweights and an accumulation of epididymal adipose tissues (EATs), as compared to the mice on control diet (Figure 1A, Table 3). This study confirmed obese condition susing serum biomarkers of HFD; the increase of total cholesterol, LDL-cholesterol, and triglyceride; the lowering of HDL-cholesterol; and the high levels of fasting blood glucose and insulin (Table 4). Next, the study analyzed ACC and AMPK, which play important roles by regulating lipid metabolism in the liver by phosphorylation.
Phosphorylation of ACC (p-ACC) and AMPK (p-AMPK) were down regulated in obese mice (Figure1B), which indicates that fatty acid metabolism was suppressed. From the above results, this model was used as an obese mouse model for the following experiments. For the non-obese mice, the control diet was given for the same period.
Changes in Body Weight and Weight of EATsIn obese mice, body weight and EATs accumulation were inhibited by an LC diet, although the observed significant differences disappeared after 10 weeks (Figure 2B and Table 5).Conversely, in non-obese mice, the LC diet did not affect body weight and EATs accumulation (Figure 2A and Table 5).
Serum BiomarkersIn both the non-obese and obese mice, the LC diet did not affect serum biomarker levels (Table 6). Unexpectedly, the serum insulin level was high in the obese and non-obese mice on the LC diet. This finding is contrary to previous reports [8,9].
Fatty Acid Metabolism-Related Protein in the LiverAMPK is known to regulate hepatic lipid metabolism and accumulation [17-19,21,22]. AMPK activated by phosphorylation prevents or reduces liver lipid accumulation via down regulation of ACC by phosphorylation [18-20]. Therefore, in this study, activities of hepatic lipid metabolism were analyzed from phosphorylation of AMPK and ACC. Obese mice on the LC diet had significantly up regulated ACC phosphorylation, in comparison to those on the control diet (Figure 3). In the non-obese mice, there were no differences between the mice on the LC diet and control diet; however, the mice on the LC diet tended to show down regulated phosphorylation of ACC and AMPK (Figure 3).
Metabolism and Oxidation-Related mRNA Expression in the LiverIn the obese mice, the LC diet decreased hepatic mRNA expression of Sod1Sod1 and GPX1 related to fatty acid oxidation, and Fabp4 related to fatty acid synthetic transport. Sirt1, an upstream factor of these genes, had remarkably high expression (Figure 4B). In the nonobese mice, there were no differences in the hepatic mRNA expressions between the mice on the LC diet and the control diet. However, Sod1 expression tended to be lower in the mice on the LC diet (Figure 4A).
DiscussionFor the first time, this study has demonstrated that the effects of a moderate LC diet vary according to obesity status, with a specific focus on hepatic lipid metabolism. Improvement of lipid metabolism after an LC diet was demonstrated only in obese mice, through regulations of genes and proteins related to lipid metabolism that changed with obesity (Figure 3 and 4). In addition, this study showed a high possibility of oxidative stress increased by an LC diet irrespective of obesity condition (Figure 4). The results also highlight the risks of an LC diet and could lead to the development of safer diet therapy for obesity-related diseases. This study focused on the analysis of hepatic lipid metabolism. Obesity causes abnormal lipid metabolism through changes in fatty acid synthesis and oxidation via dysregulation by AMPK and the Sirt1 co-activated pathway [18,22,23], which are activated by caloric restriction, exercise and antioxidant treatment [28,29]. AMPK inhibits ACC activity by phosphorylation, resulting in the suppression of fatty acid synthesis; this could provide a new strategy for the management of obesity-related liver disease [18,19,21,22]. The experimental obese mice model developed using HFD had significantly up regulated ACC activities by low phosphorylation, showing an increase in fatty acid synthesis (Figure 1B).
ACC activity was inhibited by the LC diet only in the obese mice. In addition, obesity is known to decrease SIRT1expression and influences downstream lipogenic genes, such as Pgc1a and Fabp4 [30]. In the obese mice, Sirt1 was markedly increased by the LC diet. Hepatic Fabp4, apogenic gene-associated transportation with up regulation by obesity [31], were also inhibited by the LC diet only in obese mice. These findings suggest that an LC diet could improve lipid metabolism, similar to the effects of exercise, only when administered in conjunction with abnormal obesity symptoms. This notion is supported by the present study, which shows that the LC diet in non-obese mice, as a normal metabolism condition, did not promote lipid metabolism (Figure 3 and 4). Even in previous reports investigating the effects of long-term LC diet adoption in obese subjects, results have demonstrated that LC diets inhibit body weight gain and promote blood glucose control, which leads to improvements in obesity and metabolic disorders [1,9,11].
The effects of the LC diet have generally been focused on obese and diabetic conditions, and the diet has been shown to have a positive effect, such as loss of body weight, and the regulation of blood glucose and lipid levels [6-9]. As previously mentioned, the LC diet is likely to improve obesity and obesity-related diseases. Conversely, in the non-obese mice, there is a tendency for the decrease of both phosphorylated AMPK and ACC as a result of an LC diet (Figure 3), suggesting that the LC diet can increase the risk of hepatic lipid synthesis. The LC diet has also been reported to be involved in metabolism effects depending on age [32,33]. The nonobese mice aged 14 weeks experienced no inhibitory effects of bodyweight by the LC diet. However, our previous study showed an inhibitory effect of bodyweight due to the LC diet in young mice aged 8 weeks (Figure 2A). Further detailed analysis of the effects of an LC diet in the non-obese state, including influence on age and hepatic metabolism, is necessary in the future.
The hepatic gene results demonstrated that antioxidant genesSod1 and Gpx1were reduced by the LC diet in both the obese and non-obese mice (Figure 4). Down regulation of Sod1 and Gpx1 cause oxidative stress, which plays a critical role in the pathogenesis of various diseases? Increased hepatic oxidative stress induces the pathophysiology of the fatty liver [34]. In our previous report, an LC diet was shown to decrease the anti-oxidant enzyme in non-obese conditions [10]. Large longitudinal studies have indicated that long-term intake of an LC diet is associated with an increased cardiovascular disorder involving oxidative stress [12,33]. In addition, studies have proven that LC diets can increase the risk of liver oxidative stress, especially in obese mice. The development of non-alcoholic steatohepatitis is common in obesity [34], and is induced by Sod1 reduction in the liver accompanied by an increase in other apogenic genes [30]. An LC diet may affect hepatitis episodes; therefore, a more detailed study is needed to better understand LC diet safety, including oxidative stress.
ConclusionThis study demonstrates a new perspective on the effects of an LC diet, which varies according to obesity conditions. When confined to obese conditions, the LC diet is expected to have the same effect as exercise, including weight control, improvement of liver lipid metabolism, and improvement of obesity-related disease via Sirt 1. Further investigation is necessary to better understand influence of LC diet on oxidative stress and its effect in non-obese conditions.
Conflict of InterestThe authors declare that they have no conflicts of interest with the contents of this article.
Author ContributionsTK prepared figures, and wrote draft the manuscript. TK conceived the idea for the project and designed experiments. SK conducted most of the experiments. All authors interpreted the results, commented on the manuscript, and approved submission of the manuscript.
AcknowledgementsWe thank Dr. Satoru Oshiro for the great technical advice. This work was supported by the Japan Society for the Promotion of Science (Grant-in-Aid for Scientific Research (C) to T. K. [grant number 15K00885]).
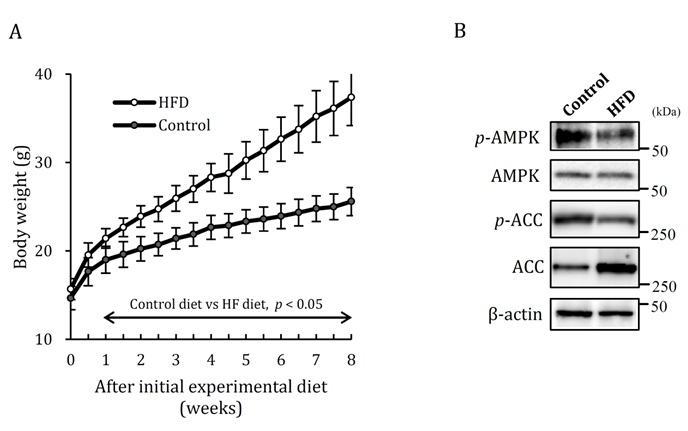
Figure 1: Induction of obese mice by 8weeks of HFD.
A. Change of body weight. B. Hepatic fatty acid metabolism analyzed on expression of p-AMPK and p-ACC. HFD: high-fat diet, Control: control diet. Data shown are the mean ± SEM.
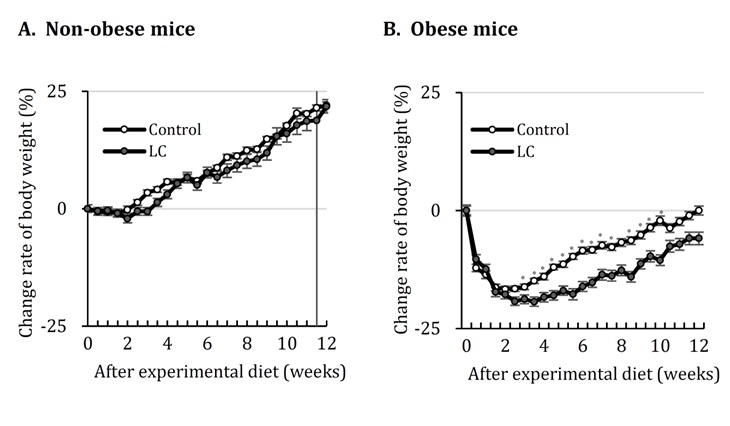
Figure 2: Change rate of body weight in obese and non-obese mice fed LC diet. A. Non-obese mice. B. Obese mice. Control: control diet, LC: low-carbohydrate diet EATs: epididymal adipose tissues. Data shown are the mean ± SEM. *p < 0.05 vs Control by Student’stest.
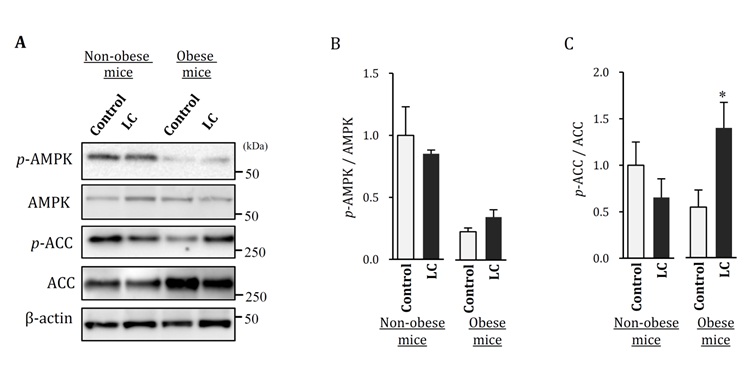
Figure 3: Hepatic fatty acid metabolism analyzed on expression of p-AMPK and p-ACC in obese and non-obese mice fed LC diet.
A. p-AMPK and p-ACC expression were determined by western blot analysis.
B. p-AMPK signal intensity of the bands in the western blot was quantified and shown as a graph.
C. p-ACC signal intensity of the bands in the western blot was quantified and shown as a graph. Control: control diet, LC: lowcarbohydrate diet, Data shown are the mean ± SEM. *p < 0.05 vs Control by Student’s-test.
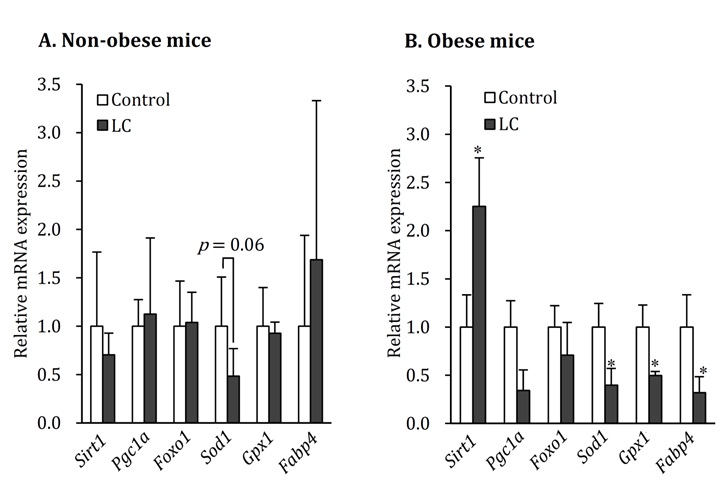
Figure 4: Hepatic mRNA expression in obese and non-obese mice fed LC diet. Control: control diet, LC: low-carbohydrate diet. Data shown are the mean ± SEM. *p < 0.05 vs Control by Mann-whitney Utest.
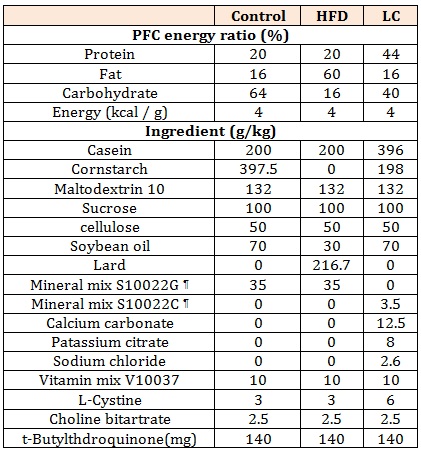
Table 1: Composition of experimental diets.
¶ Research Diet, Inc.
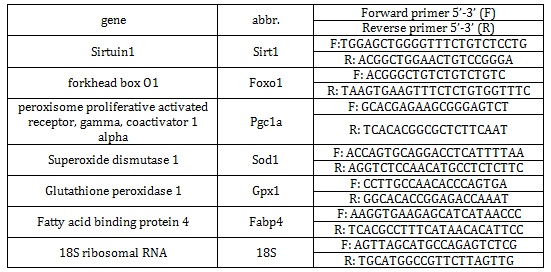
Table 2: Real-time PCR primers used.

Table 3: Final body weight and EATs weight in mice fed Control and HFD.
Control: control diet, HFD: high-fat diet, EATs: epidydimal adipose tissues. Data shown are the mean ± SEM. **p < 0.01 vs control diet.
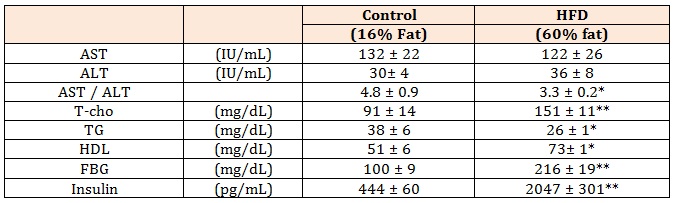
Table 4: Levels of serum biochemical markers in mice fed Control and HFD.
Control: control diet, HFD: high-fat diet, AST: aspartate transferase, ALT: alanine transferase, T-cho: total cholesterol, TG: triglycerides, HDL: high density lipoprotein, FBG: fasting blood glucose. Data shown are the mean ± SEM. *p < 0.05, **p < 0.01 vs control diet by Student’s-test.
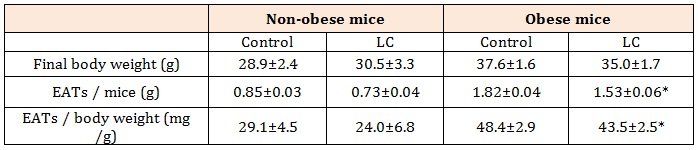
Table 5: Final body weight and weight of EATs in non-obese and obese mice fed LC diet.
Control: control diet, LC: low-carbohydrate diet, EATs: epididymal adipose tissues. Data shown are the mean ± SEM.
*p < 0.05 vs control diet by Student’s-test.
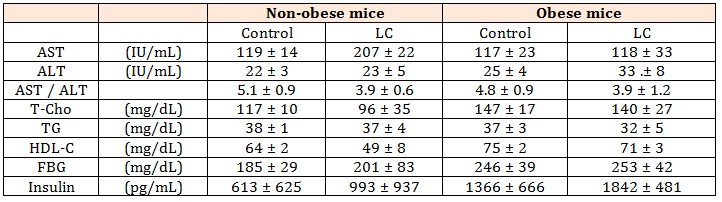
Table 6: Levels of serum biochemical markers in obese and non-obese mice fed LC diet.
Control: control diet, LC: low-carbohydrate diet, AST: aspartate transferase, ALT: alanine transferase, T-cho: total cholesterol, TG: triglycerides, HDL: high density lipoprotein, FBG: fasting blood glucose. Data shown are the mean ± SEM.