
Citation: Ekezie J, et al. A Study of Correlations and Estimation of Stature from Foot Trace and Shoe Trace Dimensions. Int J Forens Sci 2016, 1(3): 000113.
*Corresponding author: Ekezie Jervas, Department of Anatomy School of Basic Medical Sciences, Federal University of Technology, Owerri, Nigeria, Tel: +234 806 5430037; Email: ekeziejervas@gmail.com
In crime investigations, Forensic experts may be left with only foot prints or shoe print or even shoes left at the scene to carry out their investigations. In the present study, an attempt was made to derive regression formula to determine stature using foot trace dimensions and shoe trace dimensions of randomly selected persons from a pull of 211 subjects age 16 - 45 years belonging to the Igbo ethnic group of Nigeria. The mean stature of the population was 167.55±9.10cm. Males were significantly taller than the females (p< 0.0001). In sexing the population, all the variables obtained for the right foot trace and the right shoe trace dimensions were statistically significant, p<0.0001. The highest positive correlation was observed in shoe length trace (SLT), r = 0.605 while the least was observe in forefoot width trace (FFWT) r = 0.253 in both sexes put together. The best simple linear regression model was developed using SLT in both sexes put together as well as in females. This has the highest value for the multiple correlation coefficients, R as 0. 605 with a 6.670 standard error of estimate (SEE) for both sexes put together. Regression equation was also generated using foot length trace (FLT/MFLT) in males but not in females. Conclusively SLT performed better than FLT/MFLT.
Keywords: Stature; Correlations; Foot Trace; Shoe Trace
The wicked nature of some men and their criminal activities in most places of the world has subjected the affected individuals into emotional trauma and financial difficulties. Sometimes the human bodies are also subjected into fragments and these possess a problem to the medico-legal experts. Such activities are done by criminals who mutilate the human body in order to destroy any possible means of identification; consequently their aims are perpetuated. Most times the human fragments are not even seen at the crime scene. The evidence that suspects leave at a crime scene is a veritable tool in crime dictation. Such evidences include footprints, shoe prints and even shoe. This has lead researchers to regress stature on foot length [1-4], footprints and individualistic characteristics of the prints [5] because the former could be predicted from foot dimensions, footprints and shoe prints. Critical examination of materials/items such as hair particles, blood spots and hand prints left at crime scene also provide important evidence in crime investigation when experts are confronted with many suspects. Such evidences will help in the identification of the individuality of the persons involved. To our knowledge estimation of stature using shoe trace/prints and foot prints/traces have not been carried out in our environment. It was against these backdrops that this study was carried out to generate regression equations and reference data that will assist in crime dictation.
Materials and MethodsThe study was based on a random sampling of some shoes and foot from a pull of 211 subjects age 16 - 45 [6] and attention was paid on the correlations and estimation of stature from foot trace and shoe trace dimensions after informed consents were given by the subjects. The participants were from Igbo extraction in Nigeria [6]. Igbo are one of the three major ethnic groups (Hausa, Yoruba, and Igbo) in Nigeria. They live in villages, towns and cities scattered over the Eastern part of Nigeria, South of the River Benue and East of River Niger, which is in the rain forest belt of the country [6].
Study locationThis study was conducted in Imo State, Nigeria and it took eight (8) months to be completed.
DemographicsThe following demographic information was collected: age, sex, and state of origin in order to establish variability within populations.
Exclusion criteriaPregnant women and subjects with musculo-skeletal disorder affecting body height and lower limb were excluded from this very study. Subjects with high heeled shoes were also excluded.
Inclusion criteriaOnly participants from the Igbo extraction of Nigeria with flat/low heeled shoes and who were apparently healthy were included in the study.
AnthropometricsStature (S): The height was measured to the nearest 0.1cm using an Anthropometer with subjects standing without shoes with the heels held together, toes apart, and the head held in the Frankfort plane [7].
Estimation of stature from footraceFoot trace measurement: The subjects were asked to remove his or her shoe and sock. The right bare foot of the subjects was traced using a pen on the opposite side of a white paper. See figure 1 for the right foot trace and figure 2 for the left foot trace.
The foot trace dimensions were then taken from the outlines of the foot using sliding caliper or a transparent ruler as follows.
During the foot tracing, the participants were asked to stand firm without shoes.
Estimation of stature from shoe traceShoe traces measurements: The participants were asked to stand firm with the shoe and the shoes were also traced. The following measurements (see figure 3 and 4) were taken:
The analysis of the present data was carried out using statistical package for social sciences (SPSS 17.0 software). Initially for summarizing the data, the Minimum, Maximum, Mean and Standard deviations were estimated and presented. A comparison of difference of variable in females and males was also performed. Pearson correlation was applied to test the relationship between stature and various measurements from foot trace, and shoe trace. The results are presented separately for Sexes together, Males and Females. The prediction function was derived through linear regression for each of the measurement with stature for the overall population, males and females separately. The presentation also provides the values of Constant, Regression coefficient, Percentage variation explained (R2) and Significance of regression coefficient. The multiple linear regression models [10] with the explanatory variables or repressors’- foot trace and shoe trace dimensions was proposed as a statistical model to explain the total variation. In the results that follow, R indicates the regression coefficient value. It is one of the measures used for model adequacy. R is defined as the correlation between the observed values and the fitted values for the dependent variable. R2 explains the percentage that a dimension contributes to the variation in the dependent variable (height). R2adjusted is used to compare the regression models containing different number of explanatory variables. The standard error of estimate (SEE) refers the error that may arise from estimating stature. It tends to predict the deviation of estimated stature from the actual stature. A low value is indicative of the greater reliability of prediction from a particular measurement while a higher value denotes less reliability of prediction [11]. The best model (simple linear regression model or multiple linear regression model) for each of the female, male and both sexes together is chosen according to the values of the coefficient of determination R2 or adjusted R2 (R2adjusted), [12] or multiple correlation coefficient.
ResultsThe descriptive statistics for estimation of stature using right and left foot traces in both sexes is shown in table 1 while the descriptive statistics for the females and males samples are shown in tables 2 and 3 for the right footrace dimensions and right shoe trace dimensions. (Table 3) shows the descriptive statistics for estimation of stature using the left footrace dimensions and left shoe trace dimensions in females and males. We can see the standard deviation, mean, maximum and minimum values of the variables.
In sexing the population, all the variables obtained for the right foot trace and the right shoe trace were statistically significant (p<0.0001). These significant values were higher for the males (Table 4).
(Table 5) shows the comparison of difference of variable in females and males for the left foot trace and left shoe trace dimensions. All the variables showed statistically significant differences between the females and the males, with females having a lower mean value than males.
The correlation coefficient between stature and the right foot trace and between stature and the right shoe trace in both sexes was found to be statistically significant and positive, indicating a strong relationship between stature and right foot trace as well as between stature and the right shoe trace dimensions, except for MFWT. The highest positive correlation was observed in SLT, r = 0.605 while the least was observe in FFWT r = 0.253 (Table 6). The correlation coefficient between stature and the left foot trace, and between stature and the left shoe trace in both sexes was found to be statistically significant and positive, indicating also a strong relationship between stature and left foot trace as well as between stature and the left shoe trace dimensions, but there was no significant correlation between stature and FFWT as well as between stature and MFWT. The highest positive correlation was observed in SLT, r = 0.587 while the least was observe in LFLT, r = 0.310 (Table 6).
For the females, the only significant correlation obtainable was observed in the SLT r = 0.322, using dimensions from the right sides (Table 7). In the male population, significant and positive correlation was established between stature and FLT/MFLT, r = 0.367 and between stature and LFLT, r = 0.336 on the right side (Table 7).
For the females, positive significant correlation was observed in SLT and FSWT, r = 0.339 and 0.431 respectively, (Table 8). In the male subjects, significant and positive correlation was established between stature and FLT /MFLT, r = 0.450, p< 0.001 and none for the rest of the variables (Table 8 above). The Constant, Regression coefficient and Variation explained (R2) derived for each of the right foot trace and right shoe trace measurements with stature as well as between stature and left foot trace and left shoe trace measurements are shown in table 9, for both sexes put together. The values indicate that the least constant (110.222) was obtained in FLT while the highest (145.493) was obtained in MSWT on the right side. The regression coefficients were highly significant indicating that they are contributing for the prediction of stature. The variation explained (R2 x 100) showed that it ranges from 6.4% to 36.5 % in both sexes. The best prediction power was observed in SLT in both sexes. On the left side the values indicate that the regression coefficients were highly significant meaning that they also contributed for the prediction of stature. The variation explained (R2 x 100) showed that it ranges from 9.6 % to 38.5 %. The best prediction power was observed when SLT and FSWT were combined in both sexes, see table 9. For the males the variation explained ranged from 11.3% to 13.4%, with the FLT having the best prediction power. In the females, SLT contributed 10.4% to the variation explained (Table 10).
In the females, with regards to left side dimensions, the best prediction power was observed in FSWT which contributed 18.6% while SLT contributed 11.5% to the variation explained (Table 11).
In the males only FLT/MFLT contributed 20.02% to the variation explained (Table 11).
(Table 12) represent the values for R, R2, Adjusted R2, and SEE of foot trace and shoe trace dimensions in both sexes, right and left sides. The best simple linear regression model was developed using SLT and this has the highest value for the coefficient of determination R2 as 0.365, R2Adjusted as 0.356 and multiple correlation coefficient R as 0.605 with a 6.67 SEE. The SEE gotten is lower when compared with the SEE of the other variables in both sexes together. With regards to the left foot trace and the left shoe trace variables in both sexes together, the best simple linear regression model was developed using SL trace and this has the highest value for the coefficient of determination R2 as 0.345, R2 Adjusted as 0.335 and multiple correlation coefficient R as 0.587 with a 6.778 SEE. On the other hand, the best multiple linear regression model was developed using SLT trace and FSWT trace combined, and this has the highest value for the coefficient of determination R2 as 0.385, R2 Adjusted as 0.366 and multiple correlation coefficient R as 0.621 with a 6.62 SEE. This SEE gotten is lower when compared with the SEE of the other variables in both sexes together (Table 12).
(Table 13) represents the values for R, R2, Adjusted R2, and SEE of the right and left foot trace as well as the right and left shoe trace dimensions in females and males.
In the females, only one simple linear regression model was developed using SLT trace and with the values for the coefficient of determination R2 as 0.104, R2 Adjusted as 0.079 and multiple correlation coefficient R as 0.322 with a 4.804 SEE.
In the males, two simple linear regression models was developed using FLT/MFL trace and LFL trace on the right side.
In the females, two simple linear regression models were developed using SLT and FSWT respectively. SLT has its values for the coefficient of determination R2 as 0.115, R2Adjusted as 0.090 and multiple correlation coefficient R as 0.339with a 4.770 SEE , while FSWT has R2 as 0.186, R2Adjusted as 0.163 and multiple correlation coefficient R as 0.431 with a 4.576 SEE. In the males, only one simple linear regression models was developed using FLT/MFL and the values of SEE gotten was 7.191 the left traces dimensions (Table 13).
Using all possible simple and multiple regression analysis, the best linear regression equation for both sexes together is Statureboth sexes =116.337 +1.824(SLT) While for the females the only linear regression equation developed is Staturefemale’s right shoe trace =141.402 + 0.784(SLT), (Tables 14 and 15). The two simple linear regression equations constructed for the male subjects are Staturemale’s right foot trace = 123.712 + 1.859(FLT) and Staturemale’s right foot trace = 129.393 + 1.949(LFLT) respectively. On the left side, the best regression equation generated for both sexes together is Statureboth sex =113.639 + 1.278(SLT) + 1.810(FSWT). Stature could also as be estimated by using other dimension of the right or left foot/shoe trace in both sexes, the regression equations generated are shown in (Table 14). For the females, the best linear regression equation developed is Staturefemale’s left shoe trace = 143.056+2.025(FSWT) while that developed for the males is Staturemale’s left foot trace =109.446 + 109.446(FLT), (Table 16).
DiscussionSeven right and left footrace and shoe trace measurements including stature of the subjects were taken. The prediction function was derived through linear regression and multiple regressions for each of the measurement with stature, for the general population and for males and females separately. The mean right foot length trace and right shoe length trace for both sexes together was 25.47 ± 1.68 cm and 27.30 ± 2.75 respectively. For the left side, the value for foot length trace was 25.55 ± 1.76cm and that of shoe length trace was 27.30± 2.66cm. Generally, the value of shoe length trace was higher than that of foot length trace. This should be expected because in the making of shoes, shoe industries normally give allowance to accommodate the foot. In sexing the population, all the variables obtained for the right foot trace and the right shoe trace were statistically significant p<0.0001. These significant values were higher for the males than the females. This is expect because males are generally taller and have higher anthropometric values than females. Sexual dimorphism in foot length has been established. These findings are useful in shoe design and selection of shoe sizes and to forensic anthropometry [13]. Females’ foot length has been reported to be consistently smaller than that of the males [3]. Also in support of this, is the work by [15] who noted that in all anthropometric parameters calculated male were significantly higher than the females. Seeking to provide tools for forensic investigation, [15] collected both foot outlines and foot prints from the left and right feet of 527 US subjects age 14 and over. As a proportion of stature, their study revealed that males were larger in both foot length and footprint than females. Also [16], an ergonomist interested in shoe design, found that males’ foot length as a proportion of stature was significantly larger than the same ratio in females [17]. Collected footprints from London subjects and observed that female prints were proportionately smaller at a high level of significance [18]. Analyses data on right foot length and stature from US soldiers and reported that males’ foot length was proportionately larger than that of the females. The correlation coefficient between stature and the right foot trace, and between stature and the right shoe trace in both sexes was found to be statistically significant and positive, indicating a strong relationship between stature and right foot trace as well as between stature and the right shoe trace dimensions, but there was no significant correlation between stature and mid-foot width trace (MFWT). The highest positive correlation was observed in shoe length trace (SLT). In the male population, significant and positive correlation was established between stature and foot length trace and between stature and lateral foot length trace (LFLT). The findings of this research have the implication that shoe length trace and foot length traces are importance tool in stature estimation.
By applying all possible simple and multiple regression analysis, the best linear regression equation for both sexes together is Stature =113.639 + 1.278(SLT) + 1.810(FSWT) that is by using two variables. When one variable was applied, the best regression equation for both sexes together is Stature =116.084 + 1.8333(SLT). For the females, the best linear regression equation developed is Stature =139.801 + 0.843(SLT) while that developed for the males is Stature =109.446 + 109.446(FLT). Stature could as well be estimated using other dimension of the left foot/shoe trace in both sexes, the regression equations generated are as in the table for left foot/shoe trace parameters. In support of these present findings is the report by [19] who revealed regression methods for estimating stature from length and breadth of foot print in the adult south Indian population and concluded that there is significant degree of correlation between footprint length and stature of both sexes between 22 to 30 years. In a study using Indian subjects, measurement of the maximum footprint of the right foot was applied in predicting stature. The predicted value was then compared with the actual stature of the subject. The result obtained indicated less error in predicting stature as compared to other conventional methods [20]. Qamra et al. [21] measured height, foot length and foot breadth of 1015 healthy adults between 17 to 32 years of age to develop methods for reconstructing height from foot measurements. A good correlation of height was observed both with foot length (male: r= 0.69 and female: r= 0.70) and foot breadth (male: r=0.42 and female=0.47). In our present study, a good correlation was noted between stature and foot trace dimension (both sexes r= 0.420, male: r= 0.367) and between stature and shoe trace dimensions (both sexes r= 0.605, female r= 0.322). Philip Abraham [22], in his study attempted to develop regression equations for estimation of stature from foot outlines and footprints of 618 subjects ranging between 20 and 32 years of age when the stature of an individual was said to remain steady. In his study the measurements of all toe lengths in each set was first correlated with the stature of the individual. The maximum toe lengths alone were also correlated to obtain the results. His study revealed a high degree of significant correlation between measurements of toe lengths and stature.
Giles and Hutchinson stated that foot length displays a biological correlation with height. Height can be estimated from foot when such evidence provides an investigator the best or only opportunity to gauge that aspect of a suspect’s physical description. Their study was intended to determine percentages and linear regressions for determining height from foot length for young adult males and females based upon very large U.S Army Anthropometric database [23]. In recent times, [24] estimated height from measurements of foot length in Gujarat rejoin of India. Measurement of foot length and body height of 502 students aged 17-22 was taken. The data obtained was analyzed and they made attempt to find out correlation and to derive a regression formula between foot length and height. Their result showed a strong correlation between height and foot length; if one of the measurement (foot length or total height) is known, the other could be calculated. This also agrees with our findings. In yet another study, the estimation of stature and determination of sex through foot measurement was performed. Anthropometric measurements used include: length, width, malleolar height, navicular height measurements of the right and left feet as well as the stature from 249 subjects. From the research, it was observed by the researchers that while stature estimation dependent on the gender yielded 9 – 10cm errors, those that were independent on sex helped to make stature estimation with less than 4cm errors.
The study hence concluded by suggesting that stature estimation can be obtained using foot measurements [25]. The foot dimension/measurement used in stature estimation has also been repoted to vary according to sex. Kanchan et al. [26] examined the relationship between stature and foot dimensions among Gujjars in India. In the study, stature, foot length and breadth of 200 subjects comprising of 100 males and 100 females were measured.
The study showed that bilateral variation for all measurements except for the foot breadth in males were insignificant. The study also showed that sex differences were highly significant for all the measurement and that the correlation coefficient between stature and the foot measurements were highly significant. More importantly, the study stipulated that the foot length provides the highest reliability and accuracy in stature estimation in males while the foot breadth provides the highest reliability and accuracy in stature estimation in females. Krishan [27], studied footprints and outline of Indian subjects and noted significant correlation coefficient between stature and various measurements of footprints and foot outline. Their study also showed a close relationship between stature and toe length measurement. The above is in support of our findings since foot trace dimensions gotten in our study showed significant correlation with stature.
ConclusionThis very study has established correlation between stature and foot trace dimensions as well as between stature and shoe trace dimensions. Shoe length trace performed better than foot length trace in the estimation of the stature of the population under study because of the value of R2 and SEE obtained.
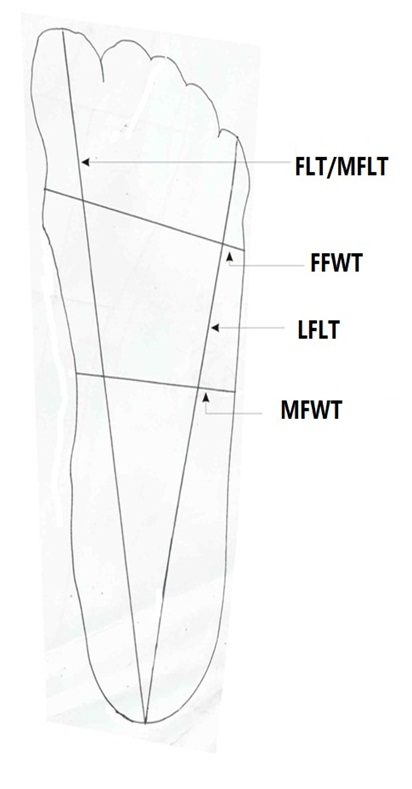
Figure 1: Measurement of right foot trace dimension.
FLT/MFLT: Foot length trace/Medial foot length trace, MFWT: Mid foot width trace.
FFWT: Forefoot width trace, LFLT: Lateral foot length trace.
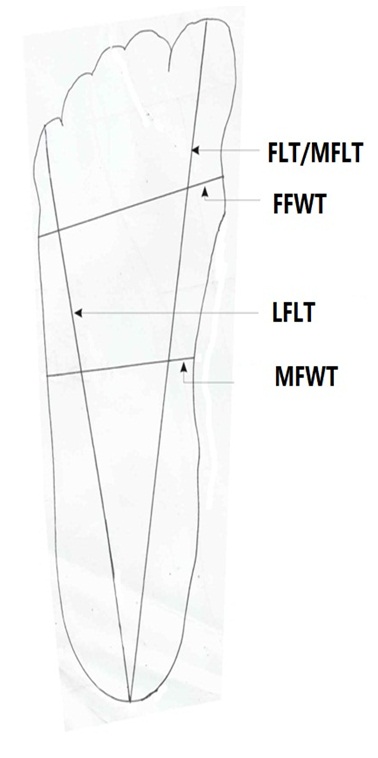
Figure 2: Measurement of left foot dimension.
FLT/MFLT: Foot length trace.
FFWT: Forefoot width trace.
MFWT: Mid foot width trace.
LFLT: Lateral foot length trace.
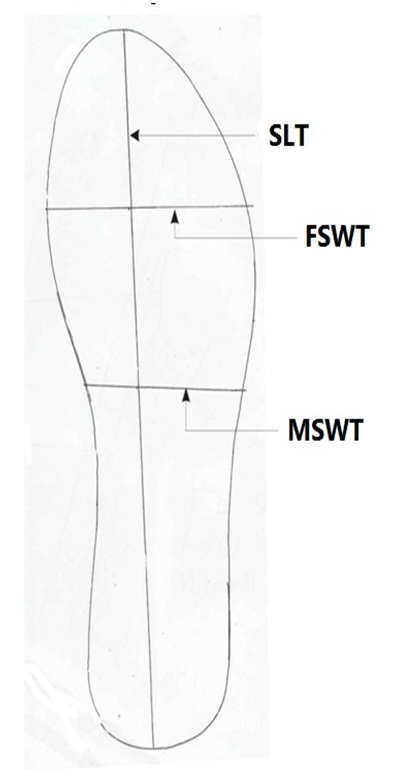
Figure 3: Measurement of right shoe trace dimension.
SLT: Shoe length trace.
FSWT: Fore shoe width trace.
MSWT: Mid shoe width trace.
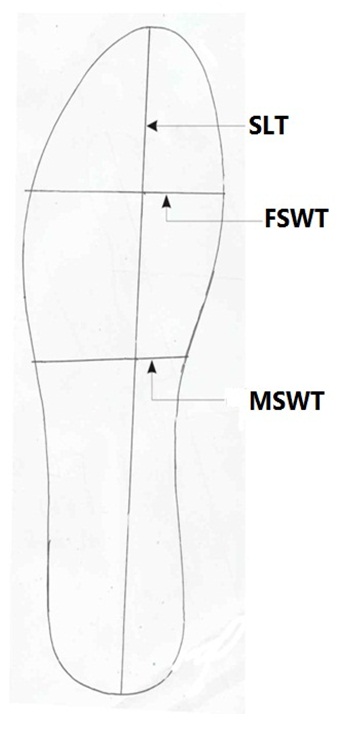
Figure 4: Measurement of left shoe dimension.
SLT: Shoe length trace.
FSWT: Fore shoe width trace.
MSWT: Mid shoe width trace.
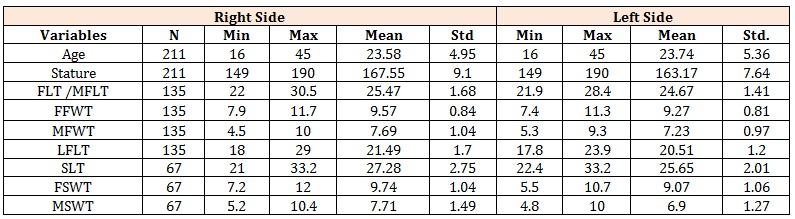
Table 1: Descriptive statistics of the study population (both sexes), foot trace and shoe trace dimensions (cm).
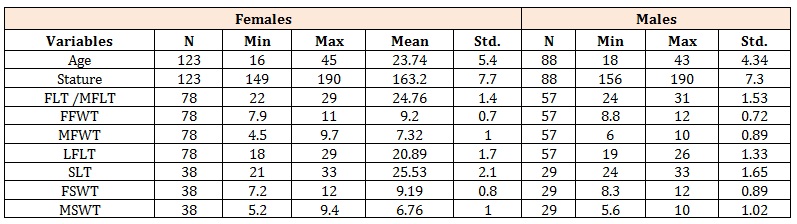
Table 2: Descriptive statistics of females and males for the right foot trace and right shoe trace dimensions
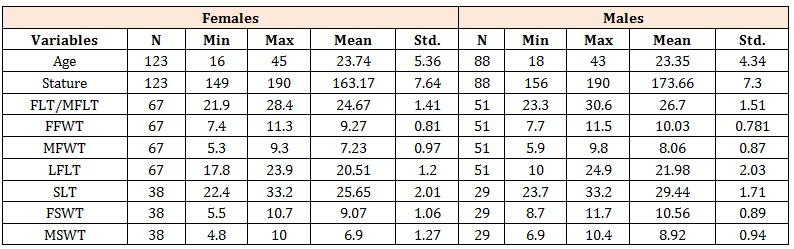
Table 3: Descriptive statistics of females and males for left foot trace and left shoe trace dimensions.
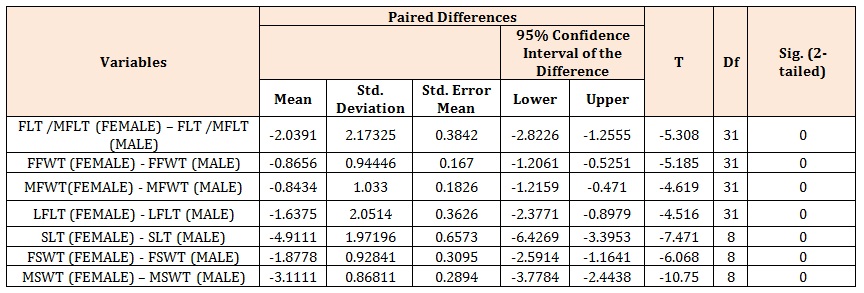
Table 4: Comparison of difference of variable in females and males for right foot trace and right shoe trace dimensions.
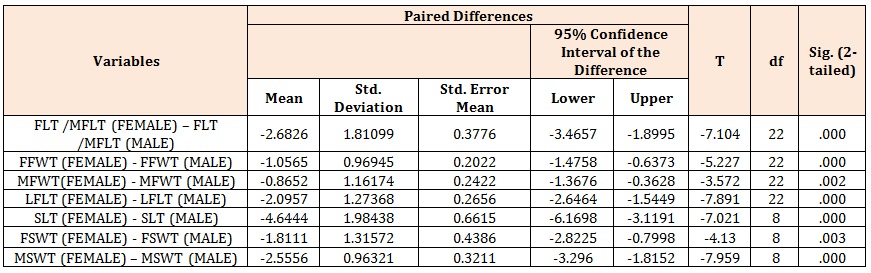
Table 5: Comparison of difference of variable in females and males for the left foot trace and left shoe trace dimensions.
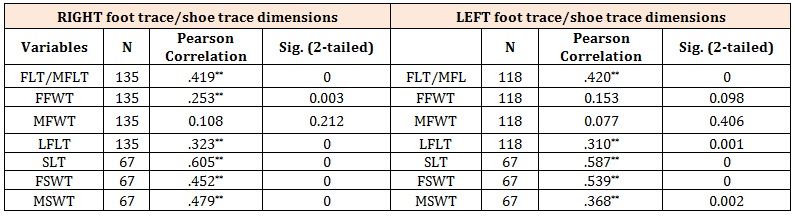
Table 6: Pearson correlation between stature with foot traces and shoe traces (right and left) dimensions in both sexes.
* Correlation is significant at the 0.05 level (2-tailed), ** Correlation is significant at the 0.01 level (2-tailed).
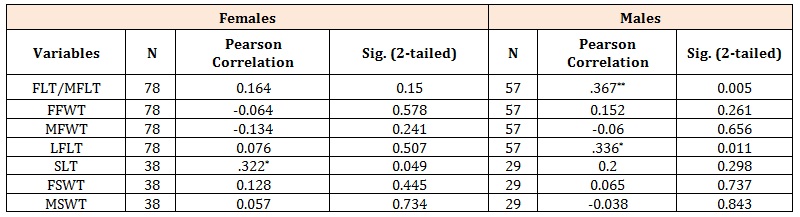
Table 7: Pearson correlation between stature with right foot trace and right shoe trace dimensions in females and males.
* Correlation is significant at the 0.05 level (2-tailed), ** Correlation is significant at the 0.01 level (2-tailed).
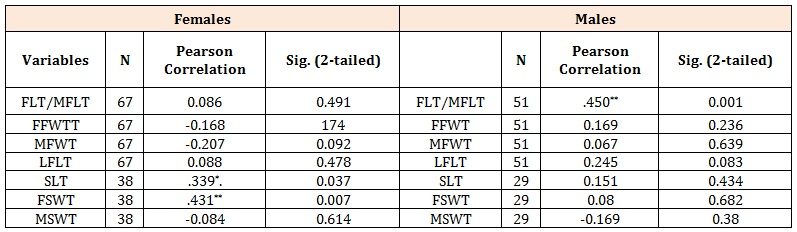
Table 8: Pearson correlation between stature with left foot trace and left shoe trace dimensions in females and males.
* Correlation is significant at the 0.05 level (2-tailed) ** Correlation is significant at the 0.01 level (2-tailed).
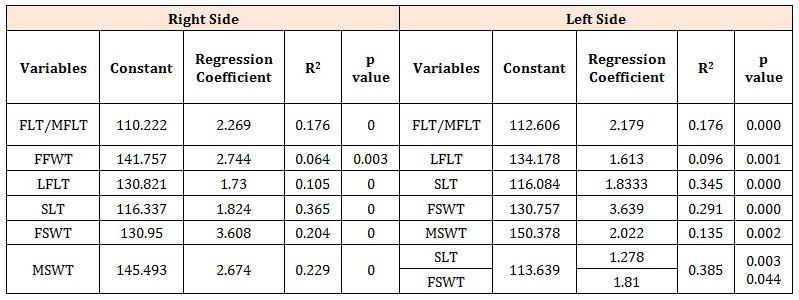
Table 9: Constant, Regression coefficient and Variation explained (R2) of both right and left foot trace and shoe trace dimensions in both sexes.
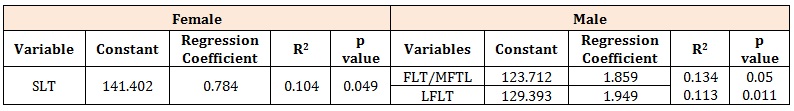
Table 10: Constant, Regression coefficient and Variation explained (R2) of right foot trace and right shoe trace dimensions in females and males.
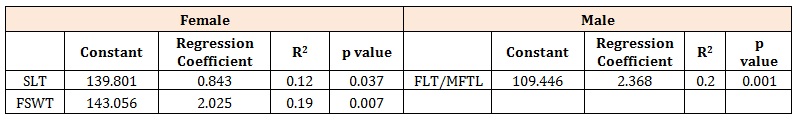
Table 11: Constant, Regression coefficient and Variation explained (R2) of left foot trace and left shoe trace dimensions in females and males.
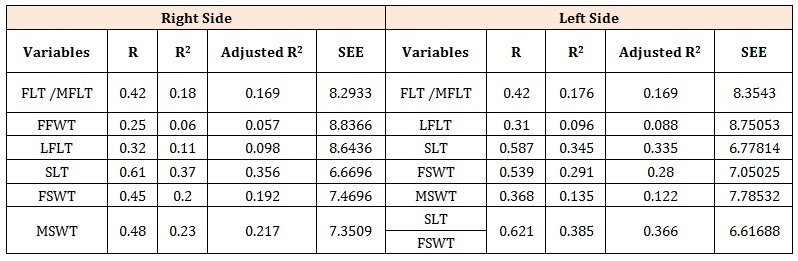
Table 12: R, R2, Adjusted R2, and SEE of foot trace and shoe trace dimensions for both sexes, right and left sides.
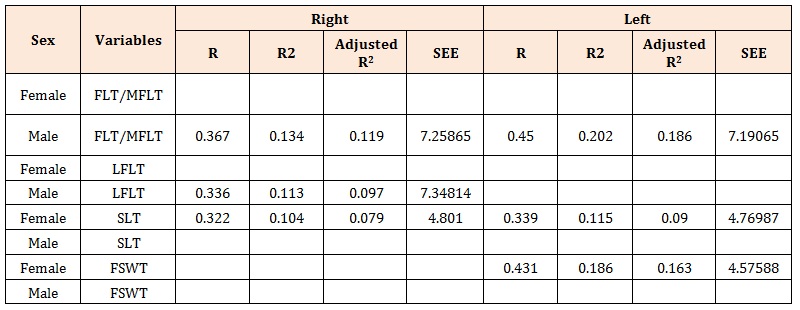
Table 13: R, R2, Adjusted R2, and SEE of the right and left foot trace and shoe trace dimensions in females and males.
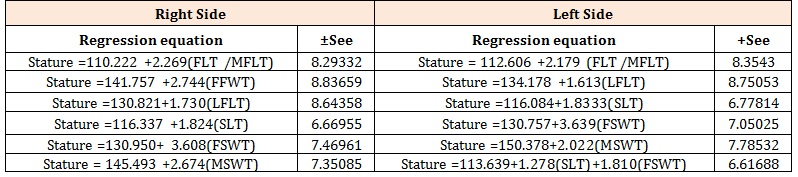
Table 14: Regression Equations for estimation of Stature in both sexes using foot trace and shoe trace dimensions from right and left sides.
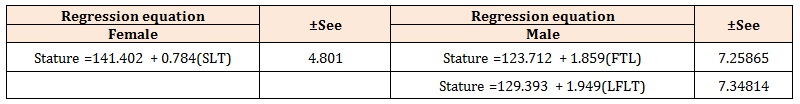
Table 15: Regression Equations for estimation of Stature in females and male using right foot trace and right shoe trace dimensions.
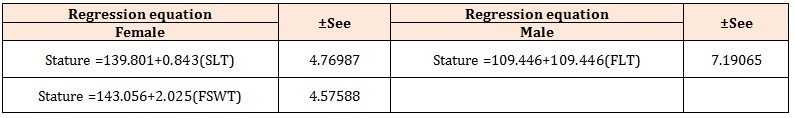
Table 16: Regression Equations for estimation of Stature in females and male using left foot trace and left shoe trace dimensions.