Citation: Burrow JG. A Comparison between Manual and Digital Measurements in Exemplar Bare Footprint Analysis. Int J Forens Sci 2017, 2(1): 000116.
*Corresponding author: Burrow J, Glasgow Caledonian University, 4 Bore Brae, Newmilns, Ayrshire, KA16 9EJ, United Kingdom, Tel: 01560 322753; Email: gordon.burrow@btinternet.com
This study examined the role that bare footprint collection and measurement processes have on the Reel method of measurement in forensic podiatry and its use in the Criminal Justice System. Previous research suggested the Reel method of linear measurements was a valid and reliable measurement system for bare footprint analysis. Various collection systems have been used by studies to collect footprint data and both manual and digital measurement processes were utilized in forensic podiatry and other disciplines. This study contributes to the debate about collecting bare footprints; the techniques employed to quantify linear measurements and considered whether there were any differences between the methods of measurements employed. An inductive, quantitative paradigm used the Inkless Shoeprint Kit gathering procedure for footprint collection and the subsequent dynamic footprints subjected to Adobe Photoshop techniques of calculating the Reel linear variables as well as the traditional manual method of using a ruler and pen on an acetate sheet overlaid the original footprint. Statistical analyses using Paired-sample t tests were conducted to test hypotheses and compare data sets. Standard Error (SE) showed variation between feet and the findings provide support for the Reel study and measurement method. The study also suggests little difference between measurements using the two measurement methods although the digital system is preferred as it allows traceability of all aspects of the process compared to that of the manual method also allowing greater precision of measurements which may be required in the criminal justice system.
Keywords: Footprint data; Dry shoes; Forensic podiatrists
Forensic podiatry uses the skills and attributes of the podiatry profession applying these attributes and specialized knowledge to the development of evidence through scientific and technical investigation to assist courts in resolving questions of fact in civil or criminal trials. According to Vernon and McCourt [1] forensic podiatry is: “the application of sound and researched podiatry knowledge and experience in forensic investigations, to show the association of an individual with a scene of crime, or to answer any other legal question concerned with the foot or footwear that requires knowledge of the functioning foot”. Practically, forensic podiatrists help with identification or elimination of suspects of crime from footprints, footwear and gait features. The role and scope of forensic podiatry has now been clarified and agreed by the International Association of Identification [2], whilst the Standards for Forensic Podiatry are currently being developed under the auspices of the Special Advisory Group of the College of Podiatry in the United Kingdom in association with the Forensic Science Regulator in the United Kingdom.
When someone walks into a room, they do not think about the footprints they leave. Unless that person has walked through mud or rainwater and makes a mess, it's nearly impossible to see the traces left by each step. Clean, dry shoes leave an impression on a hard surface through the creation of electrostatic charges. Applying fingerprint dusting powder over recent footprints attracts the powder to the charge creating a visual representation of the impression. Unfortunately, these static charges are short-lived and easily disturbed, therefore forensic experts rely more on the deformation of surface areas. Shoe or foot impressions on materials such as soil, sand or snow produce a largely three-dimensional footprint usually preserved by casting to recover the threedimensional impressions. However, latent impression recovery is comparable to basic fingerprinting. It is a technique used for difficult-to-conserve, two-dimensional impressions on materials such as tile, wood floors or chairs. Powder is applied with a brush making the print visible, and then tape or a lifting machine records a visual record of the impression. These are the types of impression evidence forensic podiatrists might be asked to compare to exemplar prints of a known suspect.
Bare footprint analysis and identification is the identification of a person from the 2-dimensional latent impression left at a crime scene and compared with those exemplar bare footprints of a known person (suspect) along with footprint sequencing – the collection of numerous footprints from one person during their normal gait sequence are two areas of forensic podiatry identified by Vernon [3].
The focus of this study was that of exemplar bare footprints, their collection and measurement using a quantifiable measurement system. The design for the study was that of an experimental proposal using a test re-test approach generating quantitative data and relying upon statistical analyses techniques to examine the data, using both descriptive and inferential processes in nature.
Podiatrists and others involved with bare footprint collection and analyses use different mediums to collect the footprint and different methods of manual and digital measurements to analyze the footprints.
Aim of studyTo collect a set of exemplar bare footprints under controlled conditions from a group of young adults, perform measurements, manually and digitally, on the footprints following a rigorous protocol and then determine which method of measurement, manual or digital, was the most reliable for the assessment of the footprint measurements.
MethodsEthics
Ethical approval was gained from Glasgow Caledonian University and informed consent was obtained from all participants.
ParticipantsThe participants were a self-selected convenience sample of thirty-five individuals, ranging in age from 18 to 50 and consisted of thirty-one females and four males.
Obtaining footprintsFrom the literature various step protocols have been used but it seems that when undertaking research rather than case work, a mid gait protocol or one where the person has accelerated and is not decelerating may give the most appropriate data acquisition and be a stable footprint to analyze [4-7]. In case work a sequence of footsteps is usually collected therefore the step protocol is not viewed as important [8,9].
This study used a 4th step protocol to collect the footprint as it appeared to reflect a mid-gait protocol, reducing acceleration and deceleration factors of the foot during gait (Figure 1).
According to Vernon [10] there are five methods of measurement and comparison used for the evaluation of a two-dimensional footprint impression for comparison purposes between the known and the unknown footprints. However, recent work by Reel [11] in a recent PhD study and articles on this method by Reel et al. [12,13] make a total of six methods of measurement and comparison in forensic podiatry. It is the latter measurement system used in this article as the Reel system has shown validity and reliability, while the other systems lack this validity or reliability. Additionally the Inkless Shoeprint kit system was used to collect the footprint, which was that also used by Reel in their validity study (Figure 2).
Measurements obtained were those of the linear measurements as suggested by Reel [11].
These are summarised as Heel width, Forefoot width or Cross Ball line, Calcaneum to toes 1-5 and are shown in Figure 3.
Manual methodThe footprint was placed firmly on a solid even surface, and attached to the surface to prevent movement. A clear acetate sheet was placed over the footprint and attached temporarily with tape. A pen (black, indelible, permanent waterproof ink, 0.1 mm point – Staedtler Pigment liner) was used to draw the various straight lines required for this method along with a plastic transparent metric ruler. The lines were drawn as shown in (Figure 3).
Digital Photoshop methodOnce the footprints were collected they were scanned at 150 dpi (dots per inch) [14] so that they could be opened in Adobe© Photoshop© CC for analysis and compared with manual processing.
Files were saved as TIF files which was derived from Fulton [15] who suggested that for graphics and line art TIF files were the most suitable for the purpose, as they remained intact with no loss of data. TIF is the format of choice for archiving important images and according to Fulton [15] the leading commercial and professional image standard, the universal and most widely supported format across all platforms, Mac, Windows and Unix. This is an important issue within the forensic and criminal justice systems where various platforms are used by different agencies. The TIF format was used as it allowed the original digitised image to be reconstructed exactly, a critical factor for archiving master copies of important images such as that required for legal purposes [16].
Adobe© Photoshop© CC 2015 was used as the image analysis software of choice [17]. Adobe© Photoshop© allowed for interpretation and examination of the scanned footprint image where interpretation, follows the Guidance of SWGIT, in that it ‘is the application of specific subject matter expertise to draw conclusions about subjects or objects depicted in images’ [18].
Data analysisData measurements were saved as Excel files then transferred to IBM Statistical Package for Social Science (Version 22) for statistical analysis along with Analyst Soft Inc., StatPlus: mac - statistical analysis program for Mac OS. Version v5.
Descriptive statistics were performed followed by tests for normality of data before inferential statistics were analysed using Paired-sample t tests for the demographic data. The statistical tests were used to:
Statistical tests were used to determine whether there were differences between groups were used using withinsubjects designs involving related groups, e.g. the participants were always the same but the independent variables of footprint collection systems and methods of measurements were different and the dependent variables were the seven Reel measurements calculated. For the measurements, paired-sample t-tests with their subsequent assumptions were conducted. A pairedsample t-test assumes one dependent variable measured on the continuous level, in this case each of the seven Reel measurements. A second assumption was there was one independent variable consisting of two categorical or matched pairs. In this study the test and re-test were matched pairs and for the manual and digital measurements each could be regarded as matched pairs.
ResultsThe sample consisted of thirty-five individuals who all gave consent and data was collected from all of them. This was a self-selection sample of staff and students. The age of the sample ranged from eighteen to fifty years of age with an average age of twenty-four point five years (Standard Deviation -StdDev 5.9, Standard Error of Mean - SE 1.0). The heights and weights of the sample showed a normal distribution curve using a Shapiro-Wilk’s test for normality suggesting a normal distribution of height and weight for the sample.
Similar descriptive statistics and figures were produced for the various foot measurements of length, breadth of forefoot and heel breadth and are reported for right, left and also broken down by gender. The differences between left and right feet scores were normally distributed as assessed by Shapiro-Wilk’s test (p<0.05). Participants tended to have a larger right foot length (25.1 cm ± 1.2 cm) and foot breadth (9.9 cm ±1.2 cm) than the left foot but a smaller right heel width than left (7.2 cm ± .5 cm). The mean difference between feet was that of:
Foot length -.12 (95%CI, -.26 to .03)
Foot breadth .47 (95%CI, -.07 to .16)
Heel width -.22 (95%CI, -.39 to -.06)
The heel width contained a statistically significant difference between the two feet, t (34) = -2.704, p=.011.
The results for the Inkless system footprints are shown as manual, with feet identified and tested individually, then digital Photoshop measurements, again right and left feet independently.
Right foot -Manual measurementsThe differences between the manually measured variables between trials were normally distributed, as assessed by visual inspection of a Normal Q-Q Plot.
Participants tended to have larger scores with re-test in all variables except Heel Width (4.58 cm ± .879 cm for retest compared with 4.60 cm ± .870 cm for test). S.E’s showed lower values for test than re-test except for Heel width, which had higher values. However, the difference between trials was not statistically significant in any variable, p>.05. S.E ranged from .716 to .147 cm whilst Std Dev ranged from 4.24 to .87 cm. whilst these showed a difference between tests scores, further statistical analyses of the Paired-sample test showed the paired differences had SE’s of .058 to .026 cms (Table 1). No statistically significant results were found through analyses of the Sig. (2 tailed) column.
Left foot – manual measurementsThe differences between the manually measured variables between trials were normally distributed, assessed by visual inspection of a Normal Q-Q Plot.
Re-test scores in all variables tended to demonstrate larger scores than the original test. SE’s for original test scores tended to be lower than those for the re-test scores for all variables in the paired sample statistics. Differences between trials were not statistically significant in variables apart from Calc_H3 which showed a p=.029, all others were p<.05. SE’s for the paired sample tests demonstrated scores between .653 and .186 (Table 2).
Digital measurementsThe differences between the digitally measured variables between trials were normally distributed, assessed by visual inspection of a Normal Q-Q Plot of the right foot but showed some deviation from normality for some areas of the left foot in three values (Calc_H1, Calc_H2 and Calc_H5). However, as previous data sets had been used for analysis, the decision was taken to include these for further Paired-Sample t-tests.
The right foot showed relatively small SE’s ranging from .027 to a high of .050 (Table 3). Paired means showed a range from .002 to .051 with small StdDev’s. The SE’s in the paired sample tests of the left foot however, showed three high SE’s (.881 as the highestCalc_H5) but apart from the three discrepancies the others showed SE’s from .033 to .049. Only one pair showed a statistically significant result (left foot Heel width –t(34) = 2.598, p = .014) (Table 4). Paired means showed a range from .023 to .714 with the right foot demonstrating lower mean values than those of the left foot in HW, Calc_H1, Calc_H2, Calc_H4 and Calc_H5.
Summary of resultsManual measurements showed SE’s, ranging from .026 to .058 for the right foot whilst those of the left were from .031 to .653. There were no statistically significant results for the Paired-Sample t-test, p<.05 for the right foot but variable Calc_H3 was significant, p=.029 for the left foot. The digital measurements demonstrated SE’s for the left foot were higher than those overall for the right foot with higher values for the three variables, which had shown a deviation from the Normal Q-Q Plot. Therefore, SE’s for the left foot digital measurements had a range of .881 to .033 compared with the right foot, showing a range from .050 to .027.
DiscussionRecently, both in the USA [19] and the UK [20] reports have suggested that forensic science requires demonstrating a more robust scientific approach in terms of results of analysis and comparison of forensic science disciplines and that errors of means should be included in expert witness reports allowing the Criminal Justice System more transparency. The Forensic Science Regulator through various Guidance documents embeds the various issues in the UK in an attempt to ensure the forensic community embarks on the appropriate scientific research [21-23]. This piece of research attempts to address some of the issues within one area of forensic podiatry and the wider community dealing with bare footprints. One issue, which became apparent when embarking on this study, was the issue of which foot should be used for research into bare footprints collection and analysis. In case work obviously a number of footsteps are collected and those of one side of the body found at the crime scene are only analyzed and compared with those of that same side of the suspect, thus the unknown is directly compared with the known. However, within the literature searched which is mainly academic research there appears debate about which foot is collected, right, left or both.
Reel [11] used a right foot, whilst Rutishauser [24] appeared to only use the left foot for their study. This is similar to Atamturk and Duyar [25] who only took foot measurements from the left foot, which is contradictory to Kanatli et al. [26] who took measurements from the right foot. Ashizawa et al. [27] again however, used only the left foot as a base line for foot measurements. In the study by Voronov et al. [28] only the right foot was collected. None of these studies specify why one foot was preferred over the other and the author has found no reliable evidence that suggests which foot should be preferred and why. In forensic practice comparison is between the unknown and the known therefore it is likely that only one side of the body is being compared. But as the CJS requires practitioners to be able to determine SE’s then which side is being investigated requires the correct SE to be applied. Landorf [29] and Menz [30] counsel against using data from right and left feet from one person, advocating that a high correlation exists in whatever measurements are taken and essentially the same foot is being measured twice. The fact the results in this study showed that there were differences, although not statistically significant, caution is needed with assuming there will be no differences between two sets of data, between two different collection techniques or measurement processes and might indicate that although not statistically significant the results may well be forensically significant. This study clearly showed that correlation between variables within the foot/feet were inconsistent and therefore supports the notion that both feet should be used and that SE’s between feet were different and should be applied appropriately.
There were differences between test and re-test results in both feet, which may support the theory that a footprint is unique. Again, in forensic practice numerous footprints and footsteps are taken for comparison as it is obviously unknown which footprint or footstep the perpetrator left at the crime scene. However, this study might suggest that more study is needed to determine what the differences between footsteps are and if they are statistically or forensically significant. It takes time to collect, analyze and compare a number of footprints therefore if a study did show that statistically there were no differences between footsteps of the same side of the body, then this might reduce the number of exemplar footprints needed for collection. The study demonstrated no statistically significant difference between trials although the differences in manual measurements between trials were smaller than those of the digital measurements between trials. This may be due to the precision of measurements in the digital measurement compared to the manual method. However this study only collected footprints from one footstep (4th step) and a further study analyzing differences between different footsteps is needed.
This study demonstrated different SEs to those of Reel [11] but that may be for a variety of reasons:
SampleThe samples were different in that Reel [11] had a quota sampling technique with an even distribution of males and females whilst this study was predominantly female oriented.
File categoryReel [11] used a JPEG format for her scanned files, which is a lossy method of reducing file size. It is not known what data is lost when saving to this format and there is no control over the data within a file that is lost during the process. A typical TIFF file of an inkless footprint in this study showed a file size of 2.3 Megabytes but when saved as a JPEG file format (Maximum quality – 12) it was reduced to a file size of 392 Kilobytes or (saved as a medium quality -5) 143 Kb, demonstrating a large loss in data. According to SWGIT [31] “Lossy compression achieves greater reduction in file size” removing both redundant and irrelevant information. However it is the algorithm within the programme that determines what information is irrelevant or redundant and once removed cannot be retrieved upon reconstruction of an image for display. Compression therefore results in loss of image content. This degradation occurs each time the image is saved in a lossy file format. As such higher compression ratios result in the loss of more information. It was unclear from Reel [11] how much compression was used and how often the files were opened and re-saved and therefore how much relevant data was lost and the effect that this might have had on any image and the measurement of it.
This study used the TIF format, which is a lossless compression system. In lossless format all pixels are retained which results in a better image quality but larger file size. Lossless compression is used in cases where it is important that the original and the decompressed data be identical such as in forensic science. SWGIT cautions ‘Images intended for analysis should not be compressed using a lossy process’ [31].
SoftwareReel [11] used the open source software programme GNU GIMP whilst this study used the Adobe Photoshop software. Adobe Photoshop allows a complete audit of the changes and a trail of the changes can be produced for Court. Thus the software allows openness and transparency and would allow for example a defence expert to determine what changes had been undertaken by the prosecution expert in determining comparison between the unknown and known footprints. It is unclear whether GNU GIMP allows similar audit trails.
ConclusionsThis study shows there are differences in standard errors of mean between feet and between a manual and digital method using the Reel system of measurement in bare footprint analyses and comparison. This could be important in forensic practice, to ensure the practitioner was using the appropriate SE in case-work depending on which footprint (left or right) was found at the crime scene and comparing with the exemplar footprint of the suspect. Although the differences in measurements between feet were not statistically significant, the differences could be forensically significant, and further studies are needed which use both feet of individuals to determine SE’s which can be used in case-work. Further studies are needed with different populations and different age groups as well as larger studies generally. This study enhances the knowledge base of footprint analyses and contributes to the need for studies in forensic podiatry to enable the science to be prepared and assist the Criminal Justice system.
The software and the file format are also important factors within presenting forensic science evidence in court and it is unclear what difference saving the files using a lossy method might have on forensic evidence but scientific guidelines should be used where possible. It would appear from this study that there is little difference between a manual and a digital method of measurement in bare footprint analyses other than that the digital method will give more precision in measurement, which might be crucial in a criminal case. Thus, the author(s) would suggest using the digital method of measurement, Adobe Photoshop, with TIFF file formats, which allow greater precision in bare footprint measurements and analyses.
HighlightsUse of an Inkless Shoeprint kit system for exemplar bare footprints.
The use of the Reel system of measurement for analyses of exemplar bare footprints.
Collection of bare footprints for analyses in forensic podiatry.
Comparison between traditional manual method of obtaining measurements of acetate sheet overlaid the original footprint, pen and ruler with that of the use of Adobe© Photoshop© and a digital measurement and audited pathway of traceability of evidence.
Statement of OriginalityThe author confirms that the work submitted is his own, except where work which has formed part of jointlyauthored publications has been included. The contribution of the candidate and the other authors to this work has been explicitly indicated below. The candidate confirms that appropriate credit has been given where reference has been made to the work of others.
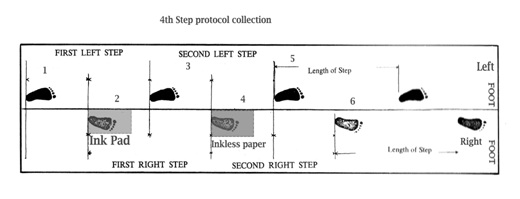
Figure 1: Placement of the Inkpad and the Inkless paper using the 4th Step protocol for obtaining bare footprint collection.
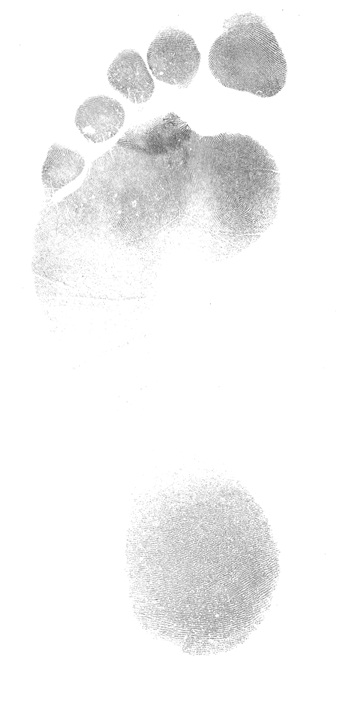
Figure 2: An Inkless Shoeprint Kit paper with a collected bare footprint.
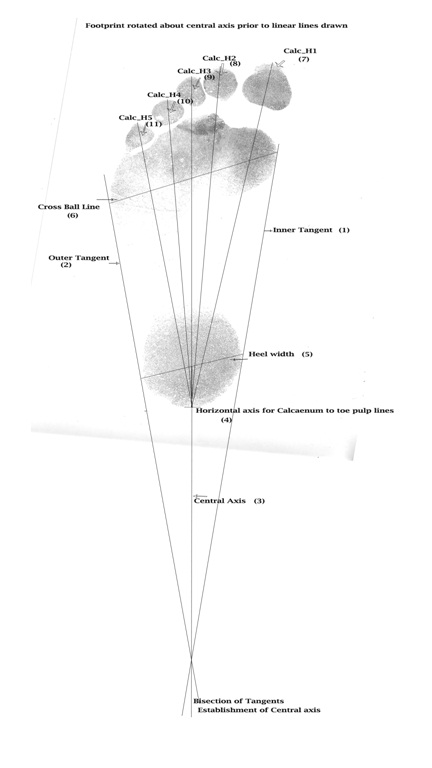
Figure 3: Reel lines for measurement showing inner (1) and outer tangents (2), central axis (3), rotation of the footprint then establishing a horizontal line (4) for further lines (7-11) along with cross ball width (6) and heel width (5).
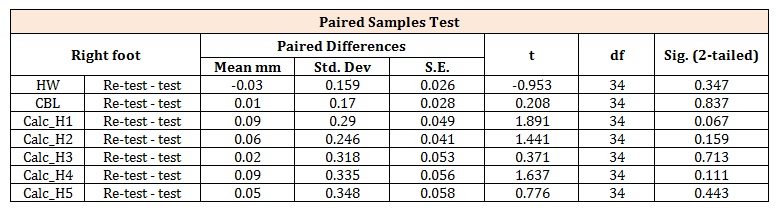
Table 1: Paired-sample test scores for the manual measurement, right foot variables for the Inkless system.
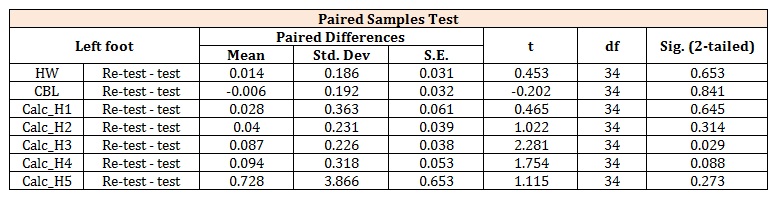
Table 2: Paired-Sample test scores for the manual measurements, left foot variables comparing for the Inkless system.
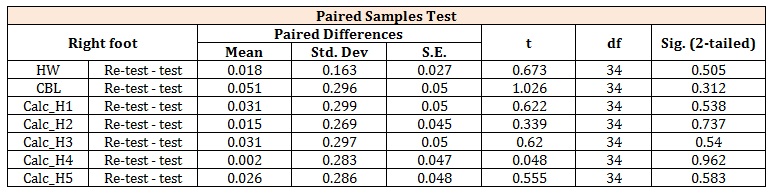
Table 3: Paired-sample test scores for the digital measurements, right foot variables for the Inkless system.
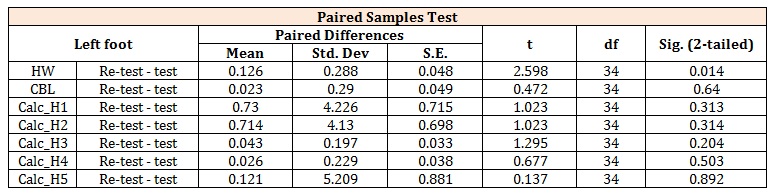
Table 4: Paired-sample test scores for the digital measurements, left foot variables for the Inkless system.