
Citation: Omidi-Kashani F, et al. Does Lumbar Spondylosis Save the Spine From Osteoporosis? A Cross Sectional Study on 104 Postmenopausal Women. J Ortho Bone Disord 2017, 1(4): 000125.
*Corresponding author: Farzad Omidi-Kashani, Orthopedic Department, Imam Reza Hospital, Imam Reza Square, Mashhad University of Medical Sciences, Mashhad, Iran, Tel: +98 51 36047753; Email: omidif@mums.ac.ir
Objective: Osteoporosis (OP) and osteoarthritis (OA) are two musculoskeletal disorders commonly affect older population. We aim to investigate the possible relationship may be present between OA and OP in the area of lumbar spine.
Methods: This cross-sectional study was carried out on postmenopausal female patients complaining of chronic low back pain (LBP) more than three months who were referred to our orthopedic clinic. At first, demographic data were collected. Bone Mineral Density (BMD) in the lumbar region was calculated and the patients were divided into three categories: normal, osteopenia and osteoporosis. The severity of OA was divided into five grades (from 0 to 4) based on Kellgren / Lawrence (KL) system. Body mass index (BMI) was also calculated. Finally the data entered into computer and statistical analysis was performed to achieve the desired goals. The correlation between age, BMI, and lumbar T score with grade of OA was evaluated using spearman test.
Results: The test results showed that grade of OA is significantly correlated with age and BMI. There was a significant positive correlation between grade of OA and lumbar T score. Lumbar T score had a significant negative correlation with age and a significant positive correlation with BMI.
Conclusions: This study showed that the grades of lumbar OA and lumbar T score in postmenopausal women are in positive significant correlation. In other words, there was a significant and negative correlation between the grade of OA and OP.
Keywords: Osteoarthritis; Osteoporosis; Lumbar Spine; Relationship
Osteoporosis (OP) is a systemic bone disorder characterized by a decreased bone density and microarchitectural weakening leading to subsequent increase in skeletal fracture [1]. OP is usually asymptomatic until the fracture occurs. Fracture risk is also increased in the patients with osteoarthritis (OA) but the underlying pathogenesis is different [2]. Initial hallmark of OA is degeneration of the hyaline cartilage of the joint, although the degenerative process ultimately leads to changes in subchondral bone, synovial membrane, and periarticular soft tissues [3]. In established cases with OA, muscular weakness, joint stiffness, associated with advanced age can increase the fracture risk.
Both OP and OA are usually seen in older population. Although the age, inflammation, body mass index, and unfavorable mechanical loading are shred predisposing factors, these two diseases have their own etiology, bone mineral density (BMD), microscopic pathology and disability [4,5]. The relationship between them is elusive and depending upon the specific region (knee, hip, lumbar spine, et cetera), definition, classification, and design of the study (longitudinal or cross sectional), various reports exist [6-10]. In this study, we aim to find a correlation between severity of lumbar spondylosis and OP in the postmenopausal women presenting with chronic low back pain (LBP).
MethodsIn this cross sectional study, after Institutional Review Board Approval (No: 930561) we studied 104 postmenopausal patients who referred to our orthopedic clinic suffering chronic LBP from June 2014 to December 2015. After the assignment of the informed consent by the patient, the proposal questionnaire was completed by the junior author (MMM). This questionnaire contained patient’s demographic characteristics, severity of lumbar spondylosis and osteoporosis according to KellgrenLawrence (KL) and Dual Energy X-ray Absorptiometry (DXA), respectively. KL classification system is the most popular grading system for radiologic evaluation of lumbar spondylosis [11]. KL system use plain lateral radiography of lumbar spine and classified the spondylosis into five grades (0-4):
Grade 0: no radiologic characteristics of OA;
Grade 1: Isolated minimal osteophytosis;
Grade 2: definite osteophytosis associated with some sclerosis of the ventral portion of the endplates;
Grade 3: Marked osteophytosis and subchondral sclerosis with mild narrowing of intervertebral space;
Grade 4: Marked osteophytosis, subchondral sclerosis, and also marked intervertebral space narrowing.
Lumbar OP was assessed by measurement of bone mineral density (BMD) based on dual energy x-ray absorptiometry (DXA) [12]. World Health Organization (WHO) classified OP using BMD of young female (20-30 years old) as the reference value (T-score). Although, International Society for Clinical Densitometry states that for clinical purpose in premenopausal female, Z-score (Comparison with age group rather than peak bone mass) is better to use [13,14]. WHO uses the following criteria for diagnosis of osteoporosis: T-score ≥ -1.0 as normal, - 1.0 to -2.5 osteopenia, ≤ −2.5 osteoporosis, and ≤ −2.5 associated with fragility fracture categorized as severe osteoporosis [12,13].
We also assessed body mass index (BMI) as the weight (in kilogram) divide by the square of the height (in mete). This parameter was also classified base on WHO criteria into four groups: underweight (<18.5), normal (18.5- 24.99), overweight (25-29.99), and obese (>30) [15].
We included those postmenopausal patients who had been referred to orthopedic clinic due to chronic (>3 months) LBP. Our exclusion criteria were disparity more than six months between lumbar spine radiography and densitometry, presence of a significant local or systemic disease (like malignant tumor, leukemia, autoimmune disorders, infection, etc), or a previous history of immunosuppressive drugs (including corticosteroids) consumption.
Statistical AnalysisStatistical analysis was carried out by Statistical Package for Social Sciences (SPSS) version 11.5 for Windows (SPSS Inc., Chicago, IL, USA) while p<0.05 was considered significant. The distribution of variables was evaluated using the Kolmogorov-Smirnov test. In case of normal distribution (p>0.05), One-Way Anova test and in case of non-normal distribution (p<0.05), Kruscal Wallis test was used to compare the quantitative variables. If there is a significant difference in previous tests, we also used Tukey and Dunnett tests to compare each subgroup with each other. In order to investigate the relationship between the variables in case of normal distribution and in other cases (based on Kolmogorov-Smirnov test), we used Pearson and Spearman tests, respectively.
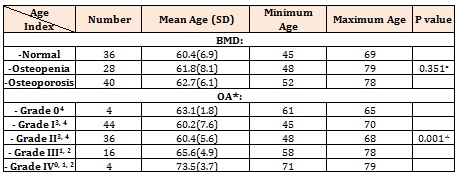
ResultsWe studies 104 patients in whom the basic and raw characteristics were summarized in Table 1. Lumbar T score ranged from -4.6 to 1.5 with a mean value of – 1.9±1.5. Although statistical tests indicated that age did not have any significant correlation with the severity of osteoporosis, the relationship between age and severity of OA was significant. These relationships were depicted in Table 2.
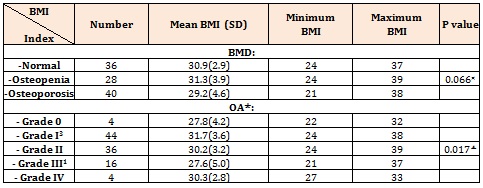
Table 3 shows the relationship between BMI and different types of OP and OA. According to this table, BMI and BMD have no significant relationships with each other while the difference between BMI and OA was significant. Intergroup comparison shows that BMI in the patients with OA grade III was significantly lower relative to the patients with OA grade I but relatively similar to other groups.
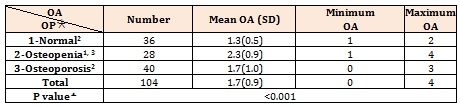
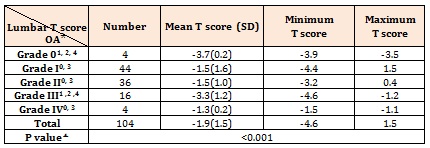
The severity of OA in the patients with various BMD was different significantly. Intergroup comparison showed that OA severity in osteopenic patients was notably higher than the patients with normal or osteoporotic BMD (Table 4). Statistical analysis also shows a significant difference between lumbar T scores and grading of OA (Table 5).
The Spearman correlation coefficient between age and lumbar T score showed a negative significant relationship (p< 0.001, r: -0.341), while grading of OA had a positive significant relationship with age (p: 0.009, r: 0.255), BMI (p: 0.014, r: 0.240), and lumbar T score (p: 0.034, r: 0.165). The Spearman correlation coefficient between BMI and lumbar T score has a positive significant relationship (p: 0.046, r: 0.196).
DiscussionThis study reviewed the relationship between OP and OA in the region of lumbar spine in the postmenopausal women who had been referring to our orthopedic clinic with chronic LBP. Literature including both longitudinal and cross-sectional studies usually declares a positive relationship between BMD and OA, although the underlying mechanism remains vague [16]. Roux and Richette proposed that anti-resorptive drugs including bisphosphonates and cathepsin-K inhibitors due to a decline in bone turnover may have a role in management of OA in experimental animal models but it remains to be proven in human OA [17]. Dequeker and colleagues proposed that increased skeletal concentration of insulinlike growth factor (IGF) types I and II and transforming growth factor beta (TGF beta) in the patients with generalized OA may promote biosynthetic activity of osteoblasts and resistance to OP [18]. It is also suggested that in advanced OA, the thickened subchondral bone stress shield the underlying bone from local stresses and result in OP [19]. Other researchers considered the possible role of colony forming units-fibroblastic (CFU-F) in OP versus OA patients in explaining the reverse relationship observed between the two, but the real underlying mechanism is still vague [20].
There are several studies evaluated the relationship between knee OA and hip OP. Most of the studies found a negative correlation between the two, although some inconsistencies exist [6-9, 21]. In a study carried on 195 Korean female with knee OA, GI, Im et al. found that more severe knee OA is usually associated with more severe OP of the ipsilateral hip [6]. Sezer, et al. also investigated the relationship between knee OA and BMD in femur and lumbar vertebrae in 74 female patients with known OA of the knee [21]. They found no correlation between BMD and knee OA but a negative correlation between age and femur BMD was recognized. This study also confirmed that BMI has a positively correlation with OA but a negative correlation with OP. These statements are consistent with the findings of our study.
Although OP is a generalized disease but most of the previous studies have evaluated the relationship between OA in one location with OP in another location [10,22,23]. One of the special features of our study is the comparison between OA and OP in a same specific location of the body. Our result has finally confirmed a positive correlation between lumbar OA and lumbar T score, but does the subchondral sclerosis or osteophytosis falsely increase BMD measured by DXA? We used KL classification for assessment of OA and did not assess the disc space narrowing, subchondral sclerosis or osteophytosis, separately. Therefore, we are not able to answer to this specific question by this research.
The study pertaining to Hart and colleagues is one of the first studies evaluated the relationship between lumbar OA and OP [24]. The authors found that all the patients with OA have significantly less OP at the lumbar spine. In this study, none of the factors like smoking, alcohol consumption, exercise and spinal osteophytes had a confounding effect on the results. Similarly, Ichchou, et al. in a cross sectional study on 277 postmenopausal female evaluated the possible relationship between lumbar spine OA and OP [25]. Their results showed that the severity of disc space narrowing had a negative correlation with OP, but osteophytosis had no effect.
Our study had several flaws. Our patients were not a perfect sample of the whole community and perhaps the results of this study cannot be generalized to the general population. On the other hand, our sample size was not very impressive. In the future, using more comprehensive methods for classifying osteoarthritis and considering osteophyte, subchondral sclerosis, and disc space narrowing separately for their possible effect on BMD measured by DXA, may lead to more accurate results and stronger deduction.
ConclusionOur results confirmed that in postmenopausal women with chronic LBP, a positive correlation exist between severity of OA and lumbar T score. In other words, it can be suggested that lumbar spondylosis can partially protect the spine against OP.
AcknowledgmentThe authors thank Student Research Committee, Faculty of Medicine, Mashhad University of Medical Sciences for financial support. This paper is based on a medical student’s thesis pertaining to Mir Emad Moafi Madani.
Conflict of interestThe authors declare that they have no conflict of interests.
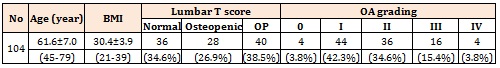
Table 1- Basic Raw characteristics of our evaluated patients
* Significant difference between subgroups based on Dunnett’s T3 were shown as superscripts
× One-Way Anova Test
Kruscal Wallis Test
Table 2: The relationship between age and OA or OP in our patients
* Significant difference between subgroups based on Tukey test were shown as superscripts.
× One-Way Anova Test
Kruscal Wallis Test
Table 3: The relationship between BMI and OA or OP in our patients.
Significant difference between subgroups based on Dunnett’s T3 were shown as superscripts (e.g. 2: significant difference relative to osteopenia) .
Table 4: DPPH scavenging free radical of extracts.
Note ±: SD, n = 3.
Table 4: DPPH scavenging free radical of extracts.


Chat with us on WhatsApp