Citation: Kumhar RP. Study of Ion Transport Behavior of Nanocomposite Polymer Electrolyte for Battery Application. Nanomed Nanotechnol 2017, 2(3): 000123.
*Corresponding author: Kumhar RP, Department of Physics, Govt. Maharaja College Chhatarpur, (M.P.) India, Email: rpk1972ssi@gmail.com
In the present work an attempt has been made to synthesize and characterize polyvinyl alcohol: polyvinyl carbazole (90:10) blend based nanocomposite polymer electrolyte dispersed with SiO2 namely, (PVA: PVK): CH3COONH4: EC: SiO2 system. Improvement in amorphous nature of the system upon addition of SiO2 nanofillers has been confirmed by XRD and SEM studies. The ionic conductivity of nanocomposite electrolyte improves moderately (~5 times) at room temperature with optimum of 5× 10⁻³ S/cm for 6 wt% SiO2. The temperature dependent conductivity analysis shows that ion conduction is controlled by combination of Arrhennius and VTF behavior. All the results have been suitably explained. All-solid-state battery has been fabricated in the cell configuration Zn+ZnSO4 (anode)/polymer Gel Electrolyte/V2O5+C+Polymer Gel Electrolyte (cathode) to establish its practical utility in electrochemical devices. Cell performance studies on cell with 0.4 M electrolyte show open circuit voltage of 1.5 volt with power density 1.12 W/Kg been studied by recording the cell potential discharge profiles at room temperature under different load conditions..
Keywords: Polyvinyl Alcohol; Polyvinyl Carbazole; Nanocomposite Polymer Electrolytes; Polymethyl Methacrylate
In recent past electrochemical based energy storage devices provide a tremendous role in technical applications like computers, communication devices, industrial controls, electric vehicles, laboratory equipments etc. Moreover they have stringent need in the portable electronic market like solar cells, pacemakers, remote controls and even in toys. In these emerging technologies they are having an exclusive demand for long life, environmentally friendly, low cost, reliable rechargeable batteries with specific energy power as expected [1-3]. Within this frame-work polymer electrolytes are materials of great interest for applications in different electro-chemical devices but their relatively poor ionic conductivity limits its utility. The conductivity of these electrolytes is confined mostly in amorphous phase and the crystalline phases are considered as poor conductivity phase. Thus over the years attempts have been made to improve the amorphous phase of polymer electrolyte. Introducing of a plasticizer in small amounts which may be a low molecular weight substance [1], polymer blending [4], using comb- branched copolymer [5], cross- linking of polymer matrices [1] and incorporation of inorganic fillers [6] are the alternative ways to improve the ionic conductivity of polymer electrolyte. Polymer blending is an extensive way to complement advantages of each compartment, improve the electrical behavior and enhance the physical properties of polymer electrolytes. Therefore, blending of polyvinyl alcohol (PVA) and polyvinyl carbazole (PVK) was employed in this work. In general, PVA is solvent swollen character and known to form hydrogels [7,8] and also a potential candidate for development of proton conducting electrolytes. Introduction of PVK in polymer electrolyte is expected to improve the mechanical strength and interfacial properties between electrode and electrolyte [9]. In recent years, polymethyl methacrylate (PMMA) [10-12], polyacrylonitrile (PAN) [13], polyvinylidene fluoride (PVdF) [11,14] and polyethylene oxide (PEO) [11,15] have been reported as suitable polymer host materials for the preparation of polymer gel electrolyte. The most of the work on polymer gel electrolytes concerns development of lithium- based polymer batteries [11,16-18]. Proton conductors has attracted much attention because of its potential use in clean energy devices such as fuel cell, electrochromic devices (ECDs) and other smart devices [19]. The numbers of fast protonic conductors, organic, crystalline and amorphous, have been prepared during past three decades [3,11,15,20]. Within the realm of polymer gel electrolytes, PVA is also one of the prominent polymer because its good solvent holding capacity and electrochemical stability [7,21] have reported PVA- based proton conducting gel electrolytes with high ionic conductivity.
Generally, poor dimensional, mechanical stabilities and exudation of liquid from gel lump retained for a long period are the main drawback of ionic liquid- based gel polymer electrolytes. Therefore, composite electrolytes are developed to overcome these shortcomings by dispersing the inorganic inert fillers, such as SiO2, TiO2 and alumina (Al2O3). Addition of inorganic filler not only improves ionic conductivity but also enhances mechanical stability. In recent times, dispersion of inorganic filler in pristine polymer electrolytes [22] and in polymer blend based electrolytes [23] have been effectively tried to overcome these problems to a great extent leading to formation of nanocomposite polymer electrolytes. Looking into such problems, an attempt has been made in the present work to improve the performance of (PVA: PVK): CH3COONH4: EC electrolyte system by dispersal of nano- sized SiO2. This system is expected to drastically impede crystallization process in polymer based nanocomposite electrolytes and thus improve ionic conductivity. Present system is characterized by using XRD, FTIR, Scanning electron microscopy, electrical measurement and battery fabrication and discharge profile test to evaluate cell performance.
ExperimentalPVA (average molecular weight 124,000- 186,000 Aldrich make), PVK (average molecular weight 40,000 Aldrich make), ammonium acetate (CH3COONH4), AR grade sd fine chem. and aprotic solvent dimethyl Sulfoxide (DMSO) merk limited, were used for synthesis of polymer nanocomposite electrolyte. The preparation of nanocomposite electrolytes involved many steps. First both polymers PVA and PVK were dissolved in DMSO in the ratio of PVA: PVK, 90:10 and stirred for 3 h at 500C to obtain homogeneous mixing. In the second step an appropriate quantity of ammonium acetate (CH3COONH4) salt in EC (Aldrich make) was added to the above mixture to get the composition so as to obtain the polymer blend electrolyte and stirred further for 2h to complete the homogenous mixing. In next step SiO2 nano filler was mixed in different wt% and stirred for other 2 to 3h. The final solution was poured in poly carbonate pettri dish to obtain thick films of nanocomposite electrolyte system. Silicon oxide (SiO2) filler was synthesized by standard solgel technique. Tetraethyl orthosilicate (TEOS) was chosen as precursor material dissolved in a double- distilled water/ethanol mixture for the formation of silicon oxide powder. The pH value of solution was maintain 5-7 with the ammonia solution drops and allowed to gel at 500C. The gel was dried at 1500C for 12 h followed by thermal treatment at 7000C for 2 h and 9000C for 0.5 h in a kanthal high temperature furnace. The dried material was crushed to obtain fine powder of SiO2 [24]. C-V and I-t measurements were performed on a CH- electrochemical workstation (CH instruments model CH608) to determine electrochemical window and nature of charge transport. Electrical characterization of the material was carried out using impedance spectroscopy technique. Complex impedance parameters were measured with a Hioki impedance analyzer (model 3520) in the frequency range 40 Hz- 100 KHz using platinum electrodes for electrical contact.
Results and DiscussionFigure 1 depicts the XRD pattern of blend based polymer gel electrolyte films of (PVA: PVK): CH3COONH4: EC without and with SiO2 nanofillers along with pristine components. One relatively sharp characteristic XRD peak at 2θ= 22.10 and a broad peak around 16.70 (pattern b) closely matches with the peaks reported for PVK [25]. The slight deviations in characteristic reflection of PVK are possibly due to variation in solvent swollen nature of PVK in different organic solvents. XRD pattern of as synthesized SiO2 nanofiller particles showing prominent XRD peak at 2θ= 26.60 (in inset pattern c) to conform to earlier reported results [26]. When the polymer components are admixed together to form PVA:PVK (90:10 ratio) blend the low intensity diffraction peaks appear at 2θ values 19.450, 19.760 and 20.60 while high intensity characteristic reflection is noticed around 24.230 (pattern d). These diffraction maxima occur on account of interaction among components/ intercalation of PVK in PVA leading to formation of a new material viz. polymer blend. It is should be mentioned here that few low intensity peaks are not clearly visible due to merge of different patterns in a single figure. The presence of diffraction peak 19.450 and 19.760 is correlated to existence of un-reacted PVA in the blend. The remaining peaks can be correlated to formation of PVA: PVK blend as they do not correspond to any of the reflection of pristine material. Upon addition of salt CH3COONH4 (pattern e) the XRD peaks of PVK (2θ= 16.70) retraces towards lower 2θ value. On the other hand, the PVA related peak intensity (2θ= 19.60) diminishes. Also diffraction peak related to PVA: PVK: DMSO system at 24.20 intensifies owing to enhanced compatibility in the presence of added salt. Recently, PVA has been shown to form complex with ammonium salts leading to formation of polymer gel electrolyte [27-29].
On the same lines it can be argued that ammonium acetate forms complex with linkage at the OH group of PVA. In addition to the XRD peaks appearing at 16.70 and 24.20 few other peaks around 26.90, 27.20, 30.60, 35.20, 35.70, 41.10 and 47.60 appear in XRD pattern of composite system. Since none of these peaks are assignable neither to salt nor host polymers it is conjectured that complex formation takes place in electrolyte system. Upon addition of nanofiller SiO2 (pattern f) all the existing peaks are suppressed with increase in broadening of primary peak except the appearance of a strong sharp peak at 2θ= 26.60. This peak corresponds to characteristic reflection of SiO2 according to JCPDS data (file no.461045) and also recorded in the experiment (in inset pattern c). This observation supports the role of SiO2 as that of passive filler in electrolyte with SiO2 only improving the morphology of composite blend electrolyte system. Characteristic reflections of nanofiller could not be tracked at higher concentration of SiO2 due to coverage of SiO2 particles by matrix electrolyte. The average crystallite size in composite system (Table 1) was also estimated using well- known Debye- Scherrer formula [30] which reflects nano format of electrolyte system in presence of filler particles. Further marginal improvement (decrease in crystallite size) noticed till intake of 6 wt% SiO2. As it exceeds a sudden increase in crystallite size is noticed possibly due to agglomeration of nano particles.
Scanning Electron Microscopy StudiesFigure 2 depicts the surface morphology of DMSO casted PVK, PVA: PVK, PVA: PVK: CH3COONH4: EC and PVA: PVK: CH3COONH4: EC: SiO2 films. In the pure PVK film image plain structure is observed with existence of intermittent pores of small dimension (Figure 2a). In the image of PVA: PVK blend rough surface of irregular pores is observed with cluster of un-dissolved PVK (Figure 2b). The rough surface along with existence of phase separation is an indication of poor compatibility among polymer components as also witnessed during optical microscopy. Upon addition of ammonium acetate salt in PVA: PVK to make polymer blend the original entity is lost and layered type structure with significant decrease in pores size is observed (Figure 2c). This supports better solvent retention capability of electrolyte system. It seems that there exists better compatibility among polymer components in the presence of salt validating optical microscopic data. Incorporation of SiO2 filler in mixed conducting system reduces the porosity of system because SiO2 nanoparticles are entrapped between chains in the pores (Figure 2d). White colored spots observed in the SEM image show that SiO2 nano filler particles are not fully absorbed.
DSC AnalysisDSC thermograms of Figure 3 (i) and (ii) represent the thermal scans for PVA, PVK, PVA: PVK: DMSO and PVA: PVK: CH3COONH4: EC composite system for two salt molarities (0.4 and 0.6 M) and nanocomposite electrolyte containing 6 and 8 wt% SiO2 for 0.4 mole salt. Since PVA is known to be partially crystalline material, both characteristic transitions (Tg and Tm) appear in DSC thermogram as evidenced in scan a of Figure 3(i) (Tg= 880C and Tm= 2160C). These transitions are in close agreement with the earlier reported values [27,31 ]. The glass transition temperature of PVA decreases in the blend and as well as in composite electrolyte system probably due to plasticization of PVA with DMSO used as casting solvent for electrolytes [32]. This transition is observed around 700C. A broad shoulder peak around 1700C is also evidenced in DSC profile of pure PVA. Such a feature has also been reported earlier [27] and ascribed to phenton melting. In thermogram b of Figure 3(i) glass transitions temperature and melting temperature of PVK appear around 197°C and 337°C respectively, which conform to the result of Cadek et al. [33]. Endothermic transition around 58°C (scan a figure 3 (ii)) shifts toward higher temperature (61°C) upon addition of 0.4 M salt in the blend (scan b of Figure 3 (ii)) and correlated to melting of DMS resulting interaction of DMSO with PVA. It has been shown previously by Agrawal and Awadhia [21,34] that DMSO interacts with PVA and reduces to dimethyl sulfhide (DMS). This endothermic peak is also observed in nanocomposite system containing 6 and 8 wt% SiO2 at 550C (scan d) and 49°C (scan e) respectively.
Endothermic transition observed around 2210C in PVA: PVK blend (scan a) can be ascribed to melting temperature of uncomplexed PVA and this peak shifts toward higher temperature upon addition of salt and observed at 223°C and 225°C for 0.4 M (scan b) and 0.6 M (scan c) respectively. Upon incorporation of 6 wt% SiO2 nanofiller in composite blend containing 0.4 mole ammonium acetate salt, (scan d of Figure 3 (ii)) this peak is shifted to 227°C. On further increasing content of nanofiller this transition retraces back and appears at 217°C. The enthalpy change corresponding to this transition when calculated for electrolyte samples (Table 1) it decreases. However change in enthalpy is minimal for sample containing 6 wt% SiO2 (26.3 J/g) which is an indication of maximal degree of amorphousness. No transition corresponding to glass transition temperature of PVK (197°C) could be perceived in blend nor their electrolyte. Further multiple endothermic transitions appeared in the temperature range 250°C - 288°C in all electrolytes samples (scan b-e of Figure 3 (ii)) which is attributed to formation of complexes.
Appearance of an endothermic peak around 347°C in PVA: PVK blend can be associated to melting of unblended PVK, and this temperature decreases upon addition of salt due to formation of blend based electrolyte. Upon addition of SiO2 nanofiller further decrement is noticed in this thermal transition. Moreover the enthalpy change corresponding to this transition is also seen to decrease. A broad endothermic peak in composite system containing 0.4 M salt (scan b of Figure 3 (ii)) is observed around 135°C which can be correlated to melting of PVA: salt complex formed or onset of phenton melting. Since endotherms related to melting temperature of PVA and PVK is observed in all samples in the temperature range 250°C to 288°C, their occurrence suggest formation of partially compatible blend based electrolytes.
Wagner’s PolarizationAmperometric I-t technique was used to assess the nature of ion transport and evaluate total ionic transference number from current time plot with platinum electrodes. The variation of current with time for mixed conducting samples is shown in Figure 4. Polarisation behavior is reflected in all these curves. The ionic transference number tion was calculated using the relation [35]:
Where Iionc is current due to ions, Ielectronic (or Ifinal ) the current due to electrons, and Itotal (or Iinitial) the sum of ionic and electronic contribution to current.
It is observed that the nature of charge transport is similar to that for solvent- free gel polymeric electrolytes [36]. The calculated values of tion for different composite films varies from 0.9 to 0.8 with varying concentration of SiO2 filler which ascertains dominance of ionic charge transport over electronic transport in nanocomposite electrolyte.
CV StudiesA stable potential window is of great practical importance for applications of electrolyte materials in batteries and super capacitor [37,38]. Figure 5 compares the cyclic voltagrams of composite electrolyte and nanocomposite electrolyte with loaded different wt% nanofiller of SiO2. It is apparent from this figure that electrochemical stability is moderately good without any filler which range – 1.5 V to + 1.6 V. On addition of nano filler stability is seen to improve significantly range from - 1.54 V to +1.64V. Another effect of adding the nanofiller is the narrowing of faradic currents during oxidation and reduction cycles in the stable region. An interesting observation is the appearance of a single oxidation/reduction peak for all pristine and composite electrolytes, which is on account of NH4 + ions that contributes to ionic conduction. Oxidation of PVA in presence of DMSO has been envisaged earlier [21]. In the presences of filler, the reduction peak was noticed to shift on the potential scale along with decrease in the intensity. Comparison of C-V data indicates best cyclic reversibility for composite system containing 6 wt% SiO2 filler with optimum, improvement in electrochemical stability. Electro chemical window has been found to range from - 1.6V to +1.64V.
Electrical ConductivityThe variation of ionic conductivity of composite electrolyte (PVA: PVK): CH3COONH4: EC system as a function of salt concentration is shown in Figure 6. The conductivity of composite system has been extracted with the help of Cole- Cole plot. The conductivity of composite electrolyte is seen to rise with increasing salt concentration and reach an optimum at 1.27×10⁻³ Scm-1 for 0.4 M. It has been complex formation takes place in the system, which tends to raise the conductivity of the system through greater dissociation of salts. Dimethyl sulfoxide is highly aprotic solvent and ammonium acetate is likely to dissociate into respective ions at lower concentration and there is nothing to be dissociate. Therefore as the concentration of salt enhances concentration of free ions increases and so the conductivity increases in accordance with the relation:
Where q represents the charge of mobile carrier, n the charge carrier concentration and µ the carrier mobility. Increase in the amount of salt content leads to increase in fraction of un-dissociated salt in gel solution. However, the polymer- salt interaction, as reported earlier [21]. This in tantamount to higher conductivity values in accordance with relation (2). For high salt concentration > 0.4 M dissociation of salt by polymer is restricted by further increase in fraction of un- dissociated salt in gel solution, which raises the viscosity of gel system and hence conductivity decreases.
Figure 7 depict the variation of ionic conductivity of nanocomposite polymer electrolyte with SiO2 filler concentration. The ionic conductivity of nanocomposite electrolyte seen to improves moderately (~5 times) at room temperature for 6 wt% of SiO2 filler. Close observation of conductivity plot shows two maxima, one around 2 wt% and other around 6 wt% filler concentration- a feature typical of nanocomposite polymer gel electrolyte [26,27]. At low filler concentration, greater dissociation of salt and increase in amorphous behavior tends to enhance free ions concentration and mobility, which significantly enhance ionic conductivity. A flatting in conductivity response is noticed beyond 2 wt% SiO2 contents. This can be associated to the fact that all the salt has been dissociated and so charge carrier concentration is limited. It is only the change in system morphology that tends to affect the conductivity, and thus, again an enhancement of small magnitude is visible. In situation when there is very large quantity of nanoparticles (beyond 6 wt%), agglomeration of theses nanoparticles take place, which leads to decrease in conductivity due to creation of tortuous pathways for mobile ions. An another factor that can be associated with the fall conductivity is the increase in the microscopic viscosity of composite system.
Temperature Dependence of ConductivityIt is clear from Cole- Cole plots of PVA: PVK: CH3COONH4 system that there is a continuous drop in bulk resistance of composite system with increase of temperature. Hence temperature dependence of electrical conductivity of (PVA: PVK): CH3COONH4: EC: SiO2 system at different filler concentration was studied and the result have been shown in Figure 8. The variation of conductivity indicates that the conductivity increases with rise in temperature with two distinct straight lines separated by a region in which there a non- linear change in conductivity value. At low temperature (around room temperature) the conductivity response is essentially dictated by the trapped liquid electrolyte within the polymer matrix and hence Arrhenious behavior is noticeable. However, as the temperature approaches the glass transition temperature of polymer PVK (65°C) in polymer composite system, the matrix becomes flexible giving rise to conductivity response associated to that PVA: CH3COONH4 electrolyte. Therefore as the temperature is raised further the conductivity enhancement is best described by VTF relationship. All the curve display similar behavior i.e. combination of Arrhenius and VTF with former being noticed in the lowtemperature region and later at higher temperatures.


Where σo is the pre-exponential factor, the activation energy and Ea is activation energy K is the Boltzmann constant and T0 = Tg-600C is quasi equilibrium glass transition temperature.
A low value of activation energy in low temperature region (Table 1) has been observed. Such low values are typically observed for polymer gel electrolytes.
All-Solid -State BatteryLooking into wide temperature and electrochemical window of the nanocomposite electrolytes all-solid state battery has been fabricated using PVA: PVK: 0.4M CH3COONH4: EC: SiO2 as electrolyte to test the utility of electrolytes in battery application. All solid state battery was designed in the configuration (Zn+ZnSO4) || PVA: PVK: 0.4M CH3COONH4: EC: SiO2|| (C+V2O5+Electrolyte) and subjected to discharge profile test to evaluate cell performance. Open circuit voltage (OCV) ~ 1.5 V has been obtained for the cell. The Cell was discharged through load resistance 1.5 KΩ at room temperature. Initial drop in the potential followed by a plateau region and ultimate fall in cell voltage is observed (Figure 9) with 1.5 KΩ load resistance. The cell potential discharge profile is shown in Figure 9 Some important parameters, calculated in the plateau region of the discharge profile are listed in Table 2. The observed favorable results clearly outline the importance of these blend electrolyte in solid state battery applications.
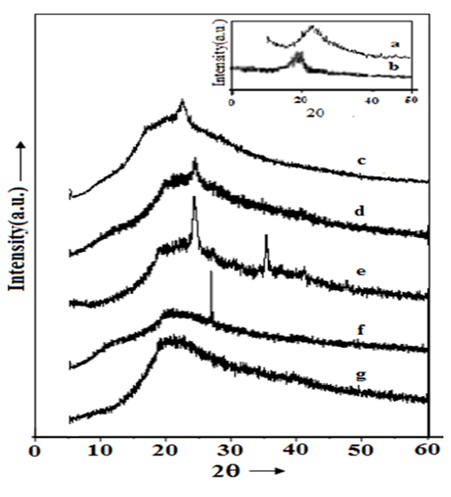
Figure 1: X- ray diffractograms of DMSO casted (c) PVK, (d) PVA: PVK and PVA: PVK: CH3COONH4: EC nanocomposite electrolyte containing (e) 0, (f) 6 and (g) 8 wt% SiO2. Inset shows XRD of (a) DMSO casted PVA and (b) SiO2.
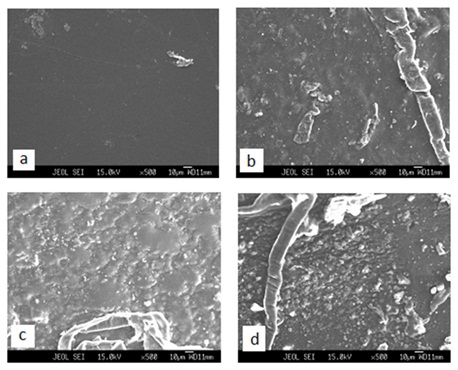
Figure 2: SEM image of DMSO casted (a) PVK, (b) PVA: PVK, (c) PVA: PVK: 0.4M CH3COONH4 and (d) PVA: PVK: 0.4M CH3COONH4: 6wt% SiO2.
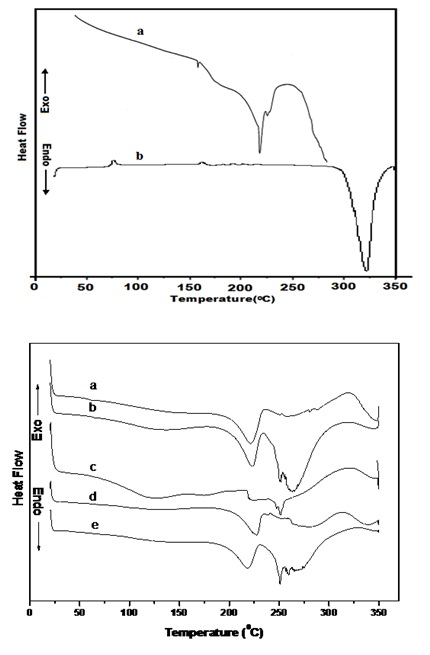
Figure 3 (i): DSC diffractograms (a) PVA and (b) DMSO casted PVK.
Figure 3 (ii): DSC diffractograms of DMSO casted (a) PVA: PVK, (b) PVA: PVK: 0.4M CH3COONH4: EC, (c) PVA: PVK: 0.6M CH3COONH4: EC (d) PVA: PVK: 0.4M CH3COONH4: 6 wt% SiO2 and (e) PVA: PVK: 0.4M CH3COONH4: 8 wt% SiO2.
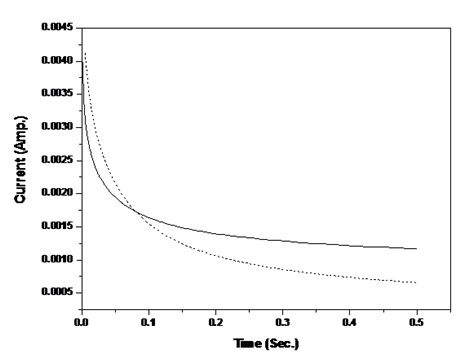
Figure 4: I-t Polarization curve of DMSO casted PVA: PVK: 0.4 M CH3COONH4: EC: SiO2 containing (solid line) 0 and (---) 6 wt% SiO2.
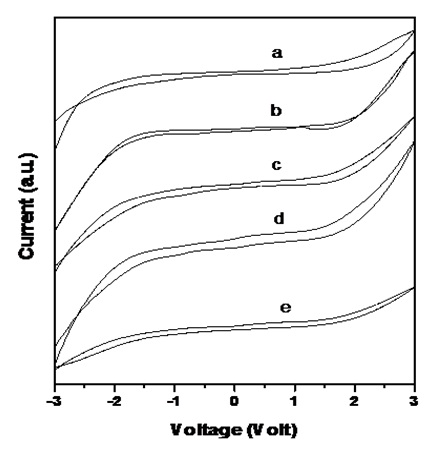
Figure 5: Cyclic voltammogram of PVA: PVK: 0.4 M CH3COONH4: EC: SiO2 blend based nanocomposite electrolytes containing (a) 0, (b) 2, (c) 4, (d) 6 and (e) 8 wt% SiO2 nanofiller.
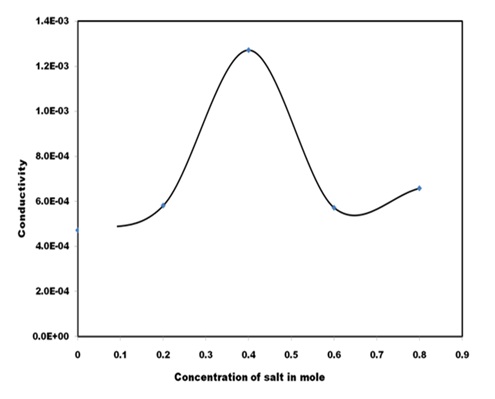
Figure 6: Ionic conductivity of (PVA: PVK): CH3COONH4: EC blend based electrolyte at different mole of ammonium acetate salt.
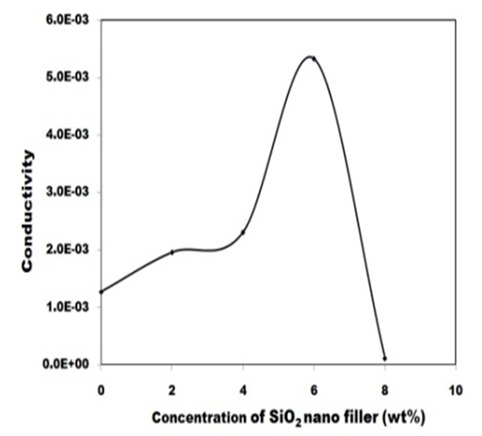
Figure 7: Variation of electrical conductivity of PVA: PVK: 0.4 M CH3COONH4: EC: SiO2 blend based nanocomposite electrolyte with different wt% of SiO2 filler concentration (at room temperature).
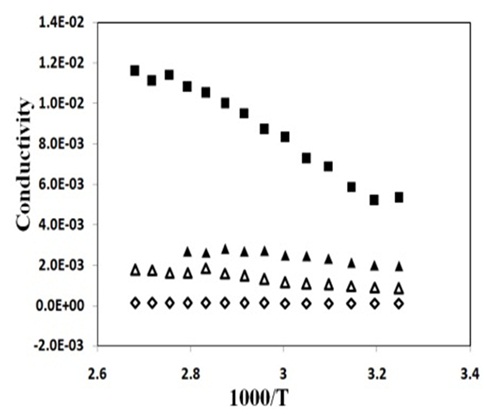
Figure 8: Temperature dependent conductivity of PVA: PVK: 0.4M CH3COONH4: EC: SiO2 blend based nanocomposite electrolytes with () 0, (▲) 2, (■ ) 6 and () 8 wt% SiO2.
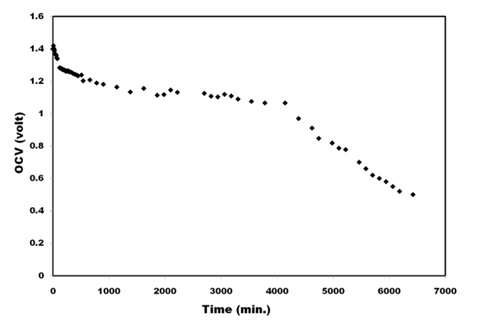
Figure 9: Discharging profile of fabricated cell through 1.5 KΩ resistances.
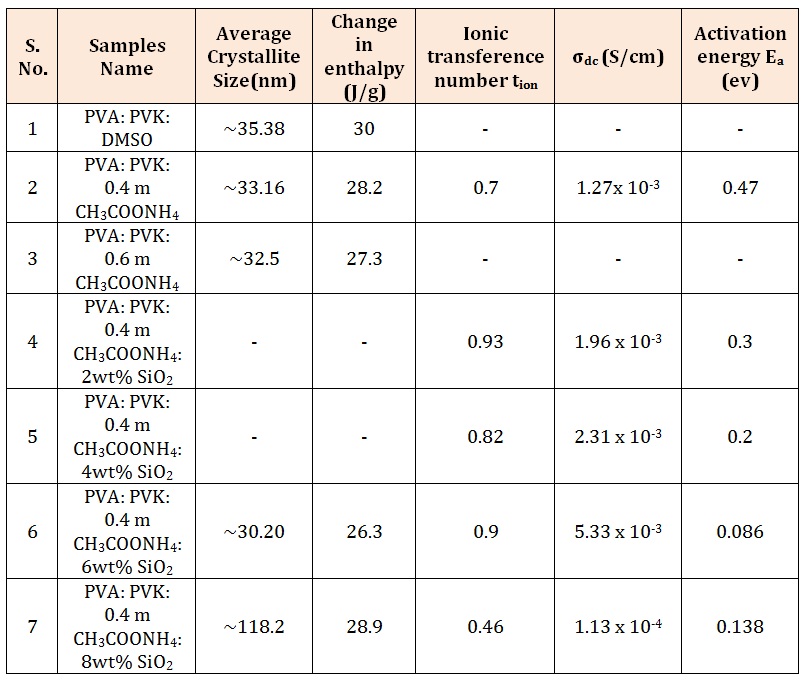
Table 1: Average crystallite size, Change in enthalpy, Ionic transference number and activation energy of some samples.
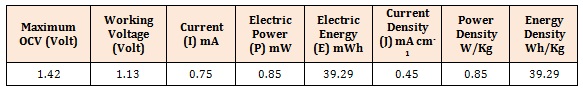
Table 2: Some important cell parameters calculated in the plateau region of the cell potential discharge profile.
Chat with us on WhatsApp