Method of Reconstruction the Intact Surface for Surgical Accesses
The aim of this work lies in designing software used for preoperative planning of the surgical access risk. In order to obtain a realistic and useful simulation we focused our study on the physical modeling of the brain targeting and on the maneuvers of the surgical instruments. A new method of intact surface construction, which will assist in accurate neurosurgical planning, was discussed. Moreover, the three-dimensional model and its visualization were described. This visualization method allows of combining the calculated data about the surgical intervention risks with the geometrical data describing patient's head. Therefore, this methodology will help to build an intelligent system that has the ability of selection the best approach of surgical intervention access. The current technique is based on geometrical synthetic object creation, this object “in next stages of the surgical planning approach†would be applied directly to the data describing the risks of surgical access, and this in turn will allow estimating the real risk value of the surgical access. The advantage of this method is that the creation of the object is based on surgical access approach. The best surgical access is based on finding the smallest distance of surgical intervention toward the target, taking into the account the reduction of brain tissue damage. The method of the intact vertex can significantly reduce the amount of memory overloading, also a method of filtration used to extract artifacts resulting in unreal vertices, caused in rendering errors and memory overloading, was used. Also, using data describing the correlation between the object vertices allows arifacts filtration without any need for additional transformations. All that improves the rendering procedure and the accuracy of the surgical intervention by 30%.
Introduction
In order to perform a neurosurgical intervention inside human brain and to solve a wide variety of tasks, the stereotactic is a frequently used method [1]. The main advantage of the method is the high accuracy of surgical access, especially in the tasks concerning the pre- operative planning. The method is based on data collection (obtained by a computed tomography (pre- operative study)) will assist in providing a lower risk by implementing a surgical intervention, and the outcome of the surgical intervention would be accurate and safer [2]. Currently, stereotactic surgery or radio surgeries are widely used [3, 4]. Stereotactic surgery approach combines both medical anatomical structure (brain maps) and technical aspects which include programs and devices (hard/software) [5]. These interdisciplinary approaches resulted in difficulties in designing and developing of surgical stereotactic systems and complexity of their application. Therefore, there is a need of designing an expert or intelligent system which would allow providing the best option of surgical approach.
Study Analysis and Problem Identification
The most common difficulties related to the process of selection the best surgical stereotactic planning approach and the implementation of surgical intervention system design, is beginning from the stage of finding medical evidences for specific surgical intervention, and end by the technical aspects regarding the best surgical access [1]. Many studies still underway to minimize the risk of surgical access, taking into account avoiding destruction of brain “arteries and vessels” [6, 7]. But attention should be paid to the studies focused on topics related to brain tissue modeling, which may damage due to the surgical instrument access.
The Purpose and the Objectives of the Study
The risk of stereotactic surgical access is a complex structural quantity, which relies on the accuracy of describing the intra-cerebral structures of a specific case [5]. Moreover, the numerical value of the surgical intervention risk is directly proportional to access value that in turn, could permit the assessment of the expected risk yielding a numerical value. Therefore, the surgical Most modern methods of computer tomographic three-dimensional data visualization , can be divided into two main groups: methods using polygonal representation of displayed objects and methods based on the principle of discarding and ray tracing. Each group of methods has its own advantages, disadvantages and readings for used [1, 2].
planning system could select the optimal surgical access approach. Furthermore, it should be taken into account, that there are some surgical accesses’ cases have many approaches of interventions of a similar risk assessment, which could be selected by the stereotactic planning system. In this case, the stereotactic planning system would allow for an interactive visualization of these possibilities, to enable surgeon to use his personal experience to select the most appropriate surgical approach.
The aim of the current study is to improve the quality of surgical intervention procedures, by introducing data at “the planning stage” about the surgical target (intact surface) and its surrounding structures. Consequently, these data could be combined with the surgical tool movement “specific intervention” data that would allow surgeon to synchronously view the sources of data.
It is necessary to create 3D surfaces that describe the intact points of the surgical intervention, to reconstruct the intact surfaces, used for accurate surgical access. This could be extracted from the CT data of specific patient head.
To Achieve Research Goals and Reconstruct Risk Map of Surgical Access, Following Steps are Necessary
Construct of 3D patient head model, using intact surfaces technique. Construction of intact sphere surface that must surrounded surgical zone. Painting surgical access with gray color gradation, proportional to surgical tool depth (vertices coloring). Appropriate selection of the filter for removing specific noise. Appropriate lighting of the surgical zone, during the interactive physician displaying.
3D Patient Head Model
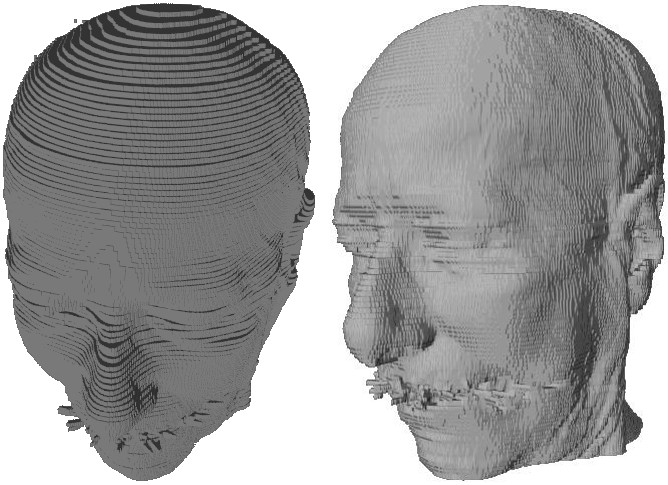
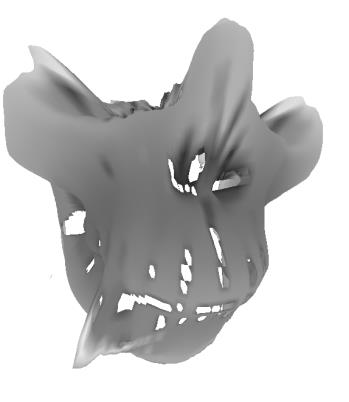
а) b) Figure 1: Dimensional model of human head: a) Voxel Model b) Model, reconstruct by Marching Cubes algorithm method.
To the most known methods for constructing three- dimensional polygonal models include: presentation of segmented volume elements of three-dimensional cubes - voxel (Figure 1a), Rocks algorithms, Kaneyro (Marching Tetrahedrons), Marching Cubes (Figure 1b), etc.
With the proper application of the methods that using a map of polygonal meshes, as a rule, its considered as a fastest way to visualization a three-dimensional model, because the architectures of a video accelerators in the last 13 years designed for a hardware acceleration triangle rasterization. In order to enable the graphics conveyor in most effective need to collect all the graphic primitives in the vertex and index buffers. This organization makes it possible to once in a vertex buffer to determine the vertices, having the same coordinates, but in different triangles set. Index buffer is an array of 16 or 32 bit unsigned integers numbers, that specify to displacement the vertex buffer vertices, forming a triangle, depending on the chosen topology primitives. This approach can significantly reduce the amount of memory, that required for storing the information about the geometry of the model and improve the rendering speed by reducing the number of calls GAPI. Besides polygonal models can be exported in various file formats, three- dimensional, with the ability to open and edit data of these files, packages three-dimensional modeling. Extraction efficiency of complex polygonal models requires for addition on processing system and module displaying tomographic data for polygons optimization. This optimization should include reducing the number of triangles, describing a display object by removing obviously invisible parts, combining several triangles lying in the same plane of one triangle.
Thus, when preparation voxel model, advisable to carry out the removal as individual faces, that common to multiple voxels, as well as elimination of whole voxels invisible from the outside of the model. Combining adjacent faces of voxels in one face spills in a significant reduction the number of primitives of the model. Rearranging flow vertex indices of triangles based on organization transformation cache video card, allow to reduces the number of performed transformation matrix and significantly increase the number of displayed triangle model per moment of time. Described above optimization techniques allow in real-time to model visualization, to obtained triangulation tomographic large amounts of data (hundreds of millions of voxels) .However, in order to perform visualization of volumetric network data, need to know exactly which voxels from belong investigated object and must be displayed when rendering, and which are contrary discarded. This procedure is carried out by the formation of binary mask, obtained after first segmentation data imaging. The operation of selection the first brightness for visible items tomographic cube should be in the manual mode and require for an interactive original data of mapping when changing visible brightness range rendered voxels.To Resolve this task, and to satisfy the mentioned requirements, by the method of discarding rays before first collision. It allows instantly to obtain highly voxel detailed projection studied objects . while dynamical changing first mapping. The results of applying this method to a sequence of tomographic slices of the patient's head for different values of the first presentation in Figure 2. Besides the changing in the range of histogram, to be displayed, discarding rays allows on the fly to change the visible part of the tomographic cube cutting part of volume, show directly on the model tomographic data and the results of the segmentation of anatomical structures, change various settings visualization.
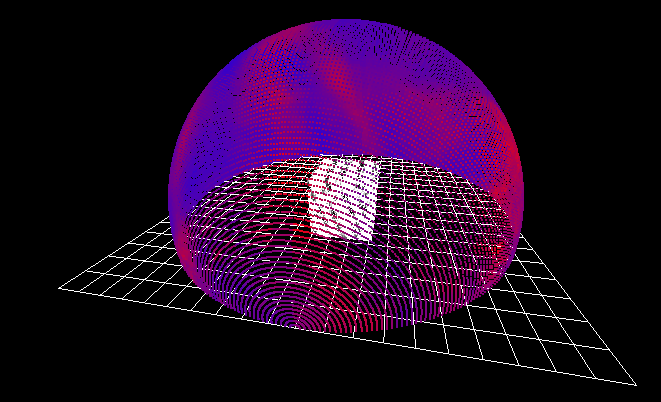
а) b) Figure 2: Illustration space visualization by the method of ray discarding.
Construction of Risky Maps
Construction and modeling of risk maps is based on the surgical access approach. This approach is based on painting the hemisphere describing all the possible risks of the surgical intervention. The numerical value, describing the surgical risk, is obtained from distance calculation between target and the surgical tool (i.e., longer distance means higher risk and vice versa). Therefore, this method has the advantage of simplicity and no inquiry for additional calculations. However, this simplicity does not allow accurate geometric measurements for the patient's head. Thus, this method is considered as less informative for the neurosurgeon.
Currently, computer graphics technology has a sufficient amount of tools to solve a lot of tasks, such as 3D modeling and the processes of volumetric displaying of data. The most used software for that is the medical linear visualization algorithm (marching cubes) [8, 9, 10]. But unfortunately, this approach of 3D modeling is not active in the process of intact-surface reconstruction, because the technologies don’t allow identifying the surgical access direction.
Therefore, the construction of the risk map is carried out according to volume data taking into account the surgical access direction. Risk map surface creation is illustrated in (Figure 3). The sphere must cover target zone (CT study area), this sphere has a point (T) located in the center of the stereotactic target zone, and is considered as a 3D surface with regularly-spaced vertices.
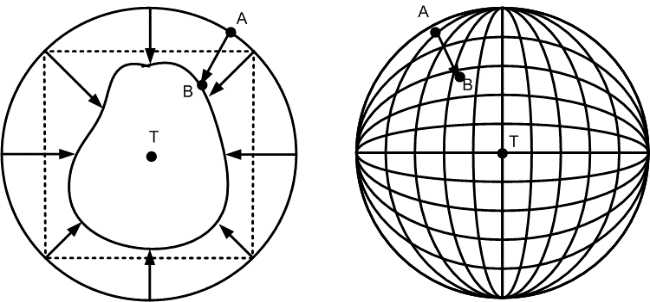
a b Figure 4: The construction of risk maps using intact- surfaces: a. two-dimensional view; b. a three-dimensional view.
The initial data which describing the vertices are stored in a 2D mass, and this mass exactly matches one vertex of the spherical surface. Starting point (A) coordinates, are calculated according to the equation (1):
$$ = R \cdot \sin (\Delta \beta \cdot i) \cdot \cos (\Delta \alpha \cdot y $$
α β ;) cos( ) sin( j i R x
A $$ = R \cdot \sin (\Delta \beta \cdot i) \cdot \sin (\Delta \alpha \cdot j $$ α β (1) ); sin( ) sin( j i R y A $$ = R \cdot \cos (\Delta \alpha \cdot $$ α ), cos( j R z A Where xA, yB, zB – is the coordinates of point (А); R – Radius of the sphere; Δα, Δβ –increment degree and polar angles; i,j – consequently numbering.
The radius (R) is calculated according to the maximum distance of the point (T) which located among vertices values obtained from CT data stored in the system. By removing the vertex (A) to another place, according to vector TA of length unit, this will cause a new position at point (B).
The equation (2) allow to combine the point (A) in point (B), this would to represent volume data of CT study zone, which indicate that an X-ray density object was crossing patient body, so the current position is considered as intact vertex. Thus, the vertex (A) of the spherical surface changes its non intact position to intact vertex (B).
( , , ) , A A A x y z V x n TA y n TA z n TA T + + +
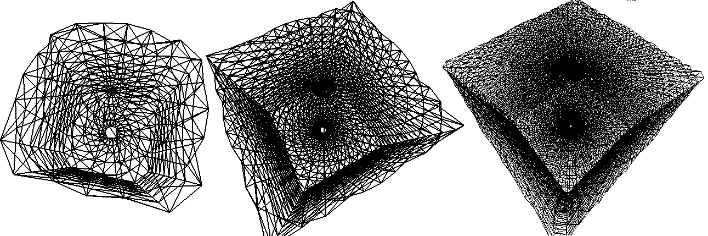
(2) Where: n – step number; T – minimum threshold allowable of the X-ray density, measured in HU unit. By changing the number of vertices in original spherical mass, we could obtain different surface details. Figure 5 Illustrates examples of synthetic cube surface with different amount of vertices forming this surface.
а b c Figure 5: Resulting structure of cube surface with different detailed degrees: a) 400 vertices; b) 1600 vertices; c) 10000 vertices.
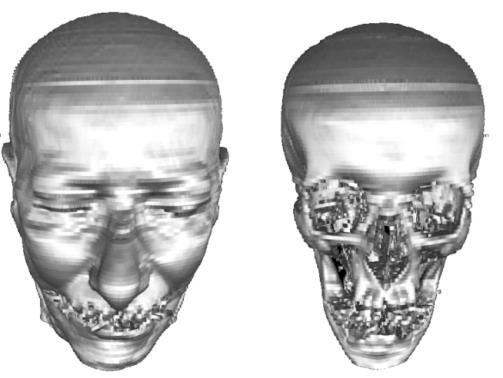
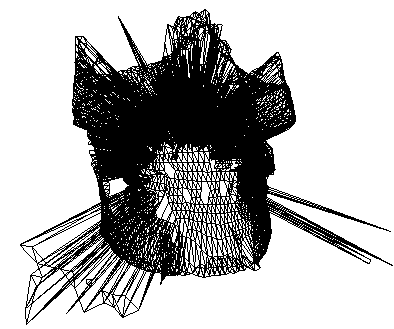
It should be takes into account that in medical practice when performing a CT study, we often face some cases with occurrence of interferences with resulted image, for example, distortions generated due to metallic dental implants (Figure 6).
The most suitable solution to solve current artifacts issue is to filter the original image. But in many cases, eliminating the metal artifact in this way and at this stage causes removing of essential parts of the original image. The appearance of star artifact on the 3D image surface because of the distortion (unusual triangular set) would be stored among the buffer of intact-vertices, and this buffer is considered as temporary store from which the data that describing the adjacent vertices would be extracted. So if a data of some incomplete vertices is used, subsequently this will cause future errors in surgical access. Therefore to solve this problem, a low-pass filter equation (3) can be used to keep the original vertices.
k k $$ | = \sum_ {u = - k} ^ {k} \sum_ {v = - k} ^ {k} H [ u, v ] F [ i - u, j - v ] $$ [ , ] [ , ] [ , ], u k v k G i j H u v F i u j v (3) Where: G - resulting vertex array after filtration; H –initial vertices array before filtration; F – filter core; i, j - number of vertex on the array.
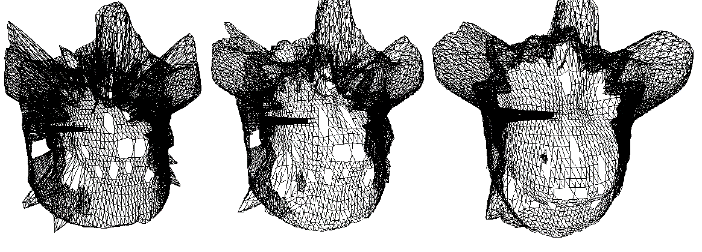
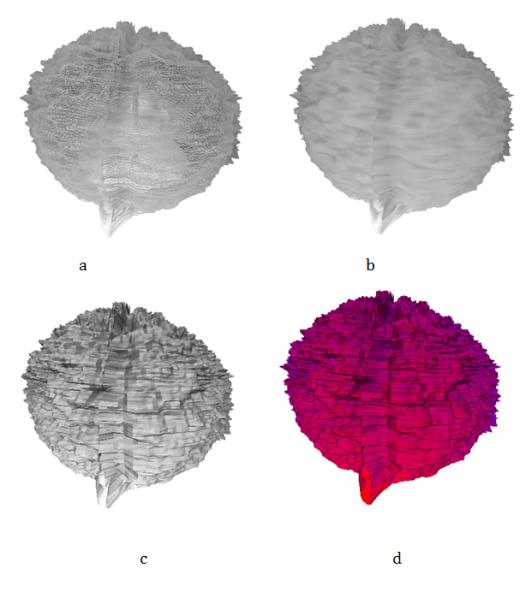
а b c Figure 7: Resulted 3D object surface after noise elimination using an averaging filter. Different sizes of the averaging filter has been used: a- 3x3; b - 5x5; c- 7x7.
Figure 8, illustrates the 3D structure results after applying averaging filter (with different sizes) to eliminate the noise. Figure 6, illustrates the process of high-frequency artifacts suppression, but at the same time the filtration causes surface over-smoothing, and this is considered as not objective. There for, to combat this effect, the most optimum filter and its size must depend on artifacts volume.
The next step is painting each vertex with a specific color. In accordance to the value of risk during the surgical tool intervention, these painting data can be visualized.
Figure 9, shows the synthetic data describing the risk in accordance to access value, where the normalization method of distance (surgical accesses to target point) was used. Light-gray color describe areas with longer distance toward the target point, dark-gray describe the ears with less distance toward the target point.
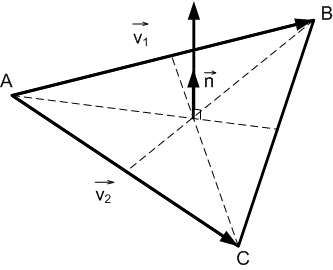
For each triangle visualization (Figure 9) the normal $$ \mathrm {E} = \frac {1}{2} \mathrm {A} ^ {2} + \mathrm {B} ^ {2} $$ victor n is used in the calculation. As in equation (4), this value must be considered when performing 3D visualization, also the lighting effect should be taken into the account (Figure 10).
$$ \mathrm {E} = \frac {1}{2} \mathrm {A} ^ {2} + \mathrm {B} ^ {2} $$
vector on the (ABC) triangle.
Figure 10, illustrate the calculation of normal vector ( n
) in accordance to (ABC) triangle $$ \mathrm {E} = \frac {1}{2} \mathrm {A} ^ {2} + \mathrm {B} ^ {2} $$ $$ \mathrm {E} = \frac {1}{2} \mathrm {A} ^ {2} + \mathrm {B} ^ {2} $$ $$ \vec {n} = \frac {\vec {v _ {1}} \times \vec {v _ {2}}}{\left| \vec {v _ {1}} \times \vec {v _ {2}} \right|}, $$ $$ \mathrm {E} = \frac {1}{2} \mathrm {A} ^ {2} + \mathrm {B} ^ {2} $$
1 2
1 2 (4) $$ \mathrm {E} = \frac {1}{2} \mathrm {A} ^ {2} + \mathrm {B} ^ {2} $$
$$ \mathrm {E} = \mathrm {E} _ {1} + \mathrm {E} _ {2} + \dots + \mathrm {E} _ {n} $$ Where: 1 v , 2 v – vectors transformation into triangle (ABC) vertices.
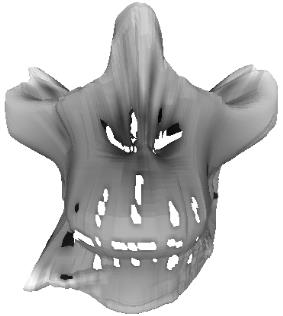
Figure 11 illustrate of the visualization results in different modes.
Conclusion
Stereotactic planning method for surgical interventions on the human brain is considered as a complex procedures, which is based not only on numerical calculation, but is also depends on the experience of the treating doctor. In order to combine these two factors (numerical calculation and doctor experience) it is necessary to implement an interactive 3D visualization technique, which represent the data about risk map describing the surgical access , which interactively would allow the neurosurgeon to use his viewpoint to select the optimal approache of surgical access (from a set of similar value of the risk).
This paper, illustrates and describes a method that allow to reconstruct a 3D structure with intact surfaces and the combine this data with the data that describe the surgical tool progress. This method has a special character when compared to commercially known techniques for reconstruction and visualization of data.
The importance of this work lies in designing a software used for preoperative planning of the surgical access risk (risk map) using the results of processed CT data from patient head followed by further procedures that has relation to the 3D visualization associated with the data that obtained using the designe approach in this paper.
References
-
Lozano AM, Philip L Gildenberg, Ronald R Tasker (2009) Textbook of Stereotactic and Functional Neurosurgery. Springer pp: 3288c.
-
Chen SY, Chen CH, Sun MH, Lee HT, CC Shen (2011) Stereotactic biopsy for brainstem lesion: Comparison of approaches and reports of 10 cases. J of the Chinese Medical Association 74(3): 110-114.
-
Germano IM, Weisz DJ, Silvers A, Shrivastava R, Bo Yi Yang (2001) Surgical Techniques for Stereotactic Implant of Deep Brain Stimulators. Seminars in Neurosurgery 12(2): 213-224.
-
Vesper J, Bolke E, Wille C, Gerber PA, Matuschek C, et al. (2009) Current Concepts in Stereotactic Radiosurgery-A Neurosurgical and Radiooncological Point of View. European Journal of Medical Research 14(3): 93-101.
-
Avrunin OG (2013) Determination of surgical invasiveness degree in computer planning surgical interventions approach. Bionics intelligence 81(2): 101-104.
-
Gent F, Greetje VV, Kris VK, Rangarajan JR, Maarten D, et al. (2012) Multi-modality approach to ameliorate stereotactic brain surgery planning in rodents. SkyScan user meeting.
-
Rincon-Nigro M, Navkar NV, Tsekos NV, Zhigang D (2014) GPU-Accelerated Interactive Visualization and Planning of Neurosurgical Interventions. IEEE Computer Graphics and Applications 34(1): 22-31.
-
Joshi A, Scheinost D, Vives KP, Spencer DD, Staib LH, et al. (2008) Novel Interaction Techniques for Neurosurgical Planning and Stereotactic Navigation. IEEE Transactions on Visualization and Computer Graphics 14(6): 1587-1594.
-
Lorensen WE, Cline HE (1987) Marching Cubes. A High Resolution 3D Surface Construction Algorithm. Computer Graphics 21(4): 163-169.
-
Newman TS, Yi H (2006) A survey of the marching cubes algorithm. Computers & Graphics 30(5): 854- 879.
- Origin, Evolution, and Functional Impact of Short Insertion- Deletion Variants in Human Genomes: A Review
- Harnessing Molecular Glues for Next-Generation Vaccine, Cancer and Cardiovascular Disease Drug Development: A Comprehensive Review
- Lateral Cervical Epidermal Inclusion Cyst in a Paediatric Patient: A Rare Case Report
- Malarial Plasmodium Falciparum with Hepatitis B and C Virus Infections among Blood Donors in Ife Central Local Government Area, Ile Ife, Osun State, Nigeria
- Withanolides and Withaferin A- What’s next in Ashwagandha Research
- Designing of Dual Pulse Photoacoustic Tomography for Imaging of Drug-Response and Tumor Growth