Studying the Prevalence of Lead among Schoolchildren in Qatar and its Impacts on School Performance and Attitudes towards Violence in School
Exposure to lead (pb+2) has been associated with several diseases including mental diseases and violent behaviors. The main objectives of this study were to determine the prevalence of lead (pb+2) and its impacts on school performance and attitudes towards violence in Qatar schools. A case control study design was conducted. A total sample of 170 students was randomly selected to participate in this study according to their academic achievement. A special questionnaire was designed for this study. Lead (pb+2) was determined in urine sample using spectrum atomic absorption. Results showed that the grades are significantly negatively correlated with the concentration of Pb, sleep hours and rate of preservative consumption. Similarly, the performance of the student’s id significantly associated with the violent and negative behaviours. The poor performance of the students is indicated by the low grades (score: 50-60) is significantly associated with the presence of higher concentrations of Pb in the urine in comparison to the good performing students. The outcomes of this study also highlight the feasibility of observable behaviours and quantifiable biochemical indicators to predict a student’s performance in academics. Furthermore, the association of the consumption of preservatives and daily sleep hours with the performance of the students are indicator to provide awareness to the students, school administrators and the public. The detectable presence of a toxicant like Pb, in this case, to impact academic performance and behaviour necessitates further validation as well as provision of guidelines for public health. Taken together, exposure to lead is a significant problem that should be addressed in social context.
Introduction
Lead (Pb) is considered one of the common poisonous materials in our environment that negatively affects the nervous system. The different subclinical doses of Pb reduce the normal encephalopathy which affects the mind, cognitive, emotional, and motivational functions, as well as causes significant negative changes in social behaviours Jane After exposure to Pb at a toxic level, the substance is absorbed and is retained in the blood and bones for a prolonged period of time. Furthermore, the Pb exposure is associated with changes in various body systems, such as the central nervous system, which may lead to poor school performance and increase their attitudes towards violence in the school environment. According to many studies in USA, the results revealed and implied that the children with elevated toxic blood level of Pb have a problem with slowing of growth and learning skills like reading and writing as well as hearing loss. In fact, the data from the Centre of Disease control (CDC) showed that about 6 percent of children with age between 1-2 years and 11 percent of black (non-Hispanic) children with age between 1-5 years of whom have toxic levels of Pb have a greater risk of that delayed of nervous system and were significantly related with eating unusual or non-nutritional food (American academy of child and adolescent psychiatry, updated October 2017). Elevated toxic blood level of Pb is correlated with different levels of aggressive behaviours and crimes Thokozani, et al. [1]. Besides, it contributes to cause approximately 16.8 million of people to suffer from a disability of mental cognition development as well as heart disease Nisha, et al. [2].
In the study of cumulative air Pb concentration exposed proved that to have significant relationship with poor cognition and delayed brain development (Eia study to find out the relationship between percentage of Pb in children urine and violent tendencies. In fact, the result of the study came in accordance with the previous mentioned one and proved that there was a correlation between them. The more Pb concentration in children’s urine, the more violet they become. Wrieht and colleagues (2008) conducted a study on 250 people [3]. The study revealed that there was a close correlation between continued exposure to Pb increases violent behaviour and criminality. The finding also showed that every 50 micrograms increase per decimetre every six years leads to an increase in the violent behaviour by 50 percent. In the study of pregnant rats that were given water drinking contains Pb (10μg/ml) from the beginning of gestation through lactation up until weaning the babies were highly obese and showed neurobehavioral deficits [4]. James, et al. [5] account for the effect of using Pb pipes on the behaviour of homicides between 1921 and 1936. They found that exposure to Pb through the use of these pipes is responsible for the highest rate of homicide.
Violence in educational circles is considered one of the problems that haunt society because of the extremist behaviours practiced by hostiles in civil society. Various social studies are trying to find justifications and explanations related to this phenomenon, but to the best of the researcher’s knowledge, none has suggested the ultimate solution to this phenomenon within the social system. Hopefully, this study will tackle the effects of environmental and biological factors that are related to the Pb concentration in student’s urine, in general, and their relationships with the violence committed and their academic achievement imperfections in governmental schools in Qatar, in particular. The importance of the study lies in the fact that it addresses one of the most important problems facing our region, which is violence and extremism. Extremism leads to violence, such as assaulting others and property. This study has taken a different approach related to researching the phenomenon of violence environmentally and biologically by studying the effect of Pb on violent behaviour and academic achievement. Thus, this study may open the door to a new type of research that may contribute to identifying individuals who have a susceptibility to violence and treating them in turn.
Study Objectives
The main objectives of the present study are to:
- Measure the Pb concentration in urine among two groups of school students in Qatar: a group of students (the cut off scores at 90-100 percent) with good academic achievement and a group of students (the cut off scores at 50-60 percent) with low academic achievement.
- Measuring the different behavioural patterns related to perceptions of violence among the selected two groups of students and link that to the Pb concentration in urine.
Study Hypothesis
- Exposure to some heavy metals such as lead is significantly associated with poor academic achievement compared with the unexposed group at the significance level of alpha less or equal to 0.05.
- Exposure to lead is significantly associated with violent behaviours such as insulting teachers and school property, compared with the non-exposed group at the significance level of alpha less or equal to 0.05.
Study Methodology
Study Design
A case-control study between two groups of students with good academic achievement (control) and low academic achievement (case).
Study Population
Middle school students in Qatar.
Study Sample
The study included randomly selected 170 students divided into 81 students with good academic achievement and 89 students with low academic achievement.
Ethical Statement
Approval to conduct the study was obtained from the Research Ethics Committee of the Ministry of Education and Higher Education in Qatar.
Study Tool
A special questionnaire was designed for this study by reviewing the international literature related to violent behaviour, which contains paragraphs of students’ opinions on the school environment and administration and the motives for violent behaviour. The participation of students was optional and with the consent of parents and those who signed in writing to the participation of their children in the study.
Sample Collection
A urine sample was taken from each participant by a qualified nurse to carry out urine analyses. Urine Pb levels were determined using spectrum atomic absorption.
Statistical Analysis
All data was analysed using SPSS version 20. Data was represented in graphs and tables. Significance was considered against α<0.05.
Results and Discussion
Question
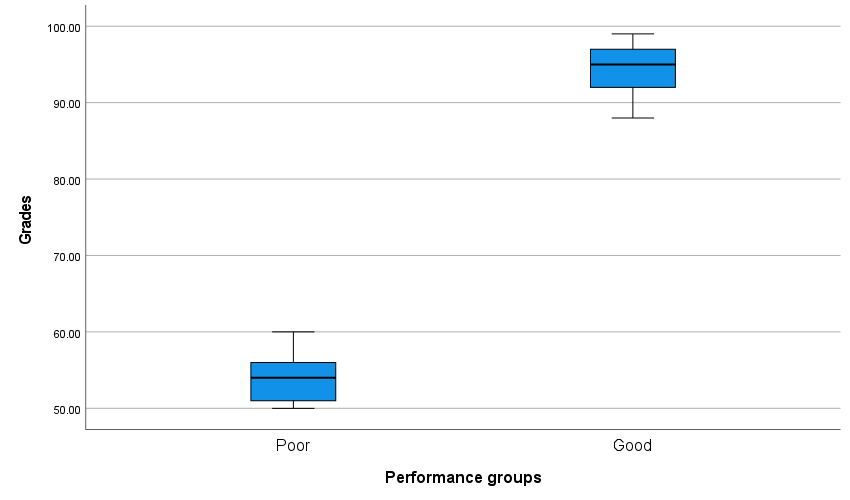
What is the relationship between the concentration of lead, sleep hours, and BMI on the grades of the students? Units of analysis: Middle school students of Qatar Variables used: concentration of lead-x1, sleep hours-x2, preservatives-x3, BMI-x4 and grades-y From Table 1, the grand mean of the students BMI is 27.3 ± 4.0 which corresponds to the overweight category, according to the World Health Organization [6] (WHO) guidelines (WHO n.d.). The BMI ranges from a minimum of 16 (underweight) to 36.40 (severely obese). The rate of consumption of preservatives (in hours) has a mean of 8.6 ± 5.4 with a minimum of 1 hour to 19 hours. A weakness to this indicator is that it is not clear if the rate of consumption occurs over one day, week or month. Hence, it requires caution in interpretation. The average sleep hours of the students is 8.7 ± 1.1 hours per day ranging from an observed minimum of 6 hours to a maximum of 12 hours? The mean concentration of Pb was found to be 0.02 ± 0.04 ppb (parts per billion) with a minimum of 0.0001 ppb and a maximum of 0.32 ppb. From Figure 1, no outliers were observed in the recorded grades. The students of poor performance have a mean grade of 54.0 ± 3.0 percent whereas the students of good performance have a mean grade of 94.4 ± 3.21 percent. The median grade for the poor performance group is 54 percent whereas the median in the good performance group is 95 percentages [7].
| Minimum Statistic | Maximum Statistic | Mean Statistic | Std. Deviation Statistic | Variance Statistic | Skewness | ||
|---|---|---|---|---|---|---|---|
| Statistic | Std. Error | ||||||
| BMI | 16 | 36.4 | 27.3473 | 4.03466 | 16.278 | -0.272 | 0.187 |
| Grades | 50 | 99 | 73.2588 | 20.48273 | 419.542 | 0.096 | 0.186 |
| Preservatives | 1 | 19 | 8.6118 | 5.35065 | 28.629 | 0.049 | 0.186 |
| Sleep hours | 6 | 12 | 8.6647 | 1.13546 | 1.289 | 0.518 | 0.186 |
| Pb conc. in urine | 0.0001 | 0.32 | 0.027545 | 0.0419863 | 0.002 | 2.737 | 0.186 |
Table 1: Descriptive Summary of Quantitative Variables.
A test for normal distribution of the grades shows that the data is not normally distributed as indicated by the very low p-value of less than 0.001 (Tables 2 & 3). Consequently, the grades were log transformed and reciprocal transformed separately. However, both transformations did not meet the condition of normal distribution. Hence, non-parametric analysis was adopted.
| Kolmogorov-Smirnova | Shapiro-Wilk | |||||
|---|---|---|---|---|---|---|
| Statistic | df | Sig. | Statistic | df | Sig. | |
| Grades | 0.274 | 170 | <.001 | 0.759 | 170 | <.001 |
| a. Lilliefors Significance Correction |
Table 2: Output for Tests of Normality for the Grades. H0: There is no difference in the grades of poor versus good performance g
| Ranks | |||
|---|---|---|---|
| Performance groups | N | Mean Rank | |
| Grades | Poor | 89 | 45 |
| Good | 81 | 130 | |
| Total | 170 | ||
| Test Statisticsa,b | |||
| Grades | |||
| Kruskal-Wallis H | 126.939 | ||
| df | 1 | ||
| Asymp. Sig. | <.001 | ||
| a. Kruskal Wallis Test | |||
| b. Grouping Variable: Performance groups |
Table 3: Summary of Non-Parametric Test.
Following non-parametric testing by Kruskal-Wallis test to evaluate if there is a difference in the grades of the two groups of students, it was observed that there is a statistically significant difference in the grades between the 2 performance groups with a p-value less than 0.001. The mean rank grade of the poor performance group is 45 whereas that of the good performance group is 130. Hence, we reject the null hypothesis; accept the alternative hypothesis to conclude that the grades of the poor performance group are different from the good performance group at a 95 percent confidence [8, 9, 10].
H0: There is no corelation between x’s and y. HA: There is a corelation between at least one of the x’s and y.
In Table 4, the correlation between the x’s and y’s were evaluated using Spearman’s rho correlation. It was observed that the grades are negatively correlated to the variables under consideration at different strengths. Furthermore, the grades were strongly correlated to the concentration of Pb and preservatives, moderately correlated to the sleep hours and weakly correlated to BMI. With the exclusion of BMI, the correlations between grades and Pb concentration, preservatives and sleep hours were statistically significant with a p-value less than 0.05. Hence, we reject the null hypothesis and accept the alternative hypothesis to infer that there is a correlation between grades with lead concentration, preservatives, and sleep hours at a 95 percent confidence level. To model the relationship and predict the grades, a regression modelling was done.
| Correlation | Lead | BMI | Grades | Preservatives | Sleep hours | |
|---|---|---|---|---|---|---|
| Grades | Correlation Coefficient | -.708** | -.166* | 1 | -.739** | -.484** |
| Grades | Sig. (2-tailed) | <.001 | 0.031 | . | <.001 | <.001 |
| Grades | N | 170 | 169 | 170 | 170 | 170 |
Table 4: Summary of Spearman’s rho correlation. **Correlation is significant at the 0.01 level (2-tailed); *Correlation is signif
As there are multiple (3) independent variables under consideration here, the test for collinearity was performed. Results show that there is no collinearity in any of the three models generated as indicated by the VIF statistics being lesser than 10 (Table 5).
| Model | Unstandardized Coefficients | Standardized Coefficients | t | Sig. | Collinearity Statistics | |||
|---|---|---|---|---|---|---|---|---|
| B | Std. Error | Beta | Tolerance | VIF | ||||
| 1 | (Constant) | 103.025 | 1.259 | 81.831 | <.001 | |||
| Preservatives | -3.465 | 0.124 | -0.908 | -27.935 | <.001 | 1 | 1 | |
| 2 | (Constant) | 129.037 | 4.889 | 26.394 | <.001 | |||
| Preservatives | -3.145 | 0.129 | -0.824 | -24.462 | <.001 | 0.793 | 1.261 | |
| Sleep hours | -3.32 | 0.606 | -0.184 | -5.478 | <.001 | 0.793 | 1.261 | |
| 3 | (Constant) | 127.747 | 4.815 | 26.533 | <.001 | |||
| Preservatives | -2.952 | 0.144 | -0.773 | -20.532 | <.001 | 0.609 | 1.641 | |
| Sleep hours | -3.21 | 0.595 | -0.178 | -5.393 | <.001 | 0.79 | 1.266 | |
| Lead conc. in urine | -47.631 | 17.097 | -0.098 | -2.786 | 0.006 | 0.701 | 1.427 | |
| a. Dependent Variable: Grades |
Table 5: Evaluation for collinearity.
By stepwise approach, three (3) regression models were generated (Table 6). The strength of the model increases from model 1, 2 and 3 with an R value progressively increasing from 0.908, 0.922 and 0.926. Model 1 explains about 82 percent of the variability when considering only preservatives. Addition of sleep hours produces model 2 to explain about 85 percent of the variability. Lastly, the inclusion of preservatives, sleep hours and Pb concentration produces model 3 to explain about 86 percent of the variability. Considering all three models to predict the grades of the students shows a statistical significance with 95 percent confidence (Table 7).
Of the three models, model 3 is the strongest model and the equation for the model (from Table 5) is:
ŷ = 127.747- 47.631 x1 -3.210 x2 -2.952 x3 Equation 1: Equation based on coefficients from model #3.
where ŷ, x1, x2 and x3 are the predicted grade, lead concentration (in ppb), sleep hours and rate of preservative consumption, respectively. It is also worth noting that based on the (beta) coefficients in the equation, there is a negative/ inverse relationship between ŷ and x1, x2 and x3.
| Model | R | R Square | Adjusted R Square | Std. Error of the Estimate | Change Statistics | ||||
|---|---|---|---|---|---|---|---|---|---|
| R Square Change | F Change | df1 | df2 | Sig. F Change | |||||
| 1 | .908a | 0.824 | 0.823 | 8.62205 | 0.824 | 780.37 | 1 | 167 | <.001 |
| 2 | .922b | 0.851 | 0.849 | 7.95855 | 0.027 | 30.006 | 1 | 166 | <.001 |
| 3 | .926c | 0.857 | 0.855 | 7.80126 | 0.007 | 7.761 | 1 | 165 | 0.006 |
| a. Predictors: (Constant), Preservatives | |||||||||
| b. Predictors: (Constant), Preservatives, Sleep hours | |||||||||
| c. Predictors: (Constant), Preservatives, Sleep hours, Lead conc. in urine | |||||||||
| d. Dependent Variable: Grades |
Table 6: Summary of regression model by stepwise approach.
- Model
- Sum of Squares df
- Mean Square
- F
- Sig.
- Regression
- 58012.412
- 1
- 58012.412
- 780.37
- <.001b
- 1
- Residual
- 12414.724
- 167
- 74.34
- Total
- 70427.136
- 168
- Regression
- 59912.944
- 2
- 29956.472
- 472.958
- <.001c
- 2
- Residual
- 10514.192
- 166
- 63.339
- Total
- 70427.136
- 168
- Regression
- 60385.29
- 3
- 20128.43
- 330.735
- <.001d
- 3
- Residual
- 10041.846
- 165
- 60.86
- Total
- 70427.136
- 168 a. Dependent Variable: Grades b. Predictors: (Constant), Preservatives c. Predictors: (Constant), Preservatives, Sleep hours d. Predictors: (Constant), Preservatives, Sleep hours, Lead conc. in urine
Table 7: ANOVA Summary for the Regression Model.
Taken together, the analysis shows that the grades of the students have a correlation with the concentration of Pb in urine, sleep hours and rate of preservative consumption, and the grades can be predicted using the equation from model 3 with a confidence level of 95 percent.
Question
Is there an association between the performance groups and the behaviours surveyed among the students? Units of analysis: Middle school students of Qatar Variables used: binomial response to importance of lessons, riots, vandalism, troublemaking, physical/verbal abuse and anger.
H0: There is no association between the performance groups and the behaviour under consideration. HA: There is an association between the performance groups and the behaviour under consideration.
Figures 2-7 summarizes the responses of the surveyed students. It was observed that negative and violent behaviours like rioting, vandalism, troublemaking, abuse towards school administrators frequently occurred among students of poor performance. In contrast, importance of lessons and feelings of anger towards violent behaviour in school was frequently observed among students of good performance [11, 12].
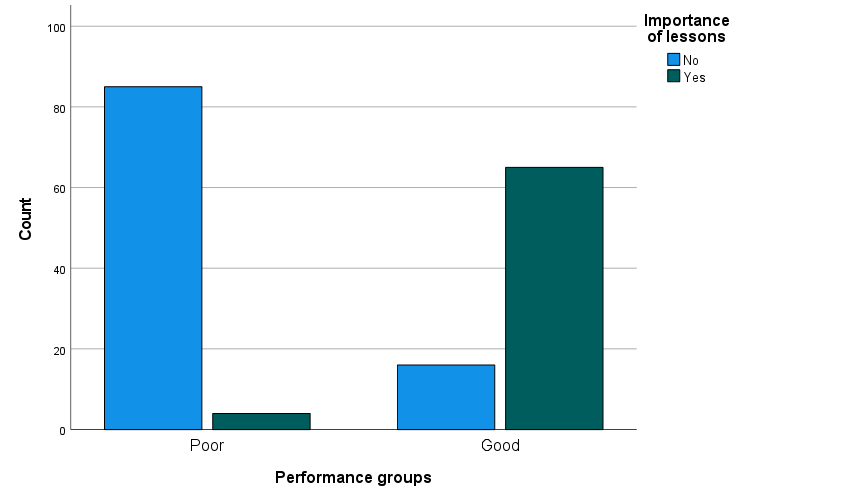
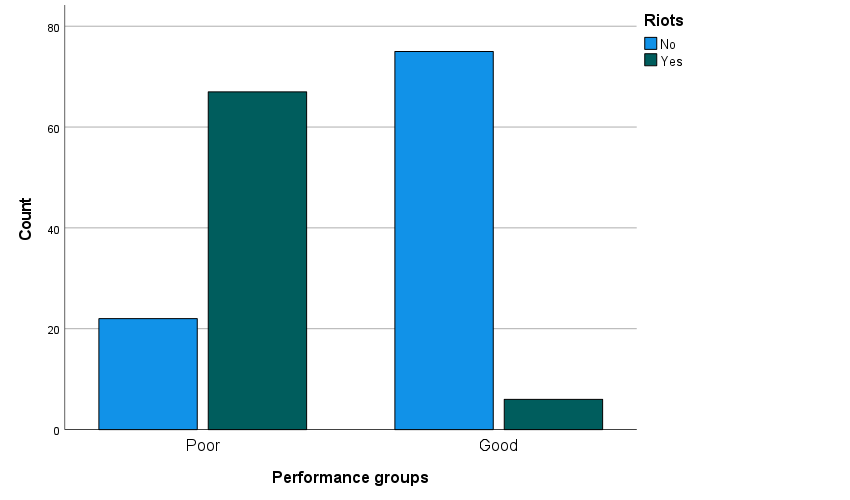
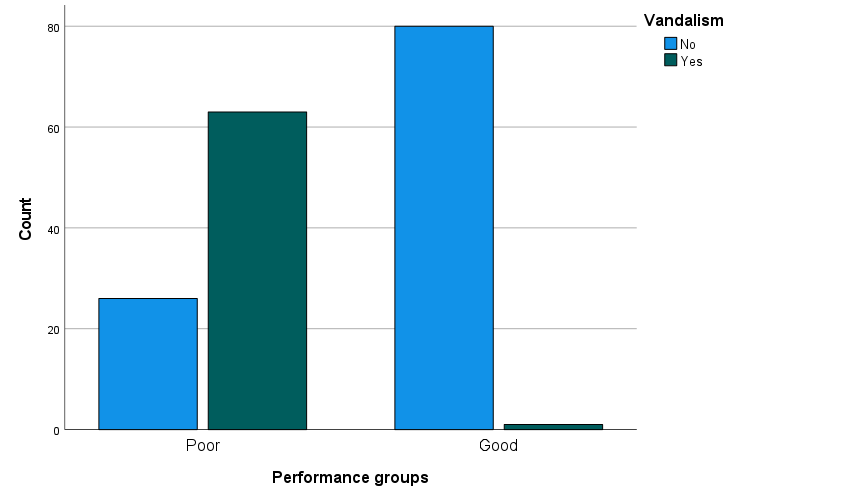
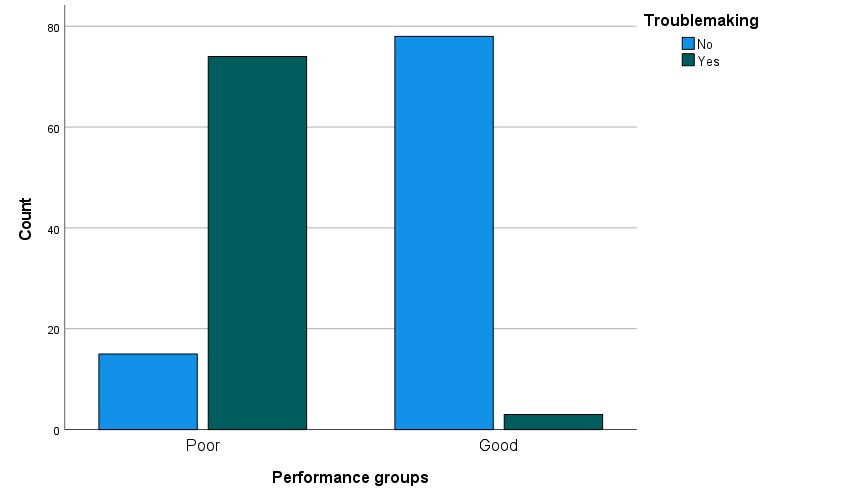
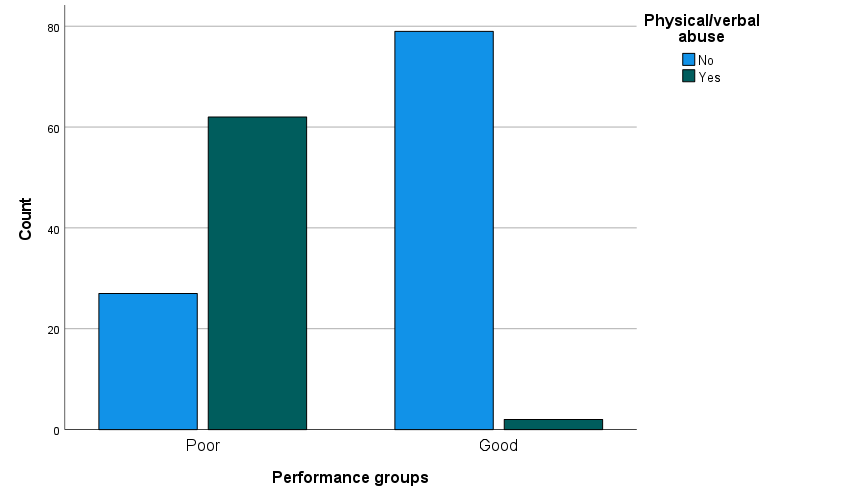
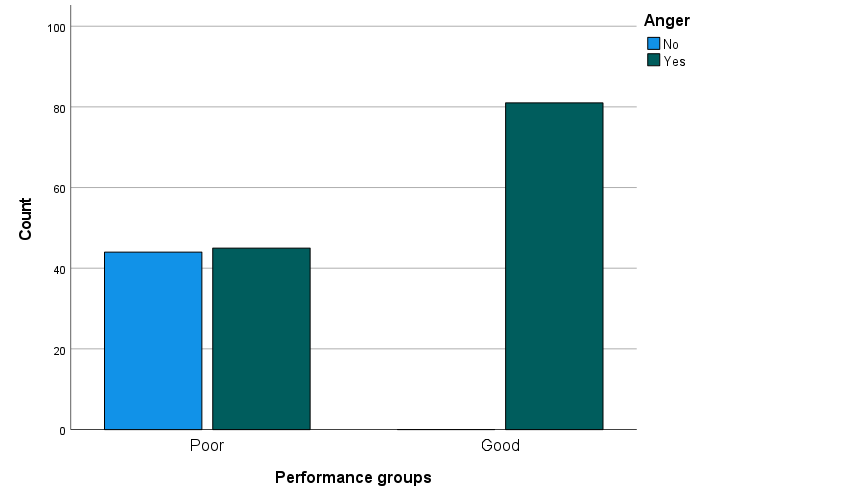
A chi-square analysis for the association between the categorical variables indicated an association between the cross tabulations with a p-value lesser than 0.05 (Table 8). Hence, null hypothesis is rejected, and it can be concluded that there is a statistically significant association between the performance groups and the behaviour under consideration with a confidence level of 95 percent.
| Pearson Chi-Square Value | Asymptotic Significance (2-sided) | |
|---|---|---|
| Performance groups* importance of lessons | 100.913 | <.001 |
| Performance groups * riots | 79.731 | <.001 |
| Performance groups * vandalism | 87.389 | <.001 |
| Performance groups * troublemaking | 108.008 | <.001 |
| Performance groups * physical/verbal abuse | 81.564 | <.001 |
| Performance groups * anger | 54.029 | <.001 |
Table 8: Summary of Chi-Square Tests.
Conclusion
To summarize, results showed that the grades are significantly negatively correlated with the concentration of Pb, sleep hours and rate of preservative consumption which can be modelled using Equation 1. Similarly, the performance of the student’s id significantly associated with the violent and negative behaviours. The poor performance of the students is indicated by the low grades (score: 50- 60) is significantly associated with the presence of higher concentrations of Pb in the urine in comparison to the good performing students. The outcomes of this study also highlight the feasibility of observable behaviours and quantifiable biochemical indicators to predict a student’s performance in academics. Furthermore, the association of the consumption of preservatives and daily sleep hours with the performance of the students are indicator to provide awareness to the students, school administrators and the public. The detectable presence of a toxicant like Pb, in this case, to impact academic performance and behaviour necessitates further validation as well as provision of guidelines for public health.
References
-
Mbonane TP, Mathee A, Swart A, Naicker N (2019) study protocol to determine the association between lifetime lead exposure and violent criminal behaviour in young males in conflict with the law. BMC Public Health 19: 932.
-
Naicker N, Jager P, Naidoo S, Mathee A (2018) Is There a Relationship between Lead Exposure and Aggressive Behavior in Shooters? Int J Environ Res Public Health 15(7): 1427.
-
Wright JP, Dietrich KN, Ris MD, Hornug RW, Wessel SD, et al. (2008) Association of prenatal and childhood blood lead concentrations with criminal arrests in early adulthood. PLoS Med 5(5): e101.
-
Swati B, Maher TJ (2012) Neurobehavioral effects of lead and manganese individually and in combination in developmentally exposed rats. Neurotoxicology 33(5): 1117-1127.
-
James JF, Christopher M (2016) Lead Exposure and Violent Crime in the Early Twentieth Century. Explorations in Economic History 62: 51-86.
-
WHO (2021) Growth reference 5-19 years - BMI-for-age (5-19 years). World Health Organization.
-
(2017) Lead Exposure in Children Affects Brain and Behavior. American academy of child and adolescent psychiatry.
-
Dietrich KN, Ris MD, Succop PA, Berger OG, Ornschein RL (2001) Early exposure to lead and juvenile delinquency. Neurotoxicol Teratology 23(6): 511-518.
-
Einstein AB, Podolsky, Rosen N (1994) Can quantum- mechanical description of physical reality be considered complete?. Phys Rev 47(10): 777-780.
-
Jolly JK, Pabello N, Bolivar VJ, Lawrence D (2012) Developmental lead effects on behavior and brain gene expression in male and female BALB/cAnNTac mice. Neurotoxicology 33(5): 1005-1020.
-
Nevin R (2007) Understanding international crime trends: the legacy of preschool lead exposure. Environ Res 104(3): 315-336.
-
Needleman HL, McFarland C, Ness RB, Fienberg S, Tobin M (2002) Bone lead levels in adjudicated delinquents: A case control study. Neurotoxicology Teratol 24(6): 711- 717.
- Pattern of Gonadal Hormones in Oral Testosterone-Supplimented Male Wistar Rats with Diabetes-Induced Hypogonadism
- Re-Evaluation of the Genotoxicity of Currently Used Food Dyes in Mouse Multiple Organs Via Continuous Administration by Drinking Using the Comet Assay
- Pharmacogenetics of Type 2 Diabetes Mellitus: Linking Genetic Variability to Drug Efficacy and its Cardiovascular Outcomes
- Exploratory Proteomic Profiling of SARS-CoV-2 Infected THP-1 Macrophages Reveals Alterations in Inflammatory Response and Cellular Metabolism
- Study of Genotoxicity of Hepatocarcinogens in Multiple Organs in Mice by Feeding and Drinking Using the Comet Assay
- Spirulina Polypeptides Inhibit the Growth of Human Lung Tumor (H460) Cells