Concentrations and Health Risks Related to PAHs in Indoor and Outdoor Air, A Systematic Review
Polycyclic Aromatic Hydrocarbons (PAHs) are a group of organic compounds with two to seven benzene rings and are a group of environmental pollutants. They are produced generally by incomplete combustion of combustible materials such as fossil fuels. Some PAHs are carcinogenic, mutagenic and teratogenic. The databases used in this study were Science Direct, Google Scholar and Springer. Among the 2650 articles found, 17 articles met our criteria. The results show that, the concentration of PAHs in rural areas, both indoor and outdoor (1689.32 and 718.58 µg/m3), is higher than in urban areas (720.86 and 529.79 µg/m3), respectively. Regarding the results, the type of applied fuel is influencing the concentration of PAHs. So that, PAHs released from combustion of coal was higher than remain (10750.1 µg/m3). The highest lifetime cancer risk (LTCRs) and hazard quotient (HQ) were for exposure to the concentrations of indoor PAHS in the rural areas (3.69×10⁻⁷ and 2.96×10⁻⁶), respectively.
Introduction
The air quality is related to concentration of air pollutants that may be in form of particulate materials (PMs) or gas. Some of the pollutants can be in both forms and be related to PMs, such as PAHs. It is reported that vehicle exhaust, coal combustion and biomass burning are the main sources of PAHs in indoor and outdoor environments [1]. The formation of multiple rings of PAHs is a function of combustion temperature. It can vary according to the type of fuel and combustion methods [2]. There are several studies that reported indoor and outdoor concentrations of PAHs and effect of the used fuels, season, and parts of the houses on the concentrations. The stoves that are used in urban and rural houses use different fuels such as biomass, coal, LPG and electricity. It is reported that, the daily average concentration of pPAH15 in the kitchen was 1400, 3300, and 1500 ng/m3, respectively, as LPG, straw, and wood were used in summer time [3]. It is declared that among the various biomass fuels, raw plant straw had the highest PAHs emission. Bean straw produced the highest PAHs and BaPeq compared to other biomasses [4]. The reported order of PAHs emission for the tested fuels is dung cake > firewood > coal > LPG > kerosene. Higher PAHs emissions were observed during the combustion of solid fuel (dung, firewood and coal) compared to non-solid fuels (LPG and kerosene). The total concentration of PAHs measured for the tested fuels ranged from 1.45 mg/m3 (for LPG) to 4.67 mg/m3 (for dung cake) at the sampling point [5]. Gas-phase PAHs (NAP) were significantly higher in houses using plant products as fuel (20,000 ng/m3) than in houses using coal as fuel (2,900 ng/m3) [6]. The mean concentrations of gaseous PAHs were higher in rural houses (range 0.81–6.09 μg/m3) compared to urban houses (range 0–2.59 μg/m3) [7]. The average concentration of PAHs and NPAHs in indoor kitchen air during the cooking period was 4049.1 and 1741.6 ng/ m3, respectively [8]. Due to the decrease in temperature in the winter season in the rural areas of northeastern China, biomass fuels are widely used for heating and cooking. This issue increases the concentration of PAHs in the inner areas of the village during the heating period and threatens human health. The results of the study showed that the average concentration of indoor PAHs in rural areas during the heating period (93.02 ng/m3) was about 1.81 times higher than the non-heating period (51.26 ng/m3) [9]. Analysis of the I/O ratios of individual PAHs allowed the recognition of two patterns of indoor PAHs sources, pollution from outdoor combustion penetrating the indoor environment and indoor burning of solid fuel sources [10]. In one case, total indoor PAHs values were 22.9 ng/m3 (4.82–44.8 ng/m3) and 2.35 ng/ m3 (5.53–0.79 ng/m3) for harvest and non-harvest seasons, respectively, indicating that during the seasons of sugarcane harvesting and waste burning, a significant amount of PAHs enter residential areas [11]. Kitchen/outdoor, living room/ outdoor PAHs ratios of one for all combinations of PAHs were higher than 1 in urban homes, indicating additional indoor sources, while in roadside homes, the inlet/outlet ratio was less than 1, indicating suggests that indoor concentrations of these PAHs may also be attributed to outdoor sources [12]. A significant decrease of I/O ratio in various studies indicates that internal sources of PAHs are more effectively controlled than external sources. Furthermore, the higher I/O ratio for ΣPAH compared to BaPeq suggests that indoor sources of PAHs have a lower carcinogenic risk than outdoor sources [13]. In winter, the diurnal variation in PAHs concentration between the kitchen and the adjacent bedroom was similar; indicating that the PAHs concentration in the bedroom, when all doors and windows were closed in winter, was mainly originates from the kitchen. In summer, there was no correlation between the concentration of PAHs in the bedroom and the kitchen or between the bedroom and the outdoors [3]. The average total concentration of PAHs in the open air for spring, summer, autumn and winter was 27.1, 9.1, 15.0 and 200.1 ng/m3, respectively. Meanwhile, the highest concentration appeared in winter, then in spring and autumn, and the lowest in summer. Seasonal variation of PAHs in residential house was similar to outdoor [14]. PAHs bound to PM>2.5 showed higher levels in winter than in summer, contrary to the trend observed in TSP, indicating that during winter PM>2.5 mainly originates from indoor emission sources [15]. In general, low-weight PAHs (i.e., with two, three, or four rings) are more volatile (with low temperatures of condensation) and exist mainly in the gas phase [16]. Compounds of 3-ring PAHs (snapthalene, acenapthene, fluorene, phenanthrene, and anthracene) constitute more than 50% of the particulate phase PAHs [17]. Although the lighter PAH compounds are considered to be less toxic, they are able to react with other pollutants (such as ozone, nitrogen oxides, and sulfur dioxide). PAHs with four or more rings show insignificant vaporization under all environmental conditions. Most of the heavier PAHs therefore occur mainly in the particulate phase in the atmosphere due to their low vapor pressure. The acute effects of PAHs on human health will depend mainly on the extent of exposure (e.g., length of time), the concentration of PAHs during exposure, the toxicity of the PAHs, and the route of exposure, e.g., via inhalation, ingestion, or skin contact. Many other factors may also affect health impacts. These include factors such as pre-existing health conditions and age. Short- term exposure to PAHs also has been reported to cause impaired lung function in asthmatics and thrombotic effects in people affected by coronary heart disease. In contrast, occupational exposures to high levels of pollutant mixtures containing PAHs are known to result in symptoms such as eye irritation, nausea, vomiting, diarrhoea, etc. For workers exposed to mixtures of PAHs and other work place chemicals, a series of health problems (an increased risk of skin, lung, bladder, and gastrointestinal cancers) have been reported [16]. In this regard, studding the concentration of PAHs in different environments to understand the concentration levels and the main effective factors on concentration of PAHs is important to evaluate the health risks and the health risk management strategies.
The Study Method
Current systematic review searched three databases of “google scholar”, “Science direct” and “Springer” from August 1st to September 1st of 2022, and the articles published during 2000-2022 were included. The applied keywords were “PAHs” and “Indoor air pollution”. The searched phrase was “PAHs” AND “indoor air pollution” in each database. In next step, the articles that had the words “PAHs” or “indoor” in their title or summary were selected, and finally, out of
2560 found articles, 101 articles remained. After reading and reviewing these articles and removing the articles that were not for air concentration of PAHs (such as urine, food, blood), 21 articles remained and were included in the current study.
Results and Discussions
Concentration of PAHs
It is known that PAHs can be responsible for the particulate matters (PMs) in air or be related to the PMs.
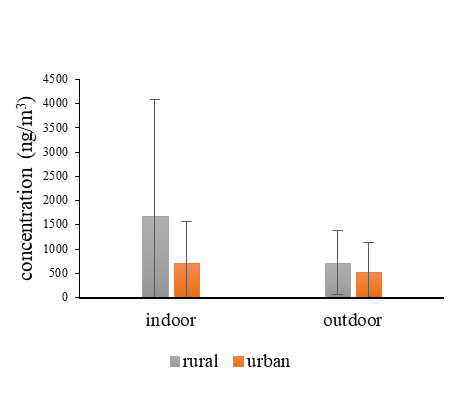
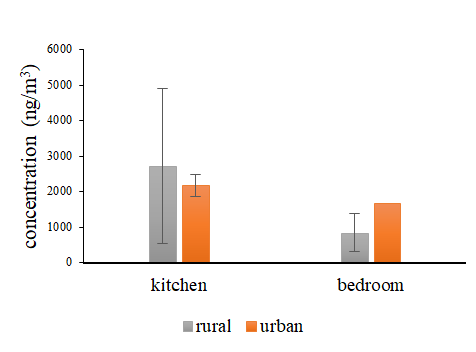
Studies to determination of PAHs generally are associated with sampling of the PMs. In this line of research, a study by Ansari et al investigated the PAHs content in PM2.5 and PM10 fractions collected from rural houses during cooking with different biomass fuels. The results of this study showed that, using the planet material the concentrations of PAHs as PM2.5 and PM10 were 6.21±1.54 and 7.75±1.42 µg/m3, respectively. And when using “planet material” + “cattle dunk cake” they were 12.43±1.15 and 15.77±1.05 µg/m3, respectively [1]. Some studies reported indoor and outdoor concentration of PAHs in rural and urban areas. Respect to the reports, the mean indoor concentration of PAHs is higher than the outdoors (Figure 1), and this difference is much greater in rural areas compared to the urban areas (indoor rural 1689.32±2391.17, outdoor rural 718.58±662.46, indoor urban 720.86±847.73, outdoor urban 529.74±606.14 ng/m3) [3, 9, 10, 12, 18, 19, 20, 21]. The reason for this can be considered the use of solid fuels in rural areas and not using air conditioners, especially hoods in the kitchen. In some studies, PAHs concentration was compared in different areas of rural and urban houses. The results showed that the pollutant concentration in kitchens in rural areas (2725.74±2175.42 ng/m3) was higher than in urban areas (2173.42±320.43 ng/m3), but the pollutant concentration in bedrooms in urban areas (1666.78 ng/m3), is much higher than in rural areas (841.83±540.08 ng/m3) (Figure 2) [3, 4, 8, 12, 20, 21]. If we consider the kitchen as the source of PAH production in residential houses, the pollutants are spread in the house and the amount of spread and concentration in different places depends on several factors, in this line Masih, et al. [12] investigated the concentration of PAHs in different areas of the house in an urban environment and in a roadside environment. In general, the pollutant concentration was higher in all internal and external areas in the roadside area. Concentration in the kitchen, living room and outdoor of the roadside house are 2824.87, 2161.26, 3294.28 ng/m3, respectively; and in the kitchen, living room and outdoor of the urban house are 1946.84, 1666.78, 1212, 57 ng/m3, respectively [12]. It seems that this difference in concentrations is due to high traffic near the roadside houses. In the study conducted by Chen, et al. [20] on the difference of PAHs concentration in different seasons in the outdoor air, and the pollutant concentration was obtained in spring (27.1 µg/m3), summer (9.1 µg/m3), autumn (15 µg/m3) and winter (200.1 µg/m3). The data shows that the concentration of PAHs in winter is much higher than other seasons, which can be due to the use of various fuels in the home environment for heating purposes and the lack of indoor air conditioning due to the cold season and closed doors and windows [1].
Type of Fuel in Concentration of PAHs
The difference in urban and rural life has caused a difference in the type of house, the type of household items and even the type of use of household items. One of these differences is the difference in the oven used in the kitchen. There are different types of stoves and each of them needs a specific type of fuel according to their use and design. In the conducted studies, the difference in the type of fuel is a very important factor in determining the concentration of PAHs. In this way Feng, et al. [8] conducted a study on the concentration of PAHs in some types of stoves with coal fuel, LPG and electric stoves. The PAHs concentration in them was
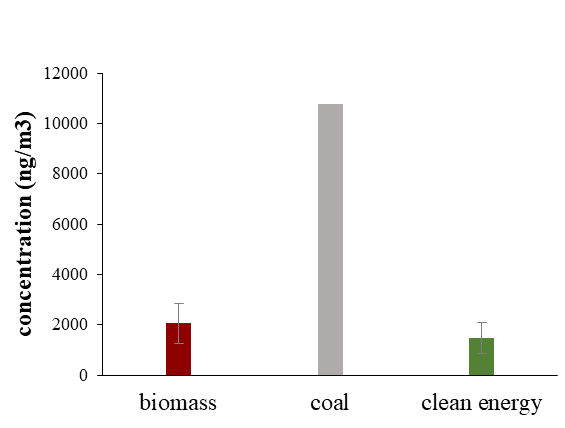
10750.1, 2139.8 and 1846 ng/m3 respectively [8]. In another study Tiwari, et al. [5] investigated the number of PAHs in firewood, coal, dung cake, kerosene, and LPG. The most pollutant for dung cake (4672 µg/m3), then firewood (4047 µg/m3), then coal (3423 µg/m3), then kerosene (2442 µg/ m3), and finally LPG (1481 µg/m3) were the most polluting [5]. The results of studies showed that concentration of PAHs with burning of coal is higher than biomass and LPG (Figure 3). The average concentration of PAHs in the indoor environment resulting from the burning of coal, biomass and clean energies (LPG, electricity) were 10750.1, 2054.5 and 1475.4 ng/m3, respectively [3, 5, 8, 12, 21].
Inhalation Risk Assessment
A growing body of evidence suggests that exposure to B(a)P at levels over 1.0 ng/m3 induces DNA damage. The corresponding concentrations for lifetime exposure to B(a) P producing excess lifetime cancer risks of 1/10 000, 1/100 000 and 1/1000 000 are approximately 1.2, 0.12 and 0.012 ng/m3, respectively. No threshold can be determined and all indoor exposures are considered relevant to health and no safe level can be arrived at. In view of the difficulties in developing guidelines for PAH mixtures, B(a)P was considered to represent the best single indicator compound (WHO 2010) [5]. In the study of Tiwari, et al, [5] where B(a)Peq concentration was investigated, it was found that firewood has the highest concentration and LPG has the lowest concentration. Exposure concentration (EC) and daily intake dose (EDI) for firewood, coal, dung cake, kerosene and LPG were 3.33×101 and 8.89, 2.38×101 and 6.35, 3.12×101 and 8.34, 9.97 and 2.66 and 7.12 and 1.9 µg/m3, respectively; Also, lifetime of cancer risk (LTCRs) and hazard quotient (HQ) in exposure to firewood, coal, dung cake, kerosene and LPG were 5.55×10⁻⁴ and 4.45×10⁻³, 3.96×10- 4 and 3.17×10⁻³, 5.2×10⁻⁴ and 4.17×10⁻³, 1.66×10⁻⁴ and 1.33×10⁻³ and 1.19×10⁻⁴ and 9.51×10⁻⁴, respectively [2]. According to the studies conducted, the concentration of PAHs has a direct relationship with the concentration of suspended substances, so that with the increase of suspended substances, the concentration of PAHs (also B(a)Peq) also increases. In this regard, in a study, Ansari et al investigated the concentration of PAHs in the indoor environment (the type of fuel in this study was biomass). The average B(a) Peq concentration associated with PM2.5 was 3.087 μg/m3 and PM10 was 3.992 μg/m3; Lifetime of cancer risk (LTCRs) and hazard quotient (HQ) B(a)Peq related to PM2.5, PM10 were 5.24×10⁻⁶ and 4.2×10⁻⁵, 6.77×10⁻⁶ and 5.43×10⁻⁵ respectively [1]. Finally, the average concentration of B(a) Peq in indoor and outdoor environment were 1.78×10² ± 3.05×10² and 7.3 ± 7.64 ng/m3, respectively; And lifetime of cancer risk (LTCRs) and hazard quotient (HQ) for indoor, outdoor enviroments were 3.02×10⁻⁷, 2.42×10⁻⁶ and 1.24×10⁻⁸, 9.92×10⁻⁸, respectively. Also, in the comparison of B(a)Peq concentration in urban and rural environment, B(a)Peq concentration in rural environment was 5.65 times that of urban environment, but in comparison of B(a)Peq in outdoor, B(a)Peq concentration in urban environment was 6.68 times that of rural environment. In urban and rural environments, the highest lifetime of cancer risk (LTCRs) was related to the indoor rural environments and the lowest level of lifetime of cancer risk (LTCRs) was related to the outdoor rural environment; Also, hazard quotient (HQ) comparison showed similar results (Table 1) [1, 3, 7, 8, 9, 11, 15, 18, 21]. The results show that the risk values are significantly higher in rural interior environments, probably due to the use of solid fuels, and in urban exterior environments, probably due to high traffic and the presence of factories.
| Point of sampling | Exposer concentration (EC) | Lifetime cancer risk (LTCRs) | Exposer dose (EDI) | Hazard quotient (HQ) | |
|---|---|---|---|---|---|
| Rural | Indoor | 2.21×10⁻² | 3.69×10⁻⁷ | 5.92×10⁻³ | 2.96×10⁻⁶ |
| Rural | Outdoor | 1.93×10⁻⁴ | 3.22×10⁻⁹ | 5.17×10⁻⁵ | 2.58×10⁻⁸ |
| Urban | Indoor | 3.92×10⁻³ | 6.5410-8 | 1.05×10⁻³ | 5.24×10⁻⁷ |
| Urban | Outdoor | 1.29×10⁻³ | 2.15×10⁻⁸ | 3.45×10⁻⁴ | 1.73×10⁻⁷ |
Table 1: The Expected Cancer and Non-Cancer Risk of Exposure to PAHs.
Conclusion
As the results show, Polycyclic Aromatic Hydrocarbons (PAHs) that have adverse effects on human health exist in the human environment, especially in the air that they inhale. Our results show that the concentration of PAHs in the outdoor environment is usually lower than the indoor environment, which can be due to the presence of the source inside the houses and the lack of proper ventilation. On the other hand, studies showed that the concentration of these pollutants may have had a source outside the house and penetrated inside, such as industrial environments where the concentration of PAHs is higher outside than inside (due to the presence of factories and industries that emit this pollutant); In these places, part of the concentration of PAHs in indoor environments is usually caused by the entry of pollutants from the outside into the inside. Another discussed factor is the type of fuel used in homes. Fuels have different emissions of pollutants. Our studies showed that among the fuels, coal had the highest amount of PAHs emission in most of the times, followed by biomass. In general, the risk of carcinogenesis and non-carcinogenesis in indoor rural environment is high due to the use of solid fuels and lack of proper ventilation and it is low in outdoor rural environment due to the absence of factories and the lack of traffic.
Acknowledgments
The authors are grateful to Semnan University of medical sciences and research center for health sciences and technology to support the availability of scientific resources to preformats of this research.
References
-
Ansari FA, Khan AH, Patel DK, Siddiqui H, Sharma S, et al. (2010) Indoor exposure to respirable particulate matter and particulate-phase PAHs in rural homes in North India. Environmental Monitoring and Assessment 170(1-4): 491-497.
-
Tiwari M, Sahu SK, Pandit GG (2015) Inhalation Risk Assessment of PAH Exposure Due to Combustion Aerosols Generated from Household Fuels. Aerosol and Air Quality Research 15(2): 582-590.
-
Ding J, Zhong J, Yang Y, Li B, Shen G, et al. (2012) Occurrence and exposure to polycyclic aromatic hydrocarbons and their derivatives in a rural Chinese home through biomass fuelled cooking. Environ Pollut 169: 160-166.
-
Du W, Wang J, Zhuo S, Zhong Q, Wang W, et al. (2021) Emissions of particulate PAHs from solid fuel combustion in indoor cookstoves. Science of The Total Environment 771: 145411.
-
Tiwari M, Sahu S, Pandit G (2016) Probabilistic single box approach for modeling PAHs associated with combustion aerosols in a typical indoor environment. Biomass and Bioenergy 86: 172-729.
-
Downward GS, Hu W, Rothman N, Reiss B, Wu G, et al. (2014) Polycyclic Aromatic Hydrocarbon Exposure in Household Air Pollution from Solid Fuel Combustion among the Female Population of Xuanwei and Fuyuan Counties, China. Environmental Science & Technology 48(24): 14632-14641.
-
Munyeza CF, Osano AM, Maghanga JK, Forbes PBC (2020) Polycyclic Aromatic Hydrocarbon Gaseous Emissions from Household Cooking Devices: A Kenyan Case Study. Environmental Toxicology and Chemistry 39(3): 538- 547.
-
Feng S, Shen X, Hao X, Cao X, Li X, et al. (2021) Polycyclic and nitro-polycyclic aromatic hydrocarbon pollution characteristics and carcinogenic risk assessment of indoor kitchen air during cooking periods in rural households in North China. Environ Sci Pollut Res Int 28(9): 11498-11508.
-
Bai L, Li C (2022) Investigation of Indoor Polycyclic Aromatic Hydrocarbons (PAHs) in Rural Northeast China: Pollution Characteristics, Source Analysis, and Health Assessment. Buildings 12(2): 153.
-
Kliucininkas L, Krugly E, Stasiulaitiene I, Radziuniene I, Prasauskas T, et al. (2014) Indoor–outdoor levels of size segregated particulate matter and mono/polycyclic aromatic hydrocarbons among urban areas using solid fuels for heating. Atmospheric Environment 97: 83-93.
-
Cristale J, Silva FS, Zocolo GJ, Marchi MRR (2012) Influence of sugarcane burning on indoor/outdoor PAH air pollution in Brazil. Environmental Pollution 169: 210-216.
-
Masih J, Masih A, Kulshrestha A, Singhvi R, Taneja A (2010) Characteristics of polycyclic aromatic hydrocarbons in indoor and outdoor atmosphere in the North central part of India. Journal of Hazardous Materials 177(1): 190-198.
-
Ma Y, Harrad S. (2015) Spatiotemporal analysis and human exposure assessment on polycyclic aromatic hydrocarbons in indoor air, settled house dust, and diet: A review. Environment International 84: 7-16.
-
Chen Y, Li X, Zhu T, Han Y, Lv D (2017) PM(2.5)-bound PAHs in three indoor and one outdoor air in Beijing: Concentration, source and health risk assessment. Sci Total Environ 586: 255-264.
-
Florencia MT, Ivan TB, Alejandra HC (2022) Health risk assessment of exposure to polycyclic aromatic hydrocarbons in household indoor environments. Environmental Advances 7: 100159.
-
Kim KH, Jahan SA, Kabir E, Brown RJC (2013) A review of airborne polycyclic aromatic hydrocarbons (PAHs) and their human health effects. Environment International 60: 71-80.
-
Sen S, Narayana J, Ravichandran B, Rajesh R (2012) Assessment of Indoor Air Pollutants with Special Reference to Particulate Phase Polyaromatic Hydrocarbon in Rural Villages. Res Rev J Toxicol 2(2): 38-45.
-
Ambade B, Kumar A, Sahu LK (2021) Characterization and health risk assessment of particulate bound polycyclic aromatic hydrocarbons (PAHs) in indoor and outdoor atmosphere of Central East India. Environmental Science and Pollution Research 28(40): 56269-56280.
-
Orakij W, Chetiyanukornkul T, Kasahara C, Boongla Y, Chuesaard T, et al. (2017) Polycyclic aromatic hydrocarbons and their nitro derivatives from indoor biomass-fueled cooking in two rural areas of Thailand: a case study. Air Quality Atmosphere & Health 10(6): 747- 761.
-
Shen G, Zhang Y, Wei S, Chen Y, Yang C, et al. (2014) Indoor/outdoor pollution level and personal inhalation exposure of polycyclic aromatic hydrocarbons through biomass fuelled cooking. Air Quality Atmosphere & Health 7(4): 449-458.
-
Zhang J, Liu W, Xu Y, Cai C, Liu Y, et al. (2019) Distribution characteristics of and personal exposure with polycyclic aromatic hydrocarbons and particulate matter in indoor and outdoor air of rural households in Northern China. Environ Pollut 255(1): 113176.
- Evaluation of Skin Aging Preventive Effects of Cherry Blossom Petal Extracts Through Antioxidant and Anti-Glycation Activities
- Is Cell Death Responsible for False Positive Results of In Vivo Comet Assay?
- Pattern of Gonadal Hormones in Oral Testosterone-Supplimented Male Wistar Rats with Diabetes-Induced Hypogonadism
- Re-Evaluation of the Genotoxicity of Currently Used Food Dyes in Mouse Multiple Organs Via Continuous Administration by Drinking Using the Comet Assay
- Pharmacogenetics of Type 2 Diabetes Mellitus: Linking Genetic Variability to Drug Efficacy and its Cardiovascular Outcomes
- Exploratory Proteomic Profiling of SARS-CoV-2 Infected THP-1 Macrophages Reveals Alterations in Inflammatory Response and Cellular Metabolism