Ecological and Health Assessment of Heavy Metals Present in the Soil of E-Waste Collection, Recycling and Dismantling Sites in the Region of DAKAR, Senegal
Soil pollution from waste electrical and electronic equipment is a growing concern in Africa. The heavy metals contained in this waste are now one of the main sources of pollution and the handling of waste electrical and electronic equipment (WEEE) is increasingly a health and environmental concern. In Dakar, several handling points of this equipment were identified and our study investigated the presence of trace metals in the soil of e-waste handling sites in the Dakar region and about the spatial distribution of Pb, Cd, Cu, Cr, Fe, As, Hg and Mn according to the activity carried out on these sites. Three categories of activity were identified, namely collection, dismantling and recycling and a control site. The results show an abundance of metals for the collection and recycling sites which were such as Fe> Mn> Pb> Cu> Cr> Cd> As> Hg. In contrast, at the dismantling sites, the average total concentration of these elements was classified as Fe> Pb> Mn> Cu> Cr> As> Cd> Hg and that of the control site was Fe> Mn> Cu> Pb> Cr> Cd> As> Hg. The estimation of the potential ecological risk (Er) in relation to the control site shows an average risk coefficient for Fe, Mn and Cr below 40 for all sites, as well as for As in the collection and recycling sites and for Cu in the collection sites. Pb, Cd and Hg showed an average level of ecological “very high risk” for all sites and As also showed a “very high risk” for the dismantling sites for an ecological risk index of “Very high ecological risk” (RI> 600) for all sites associated with a non-carcinogenic risk greater than 1 for all site categories.
Introduction
Electrical and electronic devices are increasingly playing an important role in the economic, industrial and social activities of our society. Due to the various technological revolutions that have taken place around the world in recent years, these devices continue to evolve every day, which favors the creation of new devices even more efficient [1, 2]. In order to meet the different economic and social requirements of society, the selling price of these devices may decrease depending on the country, which is sometimes to the detriment of the quality and lifespan of the equipment. This phenomenon is all the more responsible for the rapid generation of a new form of waste in the world called waste electrical and electronic equipment (WEEE or e-waste) [3, 1].
E-waste has existed since the U.S. Resource Conservation and Recovery Act [4, 5], and its sound management faces several challenges, including the alarming increase in the number of wastes, the way they are treated in developing countries and the impact they may have on health and the environment [5].
Waste is part of the fast-growing category of waste worldwide and its collection, recycling and dismantling system plays a key role in the management policy and effectiveness of this system [2,5,6,]. In Africa, the collection, recycling and dismantling of e-waste is usually done informally and sometimes in high-density areas. Some developing countries, including Ghana, Nigeria and Tanzania, are taking advantage of this practice by collecting and selling electronic equipment components [7]. This same practice is also observed in Senegal where recycling and dismantling of electronic waste is generally practiced outdoors and by hand to the detriment of worker’s health [8]. Such a management system tends to be very common in Africa and is integrated into e-waste treatment schemes, combining manual operations and mechanical sorting, among others [9, 10].
The presence in this waste of toxic elements such as heavy metals and the damage they represent for the environment and health is not always taken into account by the actors in the sector. Some inappropriate practices of separating electronic equipment are commonly used to extract the precious metals they contain. It is not surprising to see the burning of wire in copper recovery devices, or the use of acidic chemical strippers for the recovery of gold and other precious metals [11, 12]. These different practices are likely to release heavy metals in the vicinity of handling sites [13, 14]. Trace metals found in electrical and electronic equipment include arsenic (As), cadmium (Cd), chromium (Cr), copper (Cu), mercury (Hg), manganese (Mn), iron (Fe) and lead (Pb), some of which are considered priority pollutants to be monitored regularly due to their persistence and high toxicity [15, 16, 17, 18].
Previous studies have shown that these metals can be found in varying concentrations in printed circuit boards of mobile phones and in liquid crystal displays [19, 20, 21]. Some metals such as Cu and Fe are known to be essential for human growth and development at low doses [15]. At moderate doses, for example, copper is involved in cellular respiration [22]. However, at high doses, it can cause some liver and kidney damage, respiratory tract irritation and metal fever with prolonged exposure [22, 23]. In contrast, heavy metals such as Pb and Cd are known more for their harmful effect than for their health benefits. For example, chronic exposure to cadmium has been implicated in kidney damage and low bone mineral density at the bone level [24]. And the element like Pb, be recognized by the International Cancer Research Agency (IARC) as a probable human carcinogen.
On the other hand, in the environment, the presence of heavy metals in soil can be toxic to plants, animals and humans [25, 26, 27]. During prolonged exposure, these trace metals are able to biomagnifying in the environment [28]. Among these metals, Pb, Cd, Cu and Cr are able to negatively influence the yield of agricultural land that has been polluted by them in the vicinity of e-waste recycling sites [11]. However, it is not the total form of the metal in the soil that can be absorbed by the body, if the bioavailable part, i.e. the amount of dissolved fraction or the amount of heavy metal that can physiologically induce bioaccumulation or uptake by plants or other organisms, is absorbed [29].
Despite a growing number of studies already carried out in developed countries on the pollutants contained in e-waste and on the health and environmental impact of these pollutants, these continue to be exported massively to developing countries [30]. In order to highlight the link between the activities of treatment of this electronic waste in the informal environment in Senegal and the contamination of the soil by trace metal elements, this study aimed to determine the levels of metals (As, Cd, Cr, Cu, Fe, Hg, Mn, Pb) in the soil of electronic waste treatment sites in order to : (i) assess the level of contamination of each site by these trace elements, (ii) assess the ecological risk that may result from each of the activities, (iii) estimate the non-carcinogenic and carcinogenic nature of these trace elements at the level of the sites.
Materials and Methods
Study Area and Sampling
This study was carried out in the Dakar region of Senegal. Senegal is a coastal country located in West Africa between 12º80 and 16º41 north latitude and 11º21 and 17º32 west longitude [31]. Three categories of activity sites in the informal environment have been identified: collection sites, recycling sites and dismantling sites (Figure 1).
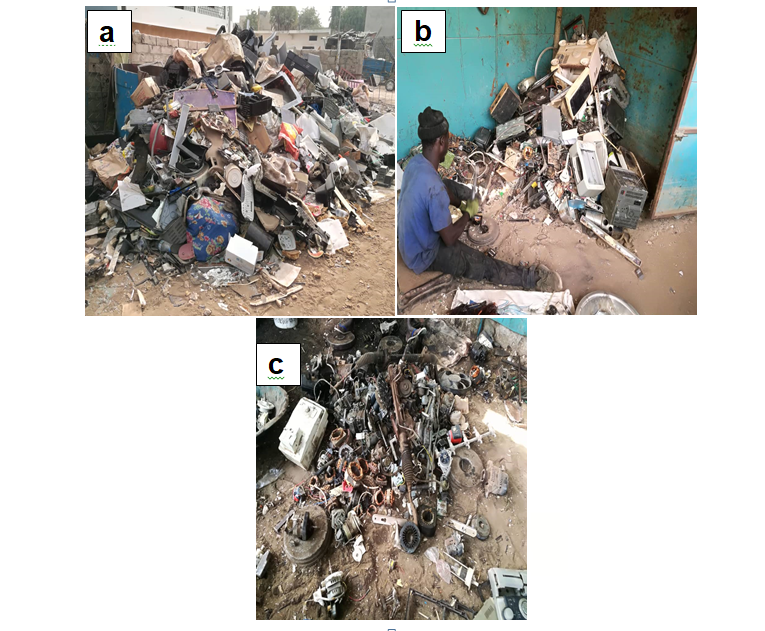
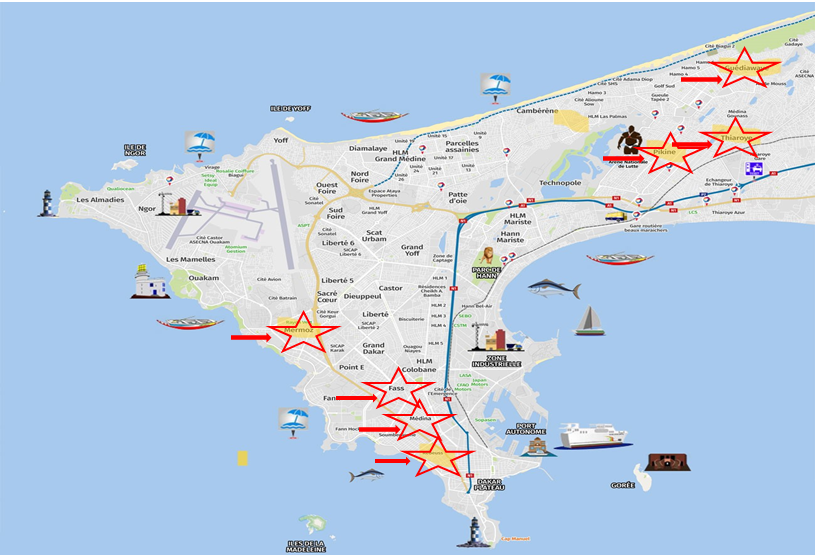
Figure 2: Distribution of e-waste areas.
Figure 2 shows the location of the sites where these activities were identified and which were used for soil sampling. The soils were collected at 17 sites in eight districts of the Dakar region, namely Rebeuss, Salle de Vente, Medina, Fass, Mermoz, Pikine, Guédiawaye and Thiaroye. The choice of sites was guided by the practice of one of the activities on each of the sites and sampling was done by the snowball method [13]. Collection sites were points where e-waste was collected and stored after being collected on city streets. Recycling sites, on the other hand, were sites where electronic waste was sorted and materials that could be reused were recovered and then transferred to other appliances or sold to the highest bidder. The dismantling sites were those where electronic waste is broken down or broken down for its components (Figures 1 & 2).
A control soil was also collected during the campaign; This witness soil came from the district of Bambilor which is also located in the Dakar region and which had no known history of handling or dismantling electronic waste.
The soil sampling was carried out during the month of June 2021; this month corresponds to the hot season in the Dakar region. The samples were taken at a depth of 0 to 5 cm and once collected, they were stored in plastic bags before being transported to the Laboratory of Toxicology and Hydrology of Faculty of Medicine, Pharmacy and Stomatology of Cheikh Anta Diop University of Dakar for analysis. For each site, 5 soil subsamples were collected and used to obtain a soil/ash/dust composite representative of the site.
Treatment and Analysis of Samples
Once in the laboratory, the samples were dried and then sieved to remove metal debris, pieces of stone and rock, etc. A homogeneous composite representative of each category of activities was then ground and passed through a sieve of different diameters. Fractions smaller than 100 microns of meshes were used for characterization and quantification in metallic trace elements.
Soil Characterization
The methods described by Maiti SK [32] were used for the determination of pH and conductivity. The soil pH was measured after 2 hours of agitation of the soil/double- distilled water mixture saturated with CaCl2 in a ratio of 1:2.5 (w/v). For conductivity, it was measured in the supernatant of the soil/water mixture e at a ratio of 1:5, after 1 hour of stirring (w/v) [32].
Total Determination of Metals
The total fraction of trace metals (As, Cr, Cd, Cu, Fe, Hg, Mn and Pb) present in different soils was determined using the slightly modified method of the American Public Health Association [33]. Briefly, 0.5 g of soil was treated with 5 mL of nitric acid for trace metal analysis. The resulting mixture was filtered and the final volume was completed at 50 mL and stored at 4 °C until analysis by flame atomic absorption spectrometer.
Bioavailable Fractions of Metals
The bioavailable fraction of trace metals in soil from e-waste sites was determined using the method described by Diop C, et al. [31]. Briefly, 1 g of soil were attacked for 24 hours, at room temperature and with continuous stirring, with 20 mL of 1M HCl. The extraction of the bioavailable fraction of metals by 1 M HCl is comparable to the sum of the first three reactive fractions [31].
Environmental Assessment
The environmental impact of heavy metals was assessed by determining the geoaccumulation index (Igeo), enrichment factor (EF), contamination factor (CF), degree of contamination (Cdeg) and potential ecological risk (RI) of the soil for each study site. For a better understanding of our results in relation to contexts, the geochemical background values that were used are those of the control soil.
Geoaccumulation Index
The Geoaccumulation Index (Igeo) assesses soil contamination by comparing site concentrations with reference or control soil [34]. Originally used for bottom sediments, it can also be applied to the assessment of soil contamination and is determined by the following mathematical equation [35].
C Igeo B = (1)
2 log 1,5 n n Cn (mg.kg-1) represents the concentration of element n in the soil of e-waste. Bn is the geochemical background (mg.kg-
1) of the element n defined by Nazzal Y, et al. [36]. The constant 1.5 represents the influence of deposits and geological features, reduces the effect of human activities, and is used as a correction factor for anthropogenic influence in the calculation. Igeo can be divided into seven classes according to Torabi Kachoosangi’s classification [35] (Table 1).
| Level | Soil pollution | If | Category |
|---|---|---|---|
| I <0 geo | Unpolluted | EF <1.5 | No enrichment |
| 0 ≤ I ≤ 1 geo | unpolluted has moderately polluted | 1.5 ≤ EF <2 | Slight enrichment |
| 1 <I ≤ 2 geo | moderately polluted | 2 ≤ EF <5 | Moderate enrichment |
| 2 <I ≤ 3 geo | moderately to severely polluted | 5 ≤ FE <20 | Severe enrichment |
| 3 <I ≤ 4 geo | severely polluted | 20 ≤ <40 | Very severe enrichment |
| 4 <I ≤ 5 geo | severely to severely polluted | 40 <FYe | Extremely severe enrichment |
| 5 <I geo | extremely polluted |
Table 1: Classification of accumulation index G (Igeo) and enrichment factor (EF).
Table 1: Classification of accumulation index G (Igeo) and enrichment factor (EF).
Enrichment Factor
Enrichment factor (EF) is defined for soil as the ratio between the relative concentration of an element in a sample and the relative concentration of the same element in a reference environment [34]. Iron can be applied as a reference element in this study, as Senegal’s soil is a clayey ferrous soil [37]. Hasan AB, et al. [38] classification (Table 1) were used to locate the level of enrichment of different soils and the following mathematical formula (2) by Torabi Kachoosangi F, et al. [35] made it possible to carry out the calculation:
/ C C EF B B =
n fe (2) / n fe
Cn (mg.kg-1) represents the concentration of element n in the soil studied, Bn (mg.kg-1) represents the concentration of element n in the reference soil. Cfe (mg.kg-1) and Bfe (mg. kg-1) represent the concentration of iron in the sample and the reference soil, respectively [38, 35].
Contamination Factor and degree of Contamination
The contamination factor (CF) was determined to assess the overall level of heavy metal pollution in soil samples from the study area. It was determined using equation (3) and classified according to Ngai KW, et al. 2021 [39] (Table 2).
C CF C η = (3)
n m Cn (mg.kg-1) represents the concentration of heavy metals in the soil sample and Cm (mg.kg-1) represents the value in the reference soil [39].
The degree of contamination Cdeg was calculated using equation (4).
i C CF =∑ (4) n
deg 1 Cdeg is a parameter for determining the level of pollution of sites by adding the contamination factors (〖CF〗_i) of trace metals found. Contamination factors and degree of contamination were also classified by Shirani et al. 2020 (Table 2).
| Contamination factor | Degree of contamination | ||
|---|---|---|---|
| Level | Classification | Level | Classification |
| C 1 i < | Low contamination | C 8 deg < | Low degree |
| 1 ≤ C 3 f < | Moderate contamination | 8 ≤ C <16 deg | Moderate degree |
| 3 ≤ C 6 f < | Considerable contamination | 16 ≤ C <32 deg | Considerable degree |
| C ≥ 6 f | Very high contamination | C 32 U ≥ | Very high degree |
| He | Re | ||
| Level | Classification | Level | Classification |
| E n< 40 r | Low risk | RI <150 | Ecological risk |
| 40 ≤ < 80En r | Moderate risk | 150 ≤ RI 300 < | Moderate ecological risk |
| 80 ≤ < 160En r | Considerable risk | 300 ≤ RI <600 | Significant ecological risk |
| 160 ≤ < 320En r | High risk | RI≥ 600 | Very high ecological risk |
| E n≥ 320 r | Very high risk | - | - |
Table 2: Classification of contamination factors and degree of contamination (Hakanson 1980).
Potential Ecological Risk Index
The ecological risk assessment of e-waste was conducted by determining the Potential Ecological Risk Index (RI) and is given by the following equation:
n n n n r r n RI E T CF = = ∑ ∑ (5)
0 0 Where Er is the coefficient of potential risk to the environment and Tr is the toxic response factor (Tr). The Tr
for Cu, Fe, Cd, Mn, Pb, As, and Hg is 5, 1, 30, 1, 5 10 and 40 mg/ kg respectively [39, 40]. RI and Er were classified according to the Shirani, et al. [39] (Table 3).
Table 3: Classification of the Potential Ecological Risk Index.
Health Risk Assessment
Health risk assessments from ingestion, inhalation and dermal exposure were conducted to estimate the potential health consequences of heavy metals [41, 42]. Equations (6), (7) and (8) were used to determine the chronic daily intake (CDI) and also to estimate health risks (U.S.EPA 1989; U.S.EPA 2001) [43, 42]. The values of the constants are given in (Table 4).
IngRxEFxED CDI C BWxAT
6 10 ing bsoil − = (6)
InhRxEFxED CDI C PFExBWxAT
6 10 ing bsoil − = (7)
SAFxSAxABSxEFxED CDI C BWxAT
6 10 ofm bsoil − = (8)
The health risk in our study was assessed using the hazard index (HI) for non-carcinogenic elements and adding the individual hazard quotient. The hazard quotient (HQ) was calculated for each route of exposure by dividing the CDI by the reference values (Rfd) of the metals studied. HQ and HI are calculated by the following formulas:
CDI HQ Rfd = (9) i i
i i HI HQ =∑ (10)
n The non-carcinogenic risk is accepted when HI < 1. For HI> 1, non-cancer effects could occur, with a probability that tends to increase proportionally to the HI value [44, 42]. For carcinogens, the corresponding CDI value is multiplied by the corresponding carcinogenic slope factor (SF) to produce a cancer risk estimate (CR) [45, 46]. Total carcinogenic risk (TCR) was obtained by summing the carcinogenic risks for each site. CR and TCR values between 1x10⁻⁶ and 1x10⁻⁴ indicate acceptable carcinogenic risk, while values above 1x10⁻⁴ indicate significant health hazards [45].
| Parameters | Symbol | Units | Values | References |
|---|---|---|---|---|
| Chronic Daily Intake | CDI | (mg/kg)/day | ||
| Concentration of heavy metals in soil | C | mg/kg | ||
| Average time non- cancer | TA | Days | 30 × 365 | (U.S.EPA 2001) |
| Average time cancer | ATC | Days | 70 × 365 | (U.S.EPA 2001) |
| Chronic reference dose | Rfd | Per (mg/kg)/day | Ingestion RfD: 0.0035 (Pb), 0.001 (Cd), 0.04 (Cu), 0.046 (Mn), 0.003 ( Cr), 0.0003 ( As) | (Kamunda et al. 2016; Liang et al. 2017; Obiri-Nyarko et al. 2021) |
| RfD inhalation: 0.00352 (Pb), 0.000057 (Cd), 0.0402 (Cu), 0.000143 (Mn), 0.0000286 (Cr), 0.000301 (As) | (Liang et al. 2017; Mowla et al. 2021; Obiri-Nyarko et al. 2021; Shashi et al. 2021) | |||
| Dermal RfD: 0.000123 (Pb), 0.0005 (Cd), 0.012 (Cu), 0.00184 (Mn), 0.00006 ( Cr), 0.000123 (As) | (Kamunda et al. 2016; Liang et al. 2017; Mowla et al. 2021; Obiri-Nyarko et al. 2021; Shashi et al. 2021) | |||
| Carcinogenicity slope factor | SF | Per (mg/kg)/day | SF ingestion: 0.0085 (Pb), 0.5 (Cr), 1.5 (As) | (Kamunda et al. 2016; Liang et al. 2017; Obiri-Nyarko et al. 2021) |
| SF inhalation: 0.042 (Pb), 6.3 (Cd), 290 (Cr), 15.1 (As) | (Affairs 2010; Kamunda et al. 2016; Liang et al. 2017; Obiri- Nyarko et al. 2021) | |||
| SF Ingestion: | (Kamunda et al. 2016; Liang et al. 2017; Obiri-Nyarko et al. 2021) | |||
| 0.0000085 (Pb), 3.66 (As) | ||||
| Body weight | BW | Kg | 67 | |
| Dermal absorption factor | ABS | Unitless | 0.1 | (Affairs 2010) |
| Exposed skin exposed surface area | HIS | m2 | 5800 | (Affairs 2010; Kamunda et al. 2016) |
| Exposure duration | ED | Year | 30 | (U.S.EPA 2001) |
| Exposure frequency | EF | Day/year | 350 | (U.S.EPA 2001) |
| Skin adherence factor | SAF | mg/cm2 | 0.07 | (U.S.EPA 2001) |
| Ingestion spleen | IngR | mg d−1 | 100 | (U.S.EPA 1989; U.S.EPA 2001) |
| Inhalation spleen | InhR | m3/day | 20 | (U.S.EPA 2001) |
| Particular emission factor | PEF | m3/kg | 1.36E−09 | (U.S.EPA 2001) |
Table 3: Parameters and values of constants used for risk assessment.
Table 4: Parameters and values of constants used for risk assessment.
Statistical Analysis
Data were recorded and processed statistically using Microsoft Excel 2019 and SPSS 24.0.12 (Statistical Package for the Social Sciences). Statistical analyses of handling sites were presented as mean deviations ± type. Pearson’s analytical correlation method was used for the multi-pair comparison of the level of correlation between heavy metals.
Results and Discussion
Sampling
During the campaign, seventeen sites dealing with e-waste were identified in eight neighbourhoods in the Dakar region. Five of these sites specialized in e-waste collection, five in recycling and the last seven in dismantling (Figure 2).
Given the climate and the many movements that take place every day on the sites, the diffusion and leaching of trace metals during the dismantling and landfilling processes of WEEE recycling can affect several parameters, including hydrogen potential and soil electrical conductivity [47].
Potential of Hydrogen and Conductivity of Soil
The physicochemical properties of the soils analysed are presented in Table 5. Our results place the pH of soils between 6.21 and 7.6 1, which classifies them as low acid to low alkaline. Among e-waste handling sites, collection sites had the highest pH (7.08), followed by recycling (6.81) and dismantling (6.69). As in our study, low acidic pH values were also found by Amphalop N, et al. [11] in Thailand. However, the pH values found here for dismantling and recycling sites are slightly lower than that obtained by Isimekhai KA, et al. [48] in Nigeria. Indeed, in his study on the distribution of heavy metals in recycling sites in the informal sector, Isimekhai KA, et al. [48] found a pH between 7.08 and 7.52 for recycling sites, and between 7.71 and 8.32 for dismantling sites [48]. pH is one of the most important factors affecting the diffusion and potential ecological risk of heavy metals [49]. In general, the mobility of metals in the environment increases with decreasing soil pH due to precipitation of metals in the form of hydroxides, carbonates or the formation of insoluble organic complexes [49, 50, 51]. Unlike the soils studied by Isimekhai KA, et al. [48] in Nigeria, the low acid nature of the dismantling and recycling sites studied here suggests that some metals such as Pb, Cd will see their toxicity increase in these two types of soils compared to collection sites.
The mean values of the electrical conductivity are generally similar for all handling sites, and higher than that of the control site (1.82 mS.cm-1) (Table 1). This indicates the presence of a large amount of inorganic substances dissolved in ionized form [52]. These conductivity results in e-waste handling sites were higher than those found in solid waste landfills in Sri Lanka which were around 1136 μS.cm-1 and 3720 μS.cm-1 respectively in the water adjacent to the landfill [53].
Concentration and Distribution of Heavy Metals in Site Soils
The determination of trace element concentrations in samples from different sites has a wide range of concentrations that varied depending on activity (Table 5). In general, the abundance of metals selected for collection and recycling sites was in this order Fe> Mn> Pb> Cu> Cr> Cd> As> Hg. On the other hand, at the dismantling sites, the total concentration of these elements was classified according to whether Fe> Pb> Mn> Cu> Cr> As> Cd> Hg and that of the control site were Fe> Mn> Cu> Pb> Cr> Cd> As> Hg. With the exception of Fe and Mn whose total average concentrations (Fe: 7599.03 mg.kg-1; Mn: 802.15 mg.kg-1) the highest was obtained in the recycling sites, the dismantling sites had the highest total concentrations for all other metals and they were between 679.85 and 830.83 mg.kg-1 for Pb, 265.38 and 354.51 mg.kg-1 for Cu, 48.24 and 19.10 mg.kg-1 for Cr and between 4.29 and 14.09 mg.kg-1 for the Cd (Table 2). Hg was the trace element with the lowest concentration at all sites.
| Parameters | Statistics | Sample sites | |||
|---|---|---|---|---|---|
| Control | Collector | Dismantling | Recycling | ||
| ph | Mean | 7.01 ±0.67 | 7.08 ±0.32 | 6.69 ±1.33 | 6.81 ±0.38 |
| Range | 6.77 – 7.61 | 6.54 – 7.01 | 6.21 ±7.25 | ||
| E.C. (mS.cm-1) | Mean | 1.82 | 20.31 ±2.61 | 20.20 ±1.33 | 20.71 ±1.50 |
| Range | 17.69 – 23.12 | 19.06 – 22.80 | 19.32 – 23.01 | ||
| Pb (mg/kg) | Mean | 4 | 237.00 ±101.12 | 782.50 ±36 | 476.27 ±136.22 |
| Range | 35.45 – 387.31 | 679.85 – 830.83 | 336.45 ±724.08 | ||
| % bioa | 44.98 | 61.17 | 47.85 | 49.76 | |
| Cd (mg/kg) | Mean | 1.82 | 3.94 ±1.06 | 7.39 ±3.57 | 6.18 ±1.34 |
| Range | 2.57 – 5.51 | 4.29 – 14.09 | 4.39 – 8.72 | ||
| % bioa | 15.34 | 58.47 | 77.82 | 49.76 | |
| Cu (mg/kg) | Mean | 27.97 | 217.22 ±94.75 | 337.92 ±32.18 | 324.66 ±14.59 |
| Range | 63.83 – 288.41 | 265.38 – 354.51 | 288.18 – 345.29 | ||
| % bioa | 58.54 | 54.64 | 84.61 | 71.9 | |
| Mn (mg/kg) | Mean | 28.97 | 418.81 ±183.39 | 731.70 ±310.15 | 802.15 ±275.60 |
| Range | 126.88 – 604.38 | 283.29 -1238.01 | 383.41–1371.70 | ||
| % bioa | 74.46 | 26.8 | 37.89 | 32.37 | |
| Fe (mg/kg) | Mean | 754.59 | 6800.85 ±1105.31 | 7475.77 ±294.88 | 7599.03 ±191.54 |
| Range | 4937.81 - 7753.45 | 6968.47-7957.13 | 7163.58-7966.62 | ||
| % bioa | 32.18 | 65.84 | 74.45 | 72.95 | |
| Cr (mg/kg) | Mean | 2.37 | 34.64 ±16.33 | 38.43 ±11.43 | 40.90 ±5.18 |
| Range | 13.44 – 57.98 | 48.24 – 19.10 | 31.64 – 51.35 | ||
| % bioa | 24.41 | 43.45 | 41.04 | 38.09 | |
| As (mg/kg) | Mean | 0,49 | 1.50 ±1.28 | 10.13 ±8.77 | 0.63 ±0.41 |
| Range | 0,25–3,49 | 0,12–22,42 | 0,11–1,25 | ||
| % bioa | 12.37 | 31.78 | 40.61 | 22.05 | |
| Hg (mg/kg) | Mean | 0,029 | 0.29 ±0.24 | 0.84 ±0.30 | 0.38 ±0.19 |
| Range | 0.16 – 0.73 | 0,45–1,31 | 0,18–0,65 | ||
| % bioa | 12.81 | 29.5 | 67.05 | 21.46 |
Table 4: Physicochemical properties and mean concentrations of trace elements in soil (mg/kg). % bioa: Percentage of bioavailable
Table 5: Physicochemical properties and mean concentrations of trace elements in soil (mg/kg). % bioa: Percentage of bioavailable fraction The concentrations of trace elements found at soil levels may be influenced both by the particle dispersion pattern and by soil heterogeneity. For our sites, the concentrations obtained are all higher than that of the control site. These results corroborate those obtained in Nigeria and China in the soils of e-waste handling sites, suggesting that the long-term handling of e-waste is one of the main causes of the increase in soil pollution by heavy metals such as cadmium, lead and copper [54, 55, 56]. In the Alaba e-waste landfill in Nigeria, the Pb value (1535 mg.kg-1) was 2 times higher than the average concentration of dismantling sites, 3 times higher than the average concentration of recycling sites and 6 times to those of Dakar collection sites [54]. The Cd at Alaba, on the other hand, had a value (7.69 mg/kg) which was closest to the average value of the dismantling sites (7.39 ± 3.57 mg/kg) and that of the recycling sites (6.18 mg/kg) in Dakar. These various observations highlight the influence of activities on the concentration of some trace elements such as Pb. In addition, these results are explained by the fact that some metals are widely used in the manufacture of electronic products and equipment that are handled at the site level. Pb and Cd, for example, are present in printed circuit boards, Cd in computer batteries, and Cu in electrical cables, and these are readily released into the environment during the handling of these devices [57, 58, 59]. For this reason, some authors consider that landfills and e-waste handling sites play a significant role in the anthropogenic input of traces metals elements into soil [14, 26, 60, 61, 62].
The percentages of bioavailable fractions are also shown in (Table 2). In the different sites, Cd, Cu, Pb, Mn, Cr and Fe have a bioavailability percentage between 26.80 and 84.61%, suggesting high mobility and bioavailability of these elements. Of the metals studied, Mn and Cr were the least bioavailable elements for each site category. With the exception of Pb, dismantling sites had the highest percentage of bioavailability for other elements. This can be explained by the pH and conductivity values of these sites. In addition, an increase in salinity is associated with an increase in concentrations of elements such as Na, K, Ca, Mg mostly competing with heavy metals, which may contribute to a greater release of exchangeable metals and an increase in the mobility and availability of trace metals [63].
In order to better assess the impact of these polluting activities on the soil and the resulting ecological risk, several parameters have been identified and evaluated.
Geoaccumulation Index (Igeo), Enrichment Factor (EF), Degree of Contamination (Cdeg) and Potential Ecological Risk Index (RI) of Heavy Metals in Site Soils
Geoaccumulation Index and Enrichment Factor: The geoaccumulation index (Igeo) and the enrichment factor (EF) made it possible to assess the degree of metal pollution of the soils of the study sites. Igeo is an effective indicator for understanding and assessing the level of trace metal pollution [64]. This is usually done by comparing the background value to determined metal concentrations, or from a reference soil [34, 65]. In this study, trace element concentrations for the control site were used to assess the impact that the handling of e-waste can have on soil and health. This choice makes it possible to compare the pollution on the exposed sites with that of a site that is not.
According to the classification of Torabi Kachoosangi F, et al. [35] the data presented in Table 3 allow to apprehend the overall contamination average by category of site. Of these, the dismantling sites were the most contaminated by the elements Pb, Cd, Mn, As and Hg. More specifically, these sites were « extremely polluted » by Pb, « severely to extremely polluted » by Hg, « moderately to severely polluted » by Cd and As, and the average values of Igeo were 7.03, 4.21, 2.25 and 2.57, respectively (Table 6). The average Mn pollution was classified as « severely polluted ». As for Cu, Fe and Cr, the highest average level of pollution by these elements was obtained in recycling sites and the Igeo values were 3.04 for Cu, 2.73 for Fe and 3.41 for Cr, which classified the average soil pollution by Cu and Cr as « severely polluted » and Cu to « moderately to severely polluted ». The lowest overall level of contamination was that of As and it was obtained in the collection and recycling sites and the average value of the Igeo of the As in these sites was less than 1.
| Samples | Igeo | EF | ||||||||||||||
|---|---|---|---|---|---|---|---|---|---|---|---|---|---|---|---|---|
| Pb | CD | Cu | Mn | Fe | Cr | As | Hg | Pb | CD | Cu | Mn | Cr | As | Hg | ||
| Collector | Mean | 4.94 ±1.39 | 1.43 ±0.40 | 2.19 ±0.92 | 3.09 ±0.90 | 2.57 ±0.026 | 3.13 ±0.78 | 0.49 ±1.45 | 2.50 ±0.90 | 7.11 ±4. 71 | 0.46 ±0.11 | 0.83 ±0.30 | 1.54 ±0.55 | 1.58 ±0.67 | 0.34 ±0.28 | 1.32 ±1.44 |
| Range | 2.56- 6.01 | 0.85- 1.95 | 0.61- 2.78 | 1.55- 3.80 | 2.12- 2.78 | 1.92- 4.03 | -1,58– 2,22 | 1,91– 4,08 | 0.86 - 12.60 | 0.38 - 0.65 | 0.35 – 1.08 | 0.67 – 2.03 | 0.87 – 2.61 | 0,05– 0,78 | 0,57– 3,89 | |
| Dismantling | Mean | 7.03 ±0.10 | 2.25 ±0.64 | 3.00 ±0.15 | 3.95 ±0.69 | 2.72 ±0.06 | 3.36 ±0.51 | 2.57 ±2.74 | 4.21 ±0.55 | 19.80 ±1.59 | 0.78 ±0.36 | 1.22 ±0.1 2 | 2.53 ±1.01 | 1.63 ±0.47 | 2.07 ±1.77 | 2.95 ±0.98 |
| Range | 2.56- 7,12 | 0.85- 3.31 | 0.61- 3,08 | 1.55- 4,83 | 2.13- 2,81 | 1.92- 3,76 | -2,58– 4,90 | 3,39– 4,94 | 17.03 - 21.34 | 0.45 – 1.48 | 0.97 – 1.36 | 0.98 -4.05 | 0.81 – 2.09 | 0,02– 4,51 | 1,71– 4,36 | |
| Recycling | Mean | 6.92 ±0.22 | 2.20 ±0.73 | 3.04 ±0.03 | 3.89 ±0.71 | 2.73 ±0.01 | 3.41 ±0.58 | -0.62 ± 1.26 | 2.99 ±0.78 | 11.77 ±3.76 | 0.65 ±0.17 | 1.15 ±0.04 | 2.72 ±1.17 | 1.72 ±0.33 | 0.12 ±0.07 | 1.32 ±0.66 |
| Range | 6.57- 7,09 | 1.59- 3,30 | 2.99- 3,08 | 2.70- 4,46 | 2.71- 2,74 | 2.42- 3,85 | -2,66– 0,73 | 2,03– 3,93 | 8.24 – 17.17 | 0.46 – 0.92 | 1.09 – 1.18 | 1.39 – 4.49 | 1.26 – 2.15 | 0,02– 0,24 | 0,65– 2,28 |
Table 5: Igeo and enrichment factor (EF) for the different site groups.
Table 6: Igeo and enrichment factor (EF) for the different site groups.
The Igeo values of these sites show soil contamination of anthropogenic origin. Informal recycling and horizontal spread of metal contaminants are factors that can contribute to the diffusion of metals in handling and dismantling areas [30, 34]. Soil pollution observed at dismantling sites can be promoted by the combustion of equipment wires and cables [11, 55, 56]. Our results also corroborate those of Ackap 2019, which located the arable land and subsoil of the Agbogblohie and Ashaiman e-waste dismantling sites as « highly contaminated» to « extremely contaminated » with Pb, Cu and Cd [66].
In addition to Igeo, the analysis of enrichment factor (EF) values shows an EF that ranges from deficiency to severe soil enrichment, with an average EF of lead that was in the category of « severe enrichment » for all sites (Table 3). This observation again indicates an influence of anthropogenic e-waste handling activities as a source of Pb compared to the control site. Similar soil enrichment by Pb has already been observed at Agbogbloshie in Ghana, where the level of Pb enrichment was classified as « severe » at the waste dismantling sites [67]. In addition, elements such as Pb and Cr may have been introduced into the soil via certain equipment such as batteries, fluorescent lamps, cable sheaths and plumbing materials [51]. In addition, at the dismantling sites, there is a significant « moderate enrichment » of the soil in As and Hg (Table 6). Since the determination was made using data from a site where no industrial activity is carried out, the different levels of enrichment that have been achieved appear to be due to the treatment of e-waste on these soils [34, 62, 68].
These results from Igeo and EF that have been obtained make it possible to understand the influence of anthropogenic activity of handling these wastes on the soil [2, 31].
Contamination Factor and Degree of Soil Contamination
Based on the results obtained from the contamination factor and degree presented in (Table 7), with the exception of Cd and As in collection sites and As in recycling sites which had a contamination factor below 6, all sites had “Very High Contamination” and therefore « Very High Degree » of average contamination at soil level with respect to other elements compared to the control soil. These results indicate a significant contribution of anthropogenic sources to soil pollution at our sites [51]. Among these pollutants, Pb is responsible for a high degree of soil contamination with an average input of 48.39% at collection sites, 61.82% for dismantling sites and 51.67% for those of recycling.
| Samples | Cf | Cdeg | Er | RI | |||||||||||||||
|---|---|---|---|---|---|---|---|---|---|---|---|---|---|---|---|---|---|---|---|
| Pb | Cd | Cu | Mn | Fe | Cr | As | Hg | Pb | CD | Cu | Mn | Fe | Cr | As | Hg | ||||
| collector | Average | 59.33 ±34.16 | 4.15 ±1.12 | 7.77 ±3.39 | 14.46 ±6.35 | 9.01 ±1.46 | 14.60 ±6.89 | 3.00 ±2.57 | 10.28 ±8.50 | 122.60 ±32.62 | 296.67 ±170.79 | 124.54 ±33.49 | 38.84 ±16.94 | 14.46 ±6.35 | 9.01 ±1.46 | 29.21 ±13.77 | 29.98 ±25.69 | 411.23 ±340.19 | 953.93 ±390.90 |
| Range | 8.87 – 96.94 | 2.71 – 5.80 | 2.28 – 10.31 | 4.38 – 20.87 | 6.54 – 10.27 | 5.66 - 24.44 | 0,50– 6,99 | 5,65– 25,46 | 76,54– 160,83 | 44.37 – 484.72 | 81.34 – 174.10 | 11.41 – 51.56 | 4.38 – 20.87 | 6.54 – 10.27 | 11.33 – 48.88 | 5,00– 69,85 | 225,96– 1018,25 | 557.21 – 1560.66 | |
| Dis mantling | Evil | 195.86 ±12.77 | 7.79 ±3.76 | 12.08 ±1.15 | 25.26 ±10.71 | 9.91 ±0.39 | 16.20 ±4.82 | 20.28 ±17.55 | 29.45 ±10.60 | 316.84 ±33.09 | 979.30 ±63.85 | 233.72 ±112.93 | 60.41 ±5.75 | 25.26 ±10.71 | 9.91 ±0.39 | 32.40 ±9.64 | 202.82 ±175.54 | 1178.20 ±423.94 | 2722.02 ±482.51 |
| Range | 170.17 – 207.96 | 4.52 – 14.85 | 9.49 – 12.68 | 9.78 – 4 2.74 | 9.23 – 10.54 | 8.05 – 20.34 | 0.25 – 44.90 | 15.75 – 45.98 | 264.75 – 360.47 | 850.83 – 1039.79 | 135.61 – 445.36 | 47.45 – 63.38 | 9.78 – 42.74 | 9.23 – 1 0.54 | 16.11 – 40.68 | 2.50 – 448.97 | 630.18 – 1839.30 | 2090.86 – 3288.50 | |
| Recycling | Evil | 119.21 ±41.55 | 6.51 ±1.79 | 11.61 ±0.77 | 27.69 ±12.81 | 10.07 ±0.39 | 17.24 ±3.09 | 1.25 ±0.83 | 13.35 ±6.80 | 206.93 ±57.22 | 596.06 ±207.74 | 195.39 ±53.68 | 58.04 ±3.85 | 27.69 ±12.81 | 10.07 ±0.39 | 34.49 ±6.18 | 12.47 ±8.31 | 533.89 ±272.19 | 1468.10 ±444.08 |
| Range | 84.21 – 181.24 | 4.63 – 9.19 | 10.30 – 12.35 | 13.24 – 47.36 | 9.49 – 10.56 | 13.34 – 21.65 | 0.24 – 2.49 | 6.12 – 22.91 | 153.05 – 291.35 | 421.06 – 906.19 | 138.93 – 275.76 | 51. 52– 61.73 | 13.24 – 47.36 | 9.49 – 10.56 | 26.68 – 43.30 | 2.38 – 24.94 | 244.91 – 916.49 | 980.43 – 1964.67 |
Table 6: Summary of contamination factors, contamination indicator, maximum ecological risk coefficient and ecological risk for d
Table 7: Summary of contamination factors, contamination indicator, maximum ecological risk coefficient and ecological risk for different site groups. FC: contamination factors; Cdeg: to the extent of contamination; Er: lateral ecological risk coefficient; PERI: potential ecological risk index.
Potential Ecological Risk Index
The potential ecological risk coefficient (Er) and the potential ecological risk index (RI) were determined to individually understand and aggregate the potential ecological risk of the metals Pb, Cd, Cu, Fe, Mn, Cr, As and Hg in soil relative to the control site, and the results are reported in the table 5. The average Er values for Fe, Mn and Cr were less than 40 for all sites, as well as As in collection and recycling sites and Cu in collection sites. These results therefore indicated a low potential ecological risk to aquatic organisms from these metals [28]. Pb, Cd and Hg were average level of « Very High Risk » ecologically for all sites. The As also had a « Very High Risk » for dismantling sites. Thus, from these results, the resulting ecological risk index places each of these sites at a « Very High Ecological Risk » (RI> 600) index. Therefore, the e-waste handling sites that have been assessed pose a threat to the surrounding ecosystem and a high ecological risk due to the activities carried out [25]. Similar results were obtained at the e-waste landfills in Qingyuan in China, Guwahati in India and the Kpone landfill in Ghana [25, 51, 69]. In these studies, and as in our study, Hg, Pb and Cd contribution to the level of ecological risk. This can be explained by the role played by leaching or by acid combustion at these sites, which play a substantial role in pollution, unlike abandoned sites and low-activity sites with much lower values [12]. Moreover, the isolated extraction of the metals of interest would not have provided a real insight into the RI. Indeed, the Pb represents respectively 31.09%, 35.98%, 40.60%, of the RI of the sites, collection, dismantling and recycling. While Hg represents 43.11%, 43.28% and 36.37%. With a contribution of more than 70% from these two elements, this makes it possible to classify them as elements that require special monitoring with regard to ecological and toxicological risks to the environment at these sites. Hence it would be wise to say that these two metals contribute significantly to the increase in ecological risk compared to other metals [49]. It should also be noted that ecological and health risk assessment is generally quite complex and can be influenced by many factors, such as topography, presence of organic matter, hydrological conditions and interactions between the different elements present at each site [70].
The results of Pearson’s correlation analysis Table 8 show a significant positive correlation of 0.05 levels between lead and cadmium, copper and arsenic, which assumes that these metals would come from the same source. However, iron showed a strong positive correlation at 0.01 with copper and manganese, which may indicate a different source than other heavy metals [27, 44]. In addition, the strong correlation between some metals indicates the presence of generally anthropogenic sources of contamination [44].
| Variable | Pb | Cd | Cu | Mn | Fe | Cr | As | Hg |
|---|---|---|---|---|---|---|---|---|
| Pb | 1 | |||||||
| Cd | 0.502* | 1 | ||||||
| Cu | 0.492* | 0.484* | 1 | |||||
| Mn | 0.477 | 0.459 | 0.572* | 1 | ||||
| Fe | 0.233 | 0.407 | 0.862** | 0.656** | 1 | |||
| Cr | 0.112 | 0.319 | 0.37 | 0.44 | 0.478 | 1 | ||
| As | 0.526* | 0.121 | 0.363 | -0.048 | 0.07 | -0.12 | 1 | |
| Hg | 0.372 | 0.389 | 0.274 | 0.500* | 0.204 | 0.13 | 0.276 | 1 |
Table 7: Pearson correlation between heavy metal concentrations and physicochemical properties. * The correlation is significant
Table 8: Pearson correlation between heavy metal concentrations and physicochemical properties. * The correlation is significant at the level of 0.05 (p <0.05); ** The correlation is significant at the 0.01 level (p <0.01).
| HI | HQ | Cr | Tcr | |||||
|---|---|---|---|---|---|---|---|---|
| Ingestion | Inhalation | Dermal | Ingestion | Inhalation | Dermal | |||
| Control | 4.70E-03 | 1.22E-05 | 3.83E-02 | 4.30E-02 | 1.21E-06 | 6.34E-08 | 1.30E-06 | 2.58E- 06 |
| Collector | 7.09E-02 | 1.63E-04 | 1.14E+00 | 1.21E+00 | 1.33E-05 | 9.13E-07 | 3.91E-06 | 1.81E- 05 |
| Dismantling | 2.05E-01 | 2.28E-04 | 3.16E+00 | 3.37E+00 | 2.52E-05 | 1.03E-06 | 2.64E-05 | 5.27E- 05 |
| Recycling | 1.21E-01 | 2.29E-04 | 2.06E+00 | 2.18E+00 | 1.56E-05 | 1.08E-06 | 1.63E-06 | 1.83E- 05 |
Table 8: Non-cancer and carcinogenic risk associated with occupational exposure of adults.
Table 9: Non-cancer and carcinogenic risk associated with occupational exposure of adults.
Non-cancer and Carcinogenic Health Risk Assessment
Many metals such as Mn, Cu and Fe are considered non-carcinogenic by the International Agency for Research on Cancer [71]. As exposure took place in an occupational environment, the assessment of the carcinogenic and non- carcinogenic risk was made taking into account only the adult population. With regard to carcinogenic risk, only As, Pb, Cd and Cr were assessed.
As shown in Table 9, mean dermal HI values were elevated compared to the digestive and respiratory tracts. With an average HQ greater than 1, dermal exposure to these soils presented relatively greater non-cancer risks, regardless of the type of activity related to the handling of e-waste. This mean dermal HI had a direct consequence of the total hazard quotient for each group. This represents respectively 94.13%, 93.91% and 94.43% of the total HQ value for collection, dismantling and recycling sites. With a total HI value greater than 1, individuals exposed during these activities have a chance of developing non-cancer effects, with the likelihood that they have increased with HI [42, 44]. Unlike our results and those of Wei J, et al. [72]
which show a non-carcinogenic risk in the order HIDer > HIIng> HIInh, some studies such as those of Mowla M, et al. [17] and Singh M, et al. [26] had found as the main route of exposure to non-cancer health risk from ingestion exposure, with a significant contribution of Pb [17, 26, 72]. According for some previous results, the mean values for inhalation exposure show that this route has a significantly higher risk of potential harm to human health [51, 26]. For our results, sites where dismantling takes place are at higher risk than others. On the other hand, according to our results, dermal exposure is likely to cause more damage than other exposure routes.
The carcinogenic risk in this study was assessed for Pb, Cd, Cr and As because of their toxicity levels. The mean values of Tcr that were obtained for these elements at the individual sites ranged from 1. 81x10−5 and 5.83x10⁻⁵. Although this carcinogenic risk did not exceed the acceptable level (<10- 4), this study did not take into account certain metals such as nickel and tin, which could increase the carcinogenic risk [72]. Moreover, from these results, it should be said that the populations living near waste treatment sites present a carcinogenic risk proportional to the environment to which they belong. In this context, children, who are much more sensitive, would be the most exposed, especially in the event of exposure to lead, which already poses a risk to adults [72, 73, 74, 75, 76].
Conclusion
Our study examined the content of metallic trace elements on the soils of e-waste treatment sites in Dakar, Senegal. For this, the study sites were classified into three groups according to the activity. The concentrations of the different elements were all higher at the different sites than at the control site, indicating an anthropogenic origin of the observed contamination. The study indicated that soils at e-waste treatment sites are heavily polluted by Pb and Hg and the accumulation of metals in the soil was found to be proportional to the nature of the activity carried out. In most cases, the dismantling of electronic waste contributes the most to soil accumulation and enrichment. In addition, one of the consequences associated with the dispersion of heavy metals in the soil is the ecological risk they represent. Among the elements that require strict monitoring, Pb and Hg stand out with an important contribution compared to the other elements. Although the carcinogenic risk values are within normal limits, the non-carcinogenic risk is always permanent. The synergistic action of heavy metals in the body can have an impact on the health of the population and especially on children. Thus, these results highlight the need to optimise technologies for recycling and dismantling electronic waste in order to remedy the pollution that would emanate from these activities.
Acknowledgements
This study was supported by the « Fonds d’Impulsion de la Recherche Scientifique et Technique du Sénégal » (FIRST) and « Ministère de l’Enseignement supérieur, de la Recherche et de l’Innovation du Sénégal ». We express our sincere gratitude to all organizations, local authorities, collectors, recyclers and dismantlers of e-waste in the informal sector who participated in this study.
References
-
Dias P, Palomero J, Cenci MP, Scarazzato T, Bernardes AM, et al. (2022) Electronic waste in Brazil: Generation, collection, recycling and the covid pandemic. Cleaner Waste Systems 3: 100022.
-
Singh A, Panchal R, Naik M (2020) Circular economy potential of e-waste collectors, dismantlers, and recyclers of Maharashtra: a case study. Environmental Science and Pollution Research 27(17): 22081-22099.
-
Cenci MP, Scarazzato T, Munchen DD, Dartora PC, Veit H, et al. (2022) Eco-Friendly Electronics-A Comprehensive Review. Advanced Materials Technologies 7(2): 2001263.
-
Kovacs WL, Klucsik JF (1977) The New Federal Role in Solid Waste Management: The Resource Conservation and Recovery Act of 1976. Columbia Journal of Environmental Law 3(2): 4063.
-
Produção G, Franz N, Silva C (2022) Waste Electrical and Electronic Equipment (WEEE): global and contemporary challenge to production chains and the urban environment. Gestão & Produção pp: 29.
-
Chi X, Wang MYL, Reuter MA (2014) E-waste collection channels and household recycling behaviors in Taizhou of China. Journal of Cleaner Production 80: 87-95.
-
Hameed HB, Ali Y, Petrillo A (2020) Environmental risk assessment of E-waste in developing countries by using the modified-SIRA method. Science of the Total Environment 733: 138525.
-
Kimbi Yaah VB (2018) Improvement of the Waste Management System in Senegal. Mediterranean Journal of Basic and Applied Sciences 2(3): 105-126.
-
Awasthi AK, Cucchiella F, D’Adamo I, Rosa P, Terzi S, et al. (2018) Modelling the correlations of e-waste quantity with economic increase. Sci Total Environ 613-614: 46- 53.
-
Ueberschaar M, Geiping J, Zamzow M, Flamme S, Rotter VS, et al. (2017) Assessment of element-specific recycling efficiency in WEEE pre-processing. Resources, Conservation and Recycling 124: 25-41.
-
Amphalop N, Suwantarat N, Prueksasit T, Yachusri C, Srithongouthai S, et al. (2020) Ecological risk assessment of arsenic, cadmium, copper, and lead contamination in soil in e-waste separating household area, Buriram province, Thailand. Environ Sci Pollut Res Int 27(35): 44396-44411.
-
Han Y, Tang Z, Sun J, Xing X, Zhang M, et al. (2019) Heavy metals in soil contaminated through e-waste processing activities in a recycling area: Implications for risk management. Process Safety and Environmental Protection 125: 189-196.
-
Faomowe Foko R, Mbodji M, Kêdote M, Diaw M, Touré M, et al. (2021) Risque chimique et santé respiratoire des manipulateurs des déchets d’équipements électriques et électroniques (DEEE) à Dakar (Sénégal). Archives des Maladies Professionnelles et de l’Environnement 82(4): 438-448.
-
Shashi A, Rautela R, Chavan D, Kumar S (2021) Evaluation of soil contamination due to crude E-waste recycling activities in the capital city of India. Process Safety and Environmental Protection 152: 641-653.
-
Adekunle AS, Oyekunle JAO, Baruwa SO, Ogunfowokan AO, Ebenso EE, et al. (2014) Speciation study of the heavy metals in commercially available recharge cards coatings in Nigeria and the health implication. Toxicology Reports 1: 243-251.
-
Egbueri JC, Ukah BU, Ubido OE, Unigwe CO (2020) A chemometric approach to source apportionment, ecological and health risk assessment of heavy metals in industrial soils from southwestern Nigeria. International Journal of Environmental Analytical Chemistry 14: 3399- 3417.
-
Mowla M, Rahman E, Islam N, Aich N (2021) Assessment of heavy metal contamination and health risk from indoor dust and air of informal E-waste recycling shops in Dhaka, Bangladesh. Journal of Hazardous Materials Advances 4: 100025.
-
Wcisło E, Bronder J, Bubak A, Rodríguez-Valdés E, Gallego JLR, et al. (2016) Human health risk assessment in restoring safe and productive use of abandoned contaminated sites. Environment International 94: 436- 448.
-
Lim S-R, Schoenung JM (2010) Human health and ecological toxicity potentials due to heavy metal content in waste electronic devices with flat panel displays. Journal of Hazardous Materials 177(1): 251-259.
-
Maragkos KG, Hahladakis JN, Gidarakos E (2013) Qualitative and quantitative determination of heavy metals in waste cellular phones. Waste Management 33(9): 1882-1889.
-
Oguchi M, Sakanakura H, Terazono A (2013) Toxic metals in WEEE: Characterization and substance flow analysis in waste treatment processes. Science of The Total Environment 463-464: 1124-1132.
-
Ellingsen DG, Møller LB, Aaseth J (2015) Copper. In: Nordberg GF, Fowler BA, Nordberg M (Eds.), Handbook on the Toxicology of Metals. In: 4th (Edn.), Academic Press, San Diego, USA, pp: 765-786.
-
Faomowe FR, Mor D, Mathilde C, Toure A, Mbengue B, et al. (2018) Évaluation des troubles ventilatoires des soudeurs métalliques de la région de Dakar, Sénégal. Environnement, Risques & Santé 17(3): 294-299.
-
Cabral M, Toure A, Garçon G, Diop C, Bouhsina S, et al. (2015) Effects of environmental cadmium and lead exposure on adults neighboring a discharge: Evidences of adverse health effects. Environmental Pollution 206: 247-255.
-
Mavakala BK, Sivalingam P, Laffite A, Mulaji CK, Giuliani G, et al. (2022) Evaluation of heavy metal content and potential ecological risks in soil samples from wild solid waste dumpsites in developing country under tropical conditions. Environmental Challenges 7: 100461.
-
Singh M, Thind PS, John S (2018) Health risk assessment of the workers exposed to the heavy metals in e-waste recycling sites of Chandigarh and Ludhiana, Punjab, India. Chemosphere 203: 426-433.
-
Zhao J, Wu E, Zhang B, Bai X, Qiao X, et al. (2021) Pollution characteristics and ecological risks associated with heavy metals in the Fuyang river system in North China. Environ Pollut 281: 116994.
-
Gujre N, Mitra S, Soni A, Agnihotri R, Rangan L, et al. (2021) Speciation, contamination, ecological and human health risks assessment of heavy metals in soils dumped with municipal solid wastes. Chemosphere 262: 128013.
-
Kim RY, Yoon JK, Kim TS, Yang JE, Owens G, et al. (2015) Bioavailability of heavy metals in soils: definitions and practical implementation—a critical review. Environmental Geochemistry and Health 37(6): 1041- 1061.
-
Song Q, Li J (2014) Environmental effects of heavy metals derived from the e-waste recycling activities in China: a systematic review. Waste Manag 34(12): 2587-2594.
-
Diop C, Dewaelé D, Cazier F, Diouf A, Ouddane B, et al. (2015) Assessment of trace metals contamination level, bioavailability and toxicity in sediments from Dakar coast and Saint Louis estuary in Senegal, West Africa. Chemosphere 138: 980-987.
-
Maiti SK (2013) Analysis of Chemical Parameters of Soil and Overburden. In: Maiti SK (Eds.), Ecorestoration of the coalmine degraded lands. Springer, India, pp: 281- 317.
-
Andrew DE, Eugene WR, Rodger BB (2017) Standard Methods for the Examination of Water and Wastewater. In: 23rd (Edn.), American Public Health Association, USA.
-
Pradhan JK, Kumar S (2014) Informal e-waste recycling: environmental risk assessment of heavy metal contamination in Mandoli industrial area, Delhi, India. Environ Sci Pollut Res Int 21(13): 7913-28.
-
Kachoosangi FT, Karbassi A, Sarang A, Noori R (2020) Sedimentation rate determination and heavy metal pollution assessment in Zariwar Lake, Iran. SN Applied Sciences 2(9): 1483.
-
Nazzal Y, Bărbulescu A, Howari F, Al-Taani AA, Iqbal J, et al. (2021) Assessment of Metals Concentrations in Soils of Abu Dhabi Emirate Using Pollution Indices and Multivariate Statistics. Toxics 9(5): 95.
-
Maignien R (1965) Notice explicative. Carte pédologie du Sénégal au 1/1000000 In: Audry MMP, Bonfils P, et al. (Eds.), Overseas Scientific and Technical Research Office, Dakar, Senegal, pp: 1-63.
-
Hasan AB, Kabir S, Selim Reza AHM, Nazim Zaman M, Ahsan A, et al. (2013) Enrichment factor and geo- accumulation index of trace metals in sediments of the ship breaking area of Sitakund Upazilla (Bhatiary– Kumira), Chittagong, Bangladesh. Journal of Geochemical Exploration 125: 130-137.
-
Ngai KW, Mak MW, Pun KL (2021) Assessment of the potential environmental and ecological risks associated with traffic induced heavy metal contamination in country parks of Hong Kong. IOP Conference Series: Earth and Environmental Science 858(1): 012002.
-
Shirani M, Afzali KN, Jahan S, Strezov V, Soleimani-Sardo M, et al. (2020) Pollution and contamination assessment of heavy metals in the sediments of Jazmurian playa in southeast Iran. Scientific Reports 10(1): 4775.
-
Tan J, Obbard JP (2011) Singapore: Exposure to Persistent Organic Pollutants and Human Health Risks. In: Nriagu JO (Ed.), Encyclopedia of Environmental Health. Elsevier, Burlington, pp: 74-82.
-
USEPA (2001) Supplemental Guidance for Developing Soil Screening Levels for Superfund Sites. OSWER 9355.4-24. Office of Soild Waste and Emergency Response, Washington DC, USA pp: 20460.
-
USEPA (1989) Risk Assessment Guidance for Superfund. Human Health Evaluation Manual (Part A). EPA/540/1- 89/002. Office of Emergency and Remedial Response, Washington DC, USA, 1: 20450.
-
Chabukdhara M, Nema AK (2013) Heavy metals assessment in urban soil around industrial clusters in Ghaziabad, India: probabilistic health risk approach. Ecotoxicology and Environmental Safety 87: 57-64.
-
Dehghani S, Moore F, Keshavarzi B, Hale BA (2017) Health risk implications of potentially toxic metals in street dust and surface soil of Tehran, Iran. Ecotoxicology and Environmental Safety 136: 92-103.
-
Johnbull O, Abbassi B, Zytner RG (2019) Risk assessment of heavy metals in soil based on the geographic information system-Kriging technique in Anka, Nigeria. Environmental Engineering Research 24(1): 150-158.
-
Zhang Y, Hu J, Bai J, Qin H, et al. (2019) Intercropping with sunflower and inoculation with arbuscular mycorrhizal fungi promotes growth of garlic chive in metal-contaminated soil at a WEEE-recycling site. Ecotoxicology and Environmental Safety 167: 376-384.
-
Isimekhai KA, Garelick H, Watt J, Purchase D (2017) Heavy metals distribution and risk assessment in soil from an informal E-waste recycling site in Lagos State, Nigeria. Environmental Science and Pollution Research 24(20): 17206-17219.
-
Wu Q, Hu W, Wang H, Liu P, Wang X, et al. (2021) Spatial distribution, ecological risk and sources of heavy metals in soils from a typical economic development area, Southeastern China. Science of The Total Environment 780: 146557.
-
Obasi NA, Akubugwo EI, Ugbogu OC, Otuchristian G (2012) Assessment of physico-chemical properties and heavy metals bioavailability in dumpsites along Enugu- port Harcourt Expressways, South-east, Nigeria. Asian Journal of Applied Sciences 5(6): 342-356.
-
Obiri-Nyarko F, Duah AA, Karikari AY, Agyekum WA, Manu E, et al. (2021) Assessment of heavy metal contamination in soils at the Kpone landfill site, Ghana: Implication for ecological and health risk assessment. Chemosphere 282: 131007.
-
Ayub S, Siddiqui YS (2015) Municipal solid waste dumping practice and its impact. European International Journal of Science and Technology 4(3): 33-53.
-
Mekonnen B, Haddis A, Zeine W (2020) Assessment of the Effect of Solid Waste Dump Site on Surrounding Soil and River Water Quality in Tepi Town, Southwest Ethiopia. Journal of Environmental and Public Health 2020: 5157046.
-
Alabi OA, Bakare AA, Xu X, Li B, Zhang Y, et al. (2012) Comparative evaluation of environmental contamination and DNA damage induced by electronic-waste in Nigeria and China. Science of The Total Environment 423: 62-72.
-
Liu X, Gu S, Yang S, Deng J, Xu J, et al. (2021) Heavy metals in soil-vegetable system around E-waste site and the health risk assessment. Science of the Total Environment 779: 146438.
-
Shi A, Shao Y, Zhao K, Fu W (2020) Long-term effect of E-waste dismantling activities on the heavy metals pollution in paddy soils of southeastern China. Science of The Total Environment 705: 135971.
-
Jiang B, Adebayo A, Jia J, Xing Y, Deng S, et al. (2019) Impacts of heavy metals and soil properties at a Nigerian e-waste site on soil microbial community. Journal of Hazardous Materials 362: 187-195.
-
Luo C, Liu C, Wang Y, Zhang G, Liu X, et al. (2011) Heavy metal contamination in soils and vegetables near an e-waste processing site, south China. Journal of Hazardous Materials 186(1): 481-490.
-
Song Q, Li J (2015) A review on human health consequences of metals exposure to e-waste in China. Environmental Pollution 196: 450-461.
-
Adaramodu AA, Osuntogun AO, Ehi-Eromosele CO (2012) Heavy Metal Concentration of Surface Dust Present in E-Waste Components: The Westminister Electronic Market, Lagos Case Study. Resources and Environment 2(2): 9-13.
-
El Azhari A, Rhoujjati A, El Hachimi ML, Ambrosi JP (2017) Pollution and ecological risk assessment of heavy metals in the soil-plant system and the sediment- water column around a former Pb/Zn-mining area in NE Morocco. Ecotoxicology and Environmental Safety 144: 464-474.
-
Gujre N, Rangan L, Mitra S (2021) Occurrence, geochemical fraction, ecological and health risk assessment of cadmium, copper and nickel in soils contaminated with municipal solid wastes. Chemosphere 271: 129573.
-
Du Laing G, De Vos R, Vandecasteele B, Lesage E, Tack FMG, et al. (2008) Effect of salinity on heavy metal mobility and availability in intertidal sediments of the Scheldt estuary. Estuarine, Coastal and Shelf Science 77(4): 589-602.
-
Jafarabadi RA, Bakhtiyari RA, Shadmehri TA, Jadot C (2017) Spatial distribution, ecological and health risk assessment of heavy metals in marine surface sediments and coastal seawaters of fringing coral reefs of the Persian Gulf, Iran. Chemosphere 185: 1090-1111.
-
Tshibanda JB, Malumba AM, Mpiana PT, Mulaji CK, Otamonga JP, et al. (2021) Influence of watershed on the accumulation of heavy metals in sediments of urban rivers under tropical conditions: Case of N’djili and Lukaya rivers in Kinshasa Democratic Republic of the Congo. Watershed Ecology and the Environment 3: 30- 37.
-
Ackah M (2019) Soil elemental concentrations, geoaccumulation index, non-carcinogenic and carcinogenic risks in functional areas of an informal e-waste recycling area in Accra, Ghana. Chemosphere 235: 908-917.
-
Kyere VN, Greve K, Atiemo SM, Ephraim J (2017) Spatial assessment of potential ecological risk of heavy metals in soils from informal e-waste recycling in Ghana. Environ Anal Health Toxicol 32(4): e2017018.
-
Halwani DA, Jurdi M, Abu Salem FK, Miran AJ, Amacha N, et al. (2020) Cadmium Health Risk Assessment and Anthropogenic Sources of Pollution in Mount-Lebanon Springs. Exposure and Health 12(2): 163-178.
-
Morales-García SS, Meza-Olvera E, Shruti VC, Sedeño- Díaz JE (2020) Assessment of metal contamination and their ecological risks in wetland sediments of the former Texcoco saline lake, Mexico. Journal of Soils and Sediments 20: 2912-2930.
-
Rinklebe J, Antoniadis V, Shaheen SM, Rosche O, Altermann M, et al. (2019) Health risk assessment of potentially toxic elements in soils along the Central Elbe River, Germany. Environment International 126: 76-88.
-
IARC (2012) Radiation. IARC Monogr Eval Carcinog Risks Hum 100(PtD): 7-303.
-
Wei J, Li H, Liu J (2022) Heavy metal pollution in the soil around municipal solid waste incinerators and its health risks in China. Environmental Research 203: 111871.
-
Xu L, Dai H, Skuza L, Wang Y, Shentu J, et al. (2022) Integrated survey on the heavy metal distribution, sources and risk assessment of soil in a commonly developed industrial area. Ecotoxicology and Environmental Safety 236: 113462.
-
Affairs DoE (2010) The Framework for the Management of Contaminated Land, South Africa. In: Affairs E (Eds.), Republic of South Africa, 562.
-
Kamunda C, Mathuthu M, Madhuku M (2016) Health Risk Assessment of Heavy Metals in Soils from Witwatersrand Gold Mining Basin, South Africa. International Journal of Environmental Research and Public Health 13(7): 663.
-
Liang Y, Yi X, Dang Z, Wang Q, Luo H, et al. (2017) Heavy Metal Contamination and Health Risk Assessment in the Vicinity of a Tailing Pond in Guangdong, China. International Journal of Environmental Research and Public Health 14(12): 1557.
- Pattern of Gonadal Hormones in Oral Testosterone-Supplimented Male Wistar Rats with Diabetes-Induced Hypogonadism
- Re-Evaluation of the Genotoxicity of Currently Used Food Dyes in Mouse Multiple Organs Via Continuous Administration by Drinking Using the Comet Assay
- Pharmacogenetics of Type 2 Diabetes Mellitus: Linking Genetic Variability to Drug Efficacy and its Cardiovascular Outcomes
- Exploratory Proteomic Profiling of SARS-CoV-2 Infected THP-1 Macrophages Reveals Alterations in Inflammatory Response and Cellular Metabolism
- Study of Genotoxicity of Hepatocarcinogens in Multiple Organs in Mice by Feeding and Drinking Using the Comet Assay
- Spirulina Polypeptides Inhibit the Growth of Human Lung Tumor (H460) Cells