Ultrafine Particles in Viennese Gastronomy after Introduction of a National Smoking Ban
Background: Ultrafine particles have a substantial influence on the pathogenesis of diseases from ambient air pollution including personal and indoor tobacco smoke. In public rooms such as gastronomy venues without complete smoking ban, the main source of ultrafine particles is cigarette smoke. Objectives: In accordance with the research question if the legislative smoking ban reduced ultrafine particle pollution in Viennese bars, cafés and pubs, the effectiveness of this ban for the protection of nonsmokers was evaluated. As a further objective, the comparison with the ultrafine particle concentrations in smoking and non-smoking areas before and after the general smoking ban was relevant, whereby the data from the survey period April to October 2019 were used. Hereby, the effectiveness of the measure could be derived from the direct comparison of the earlier and the current recordings. Methods: 2 years after the national Non-Smoking Protection Law in November 2019 had gone into force, the indoor exposures with ultrafine particles were surveyed in 22 Viennese bars/discotheques, 5 cafés and 12 pubs/restaurants and bars. By unannounced and undercover measurements over 20 minutes each, these well frequented gastronomy locations were investigated between October 2021 and February 2022. The concentration of ultrafine particles (PNC, pt/cm³), the corresponding diameter (10 - 300 nm) and lung deposited surface area (LDSA) were recorded via Miniature Diffusion Size Classifier (miniDiSC®) in all three types of locations. Results: The ultrafine particle loadings in 2021/22 in the three location types were not significantly different any more. Two years after the ban the median PNC (pt/cm³) was 19,751 in bars, 18,854 in cafés and 19,357 in pubs. The average diameter (AD, nm) was 54.17 in bars, 44.27 in cafés and 52.08 in pubs. For average LDSA (μm²/cm³), the values were 51.65 in bars, 35.76 in cafés, and 60.71 in pubs. 2019 data had shown significantly higher median values for PNC (pt/cm³) for smoking locations at 72,802 versus non-smoking areas at 27,776 and non-smoking locations at 18,854. Similarly, smoking locations showed significantly higher values for AD (nm) at 78 versus non-smoking areas at 62 and non-smoking locations at 52. For average LDSA (μm²/cm³), smoking locations also had the highest values at 402.0 versus non-smoking areas at 108.0 and non-smoking locations at 51.9. From comparison of data, it was possible to derive the UFP concentrations above which a hospitality indoor area - regardless of its declared status - may be classified as polluted by nanoparticles (tobacco smoke): For PNC, 34,435 pt/ cm³, for average diameter 67.45 nm and for LDSA 163.68 μm²/cm³ are proposed as cut-off values. Conclusion: The national smoking ban significantly improved air quality in Viennese hospitality venues. Two years after the ban ultrafines were comparably low and not significantly different between bars, cafés and pubs, whether they were used before for smoking or not. The decrease of ultrafine particle pollution was attributed to regular non-smoking in localities. Some outliers of the present investigation after the smoking ban indicated, that control of compliance with the law has to be continued.
Introduction
Since November 2019, the Austrian gastronomy has been smoke-free mainly due to the indoor smoking ban that became effective. Measurements of particle number count (PNC) and lung-deposited surface area (LDSA) can be used to demonstrate compliance with the measures provided by the law, as there is a high correlation between ultrafine particles (UFP) and air nicotine, the latter specifically indicating tobacco smoke [1, 2, 3, 4, 5]. To our knowledge LDSA has not been used before to evaluate air quality after a complete smoking ban in the hospitality industry of other cities.
UFP can be generated from traffic exhaust gases as well as from various smoking and vaporizing sources, such as heating, cooking, cigarette smoke, electronic cigarettes (exhaled nicotine-containing aerosols), candles or the use of deep fryers. In everyday life, fine or ultrafine dust, which is harmful to us, can thus be generated very quickly, e.g. through ordinary activities such as cooking. It has been shown that ultrafine dust has an impact on health and has an increased effect on the well-being of people who already suffer from respiratory tract diseases, since ultrafine dust can reach the depths of the lungs due to its small particle size [1, 6]. Equally at risk are patients with cardiovascular diseases (endothelial dysfunction, vascular stiffness, coagulation promotion) [7, 8, 9].
Larger particles dominate the mass concentrations (PM) and smaller particles dominate the number and surface concentrations. UFP have sizes up to 0.1 µm and dominate PNC [10].
Passive smokers are those persons who not actively smoke cigarettes themselves, but inhale tobacco smoke because they are usually unintentionally surrounded by it. According to a survey by Statistics Austria, more than 25% of non-smokers were occasionally exposed to this passive or second-hand smoke (SHS), with younger age groups being more frequently affected [11]. The 2019 survey found that women and men aged 15 to 29 years were the most likely to be exposed to secondhand smoke, with at least 10% of both genders exposed daily and just over 30% of men and one-fifth of women in this age group exposed at least once a week. In the age group 60-74 years, reported exposure to secondhand smoke decreased, with daily exposure to secondhand smoke occurring in about 5% of respondents [11].
Residues that remain after smoking, e.g. on wallpaper, carpets, upholstered furniture, children’s toys or other surfaces, indoor in private as well as in public locations, are referred to as “cold smoke” or third-hand smoke (THS). This is characterized by long-lasting deposits of up to several months after the last cigarette smoked in the affected rooms. Even by ventilating the room, the cold smoke cannot be completely removed from furniture, carpets and wall paper, is partly changed and released into room air. After a person enters a room after consuming a cigarette in an outdoor area, smoke particles continue to be exhaled for one to two minutes afterwards, and even a few minutes after that, carcinogenic substances continue to be exhaled. Smoking in the presence of or immediately before contact with children as well as infants should be refrained from, as the smoke particles can also settle in their hair and clothing and in house dust. The particles that enter the interior and their compounds are subsequently absorbed through the skin or by inhalation, as well as through the oral mucosa, and can contribute to illness. It is even recommended that all furnishings be replaced when moving into an apartment to reduce exposure to cold smoke as much as possible [12].
For indoor gastronomy environments, it can be assumed that smoking causes an increased concentration of ultrafine dusts both from SHS and THS after recent smoking. This aspect, which is hazardous to health, is to be analyzed in comparison with non-smoking establishments and smoke- free areas.
Objectives
Following the research question of ultrafine particulate matter in the Viennese gastronomy after the legal smoking ban, the focus was on whether and to what extent different UFP parameters can distinguish between different types of venues (with and without smoking before the ban).
Material and Methods
In the first part of the present study, in the course of the data collection, 40 different localities, cafés, discotheques, bars, etc., mainly frequented by younger people, were investigated undercover. For the detection of ultrafine dust, the Miniature Diffusion Size Classifier (MiniDiSC®) was used to measure PNC and LDSA. PNC is dominated by ultrafine particles and indoors by combustion aerosols such as tobacco smoke, suspended for a long time in room air, inhaled deeply into the airways and partially penetrating into the blood via the lungs. LDSA measures the surface area of this ultrafine dust, which can come into contact with body cells and therefore has particular toxicological significance.
Recording of the exposure to ultrafine dust, the surveys were each carried out for a minimum of 20 minutes in order to obtain meaningful and reliable results. As far as possible, the measurements took place to avoid certain interfering factors, such as candles, steam from open kitchens or fog machines. If this was not possible for certain reasons, such as lack of space, or if there was no opportunity for an inconspicuous measurement, this circumstance was recorded. Another condition was that the gastronomic locations were well frequented. The hidden measurement was carried out with the MiniDiSC at about chest height.
Ultrafine particles collected in the localities were transformed into corresponding averaged values using the MiniDiSC data conversion tool© program software. The values for PNC, particle diameter and LDSA collected in this way were collected in an Excel© database and finally converted into a corresponding SPSS© matrix.
Due to a technical problem, measurements in one pub could not be carried out completely. Analyses are based on 39 visited localities between October 2021 and February 2022. The data collection processes were documented pseudonymously, which means that no conclusions can be drawn about individual locations. Only authorized persons can access the sensitive data.
In the second part of the study, these UFP data from nonsmoking sites were compared with corresponding measurements also from 39 locations from smoking sites and nonsmoking areas prior to the ban of November 1st, 2019.
Statistical Analysis
The descriptive and inferential statistical analyses were performed using IBM SPSS® 20.0 statistical software package Parameter and location type n M ± SD min - max Md IQR mean rank PNC pt/cm³ $$ \text{Bar (Disco)} \quad 22 \quad 7 3 7 4 2 \pm 1 3 4 3 5 2 \quad 5 5 8 1 - 5 5 5 0 1 4 \quad 1 9 7 5 1 \quad 1 1 2 6 3; 4 5 6 0 8 \quad 2 0. 1 4 $$ $$ \text{Pub (Restaurant)} \quad 12 \quad 3 1 5 0 8 \pm 1 1 7 4 0 5 \quad 6 1 0 7 - 9 9 7 6 4 \quad 1 9 3 5 7 \quad 1 2 8 8 0; 3 8 7 3 2 \quad 1 9. 8 3 $$ Average diameter (nm) Bar (Disco) 22 47.72±16.51 13.95-77.11 54.17 39.37; 57.91 20.82 (IBM, Armonk, NY). In the context of inferential statistics, the significance level was set at p ≤ .05. Furthermore, to interpret the practical significance of results, the standardized effect size η2 was used according to Cohen’s classification. Considering this, effect size ranges ≥ .01 are considered small, ≥ .06 moderate, and ≥ .14 significant [13].
In accordance with the study design, the differences in ultrafine particle parameters were assessed by means of single-factor, non-parametric methods such as Kruskal- Wallis-testing and, after logarithmization of skewed data, also by means of two-factor parametric methods with respect to the factors type of locality and location status (year of study and smoker/non-smoker location). In addition, a model test was performed to examine the explanatory value of ultrafine dust parameters with respect to the discriminability of non- smoking localities (2021), non-smoking areas (2019) and smoking gastronomies (2019). Finally, ROC functions were used to determine meaningful cut-off values of three ultrafine particle indicators to distinguish smoking and non-smoking localities. UFP parameters as study relevant variables in the measurement sequences, taking into account unit and metric, as well as scale level, are summarized in Table 1.
| Parameter | Unit | Scaling level |
|---|---|---|
| PNC | pt/cm³ | metric |
| Particle diameter | nm | metric |
| LDSA | µm²/cm³ | metric |
Table 1: UFP parameters.
Results
• Surveys in non-smoking locations in 2021/22, comparing three different types of premises. The assessment of the difference in the extent of the three ultrafine dust parameters in the comparison of the local types showed non-significant results in each case using the corresponding Kruskal-Wallis testing as shown in Table 2.
p-value $$ \text{Café} \quad 5 \quad 9 2 7 6 9 \pm 1 7 0 9 7 0 \quad 8 3 2 5 - 3 9 8 3 7 6 \quad 1 8 8 5 4 \quad 1 2 3 5 0; 2 5 9 3 9 \quad 1 9. 8 $$ $$ \text{total} \quad 39 \quad 6 3 1 8 6. 4 \pm 1 1 7 4 0 5 \quad 5 5 8 1 - 5 5 5 0 1 4 \quad 1 8 8 5 4 \quad 1 2 0 8 1; 4 1 0 8 5 \quad 0. 9 9 6 $$ Café 5 42.61±13.40 19.30-65.22 44.27 39.16; 45.09 15.4
| Pub (Restaurant) | 12 | 49.47±8.94 | 29.30-58.07 | 52.08 | 43.88; 56.61 | 20.42 |
|---|---|---|---|---|---|---|
| total | 39 | 47.60±14.37 | 13.95-77.11 | 52.01 | 40.71; 57.29 | 0.624 |
| Av. LDSA µm²/cm³ | ||||||
| Bar (Disco) | 22 | 112.88±142.05 | 11.86-497.01 | 51.65 | 33.82; 120.86 | 20.14 |
| Café | 5 | 111.33±148.84 | 20.18-371.91 | 35.76 | 30.57; 98.22 | 18.2 |
| Pub (Restaurant) | 12 | 75.82±49.97 | 19.15-152.66 | 60.71 | 33.93; 119.72 | 20.5 |
| total | 39 | 101.28±120.42 | 11.86-497.01 | 51.87 | 33.36; 112.09 | 0.927 |
Table 2: Key values of UFPs with respect to the three status surveys in 2019 [15] and 2021/22.
- In summary, it can be stated that the three UFP, taking into account three different location types, did not show any significant level differences and therefore a comparability of the survey results of the year 2021/22 in non-smoking locations can be assumed.
- Comparison of the 2021/22 surveys with those from
- 2019
- Locality status
- PNC pt/cm³ average diameter nm average LDSA µm²/cm³
- M ± SD
- 63186.4±117405
- 47.60±14.37
- 101.28±120.42 min-max
- 5580.9-555013.5
- 13.95-77.11
- 11.86-497.01
- Non-S 2021/22 (n=39)
- Md
- 18854.1
- 52.01
- 51.87
- IQR
- 12080.7; 41085.0
- 40.71; 57.29
- 33.36; 112.09
- M ± SD
- 40895.8±38049.4
- 61.36±19.35
- 148.44±151.59 min-max
- 5482-192157
- 27-116
- 16-821
- Non-S 2019 (n=39)
- Md
- 27776
- 62
- 108
- IQR
- 16231.5; 51573.0
- 46.5; 70.5
- 53.5; 179.5
- M ± SD
- 105679.2±85805.2
- 74.67±17.05
- 442.9±311.1 min-max
- 17100-337143
- 36-104
- 75-1411
- S 2019 (n=39)
- Md
- 72802
- 78
- 402
- IQR
- 44288.5; 126305.0
- 62.0; 88.5
- 228.0; 557.5
Table 3: Key values of UFPs with respect to the three status surveys in 2019 [15] and 2021/22.
The transformation of the skewed original data into logarithmized (lg10), normally distributed measurement data series was essential in order to be able to perform a multi-factorial comparison. In the figures below, the UFP mean values have been also logarithmized.
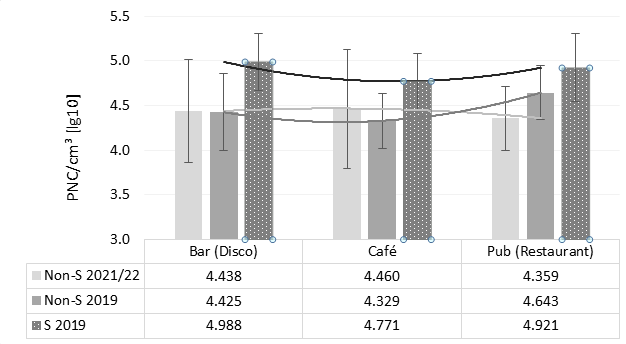
Average PNC
For the UFP lgPNC pt/cm³, the interaction of local type x local status with F(4, 108) = 0.838, p = 0.504 showed no significant result, so that the two main effects could be interpreted without restriction. Local type itself showed no significant difference with F(2, 108) = 0.682, p = 0.508, while local status showed a significant difference with F(2,
108) = 14.243, p < 0.001 with an already significant effect η2 = 0.21 indicated. Using pairwise comparisons post hoc and for differential presentation, t-tests accounting for the Bonferroni correction were used. For smoking status of the establishment, each showed significantly higher values for smoking establishments in the 2019 survey vs. non-smoking establishments in the 2021/22 survey and non-smoking establishments in the 2019 survey (Non-S 2019), p’s < 0.001, while there was no significant difference between Non-S 2021/22 and Non-S 2019, p = 0.670. Figure 1 illustrates the exposure to the ultrafine particulate matter parameter lgPNC pt/cm³ taking into account the location type bar (discotheque), café, pub (restaurant) and the location status (Non-S 2021/22, Non-S 2019, S 2019).
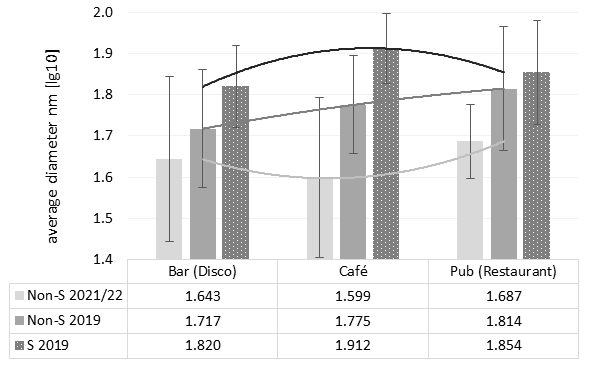
Average Diameter
For the UFP lg average diameter nm, the interaction of local type x local status showed no significant result with F(4, 108) = 0.941, p = 0.443, so the two main effects were interpretable without restriction. Local type itself showed no significant difference with F(2, 108) = 1.801, p = 0.170, while local status indicated a significant difference with a significant effect of η2 = 0.26 with F(2, 108) = 19.278, p < 0.001. Using pairwise comparisons post hoc according to Bonferroni for the smoking status of the establishment, each showed significantly different values, so that a hierarchy can be assumed with the highest values for S of the 2019 survey, followed by Non-S of the 2019 survey and finally Non-S of the 2021/22 survey, p’s ≤ 0.014. Figure 2 illustrates the exposure to the ultrafine particulate matter parameter lg average diameter taking into account the locality type bar (discotheque), café, pub (restaurant) and the locality status (Non-S 2021/22, Non-S 2019, S 2019).
Average LDSA
For the UFP lg average LDSA µm²/cm³, the interaction of locality type x local status showed no significant result with F(4, 108) = 1.209, p = 0.311, so that the two main effects were again interpretable without restriction. Local type itself indicated no significant difference with F(2, 108) = 1.298, p = 0.277, while local status indicated a significant difference with F(2, 108) = 37.320, p < 0.001, with a large effect of η2 = 0.41. Using pairwise comparisons post hoc according to Bonferroni for smoking status of the establishment, each showed significantly higher values for smoking establishments in the 2019 survey versus non- smoking establishments in the Non-S 2021/22 survey and non-smoking areas in the 2019 survey, p’s < 0.001, while the difference in the Non-S 2019 survey versus Non-S 2021/22 survey showed a trend toward higher exposure to lg average LDSA µm²/cm³ for Non-S 2019, p = 0.070. Figure 3 illustrates the exposure to the ultrafine dust parameter lg average LDSA µm²/cm³ taking into account the location type bar (discotheque), café, pub (restaurant) and the location status (Non-S 2021/22, Non-S 2019, S 2019).
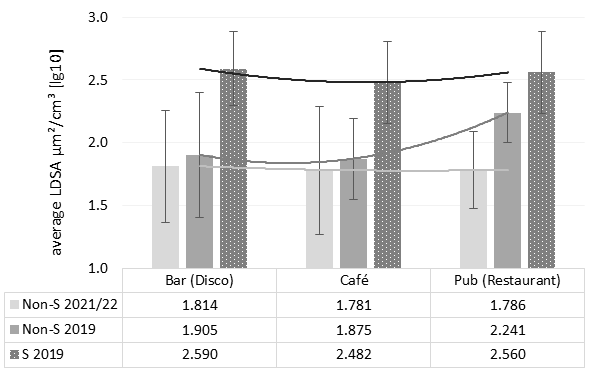
In summary results show, that UFP number and surface concentrations and particle diameter were higher before the smoking ban, but not significantly different between bars, cafés and pubs.
Multivariate model testing using binary logistic regression was used to examine the explanatory value of the three UFP parameters together to predict the criterion smoking status; (0) no; (1) yes. For this purpose, the 39 smoking localities in the 2019 survey were coded as 1, while the 39 non-smoking localities in 2019 were coded as 0 along with the 39 non-smoking localities in 2021/22, respectively. The UFP covariates were to be included in the analysis logarithmized as predictors, and stepwise backward selection was chosen as the approach to match the exploratory nature of the analysis. Adequate model fit could be assumed based on the non-significant result of the Hosmer-Lemeshow test at p = 0.112. Starting with the baseline model, which still contains all three UFP covariates, the second model step showed that PNC (p = .003) and LDSA (p < .001) reached a significant explanatory value for the criterion smoking status of a pub.
Growing diameter indicates longer time for particle coagulation and less evaporation of the aerosol, but the value of average diameter for the prediction of the UFP load can be assumed to be lower compared to the other two predictors and that a prediction from PNC and LDSA alone is possible. Overall, the explained proportion of variance using Nagelkerke’s coefficient of determination R2 was 62.6%. Table 4 depicts for non-smoking areas in smoking establishments in the 2019 survey, the likelihood of non- smoking classification reached only 76.9%, but this may be attributable to the fact that sampling in non-smoking rooms before the ban was done in areas adjacent to smoking rooms, so some tobacco smoke could have entered from there, while in 2021/22 no smoking rooms were allowed any more.
- Local status
- Predicted total
- Non-S
- S
- Non-S 2021/22
- 38 (97,4%)
- 1 (2,6%)
- 39
- Non-S 2019
- 30 (76,9%)
- 9 (23,1%)
- 39
- S 2019
- 10 (25,6%)
- 29 (74,4%)
- 39
- Gesamt
- 78 (66,7%)
- 39 (33,3%)
- 117
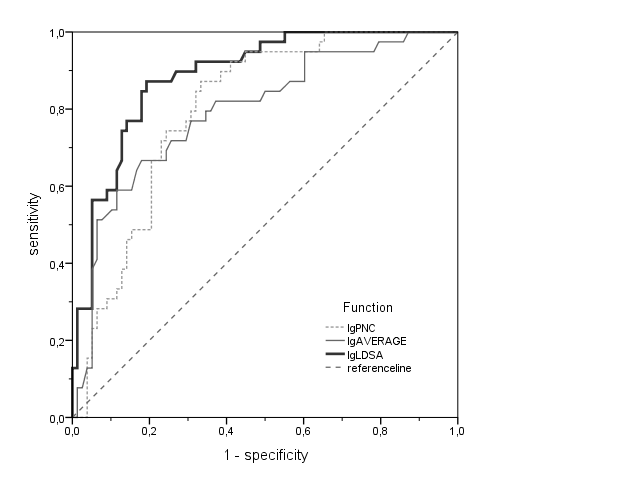
- In addition, ROC-analyses were used to test the univariate sensitivity and 1-specificity of the three UFP parameters with respect to the criterion of smoking status of an establishment.
- Figure 4 illustrates on the one hand the AUC for the three
- UFP parameters; on the other hand, the cut-offs determined based on the YI, plotted as points on the ROC curve.
- The results for univariate assessment of the validity of the three UFP parameters are summarized in Table 5, with the comparatively highest AUC for LDSA at 88.7% (Table 5).
- UFP-Parameter
- AUC
- SE p-Wert
- 95%-CI AUC
- Sens. specificity
- YI
- Cut-off C*
- LB
- UB log original
- PNC
- 0.8
- 0.04
- <.001**
- 0.721
- 0.879
- 0.872
- 0.667
- 0.54
- 4.537
- 34435
- Average diam.
- 0.793
- 0.045
- <.001**
- 0.706
- 0.881
- 0.667
- 0.821
- 0.49
- 1.829
- 67.45
- LDSA
- 0.887
- 0.031
- <.001**
- 0.827
- 0.947
- 0.872
- 0.808
- 0.68
- 2.214
- 163.68
Table 4: Classification matrix based on the model test for the
Classification matrix based on the model test for the criterion smoking status of an establishment with the UFP parameters PNC and LDSA.
Based on the cut-off values, it is thus possible to indicate the UFP concentration above which a restaurant could be designated as a smoking establishment by a measurement - irrespective of its actual status. Accordingly, for PNC lg10 4.537 = 34435 pt/cm³, for average diameter lg10 1.829 = 67.45 nm, and for LDSA lg10 2.214 = 163.68 µm²/cm³ were derived by the corresponding calculation out of the logarithmized values. These univariate thresholds can be considered as critical limits above which an indoor space can be considered likely to be exposed to tobacco smoke (when other UFP sources are negligible).
Discussion
The sampling and evaluation of the concentrations of UFPs in the present study was carried out in the most frequent Viennese establishments for hospitality, grouped into three types of premises. The data for the present survey was collected in non-smoking establishments, from 09/2021 to 02/2022. At that time, the law on the protection of non-smokers with a smoking ban in all pubs in Austria on 01.11.2019 was already established. For comparison the same type of venues was used which had been sampled by the same methods from April to October 2019, when only partial smoking bans had been in force [3]. The results showed for UFP similar reductions of particle exposure in number and surface after complete smoking bans as had been found before for fine particle mass in Vienna [14, 15], Dublin [16], Aberdeen, Edinburgh [17] and other European cities. Less surveys measured also PNC of ultrafines before and after a ban. PNC is more variable in time and space. In Rome mean PNC decreased in bars from 60,998 to 28,737
three months after the ban, but increased again to 51,069 after one year [18]. In Vienna 3 years after the ban mean PNC significantly dropped in all venues from 105,679 to 63,186 and the median PNC of 18,854 was even lower than the median PNC before the ban in non-smoking rooms, which was 27,776. This indicates that before the ban tobacco smoke from neighbouring smoking rooms was not completely prevented to enter non-smoking rooms and that the legally required separation failed [19]. It could also indicate that particle release from THS in the 2021/22 survey did not play an important role anymore, because of renovation, cleaning and ventilation during the past three years. Some outliers found in certain venues 3 years after the ban could rather be attributable to recent SHS by single smokers still violating the law at times, which makes a continuation of controls necessary in these premises. This conclusion is supported by the study results on mean LDSA, which decreased significantly from 443 to 101 µm²/cm³, but is still higher than reported from other non-occupational environments without smoking and not near kitchens, burning candles, etc [20]. These sources had been omitted both in this study and in the preceding ones [3, 19], but in the hospitality industry UFP from “cooking & eating” microenvironments [21, 22] could not be excluded except by selection of venues and measuring distant from possible other sources like open kitchen or burning candle. More distant possible sources had been registered, but no influence on results could be detected before and after the ban. LDSA was also higher indoors, even in non-smoking rooms, than outdoors from urban traffic [3]. The mean of 34 and median of 25 µm²/cm³ found outdoors in 2019, should be underrun by indoor concentrations without indoor sources like smoking, heating, cooking, etc. From the present study, however, recent smoking in premises of the hospitality industry can only be suspected if mean LDSA exceeds 164 µm²/cm³ and PNC exceeds 34,435 particles per cm³. In winter with low evaporation also a mean aerodynamic particle diameter above 67 µm might give a hint, provided that particles from tobacco smoke had time to coagulate during aging. However, the average diameter plays a subordinate role and could be redundant as a measurement variable. On the other hand PNC and LDSA should be used more frequently as indicators of particulate air pollution from urban traffic [20, 21, 22, 23, 24, 25, 26], as well as from cigarettes [4, 19, 27].
No relevant difference between the different types of premises (bar disco, cafés, pub restaurant) was found any more after the ban, which is encouraging, because bars, clubs and discotheques before the ban had shown the highest exposures [3]. So protection of youth, which is attending these premises most frequently, seems to make progress in Vienna.
Limitations
Like PM1 also PNC and LDSA are highly correlated with air nicotine, but elevated values of UFP concentrations do not necessarily represent reliable evidence of smoking activity in a location. Before the implementation of the general smoking ban in the Viennese gastronomy, the studies could not prove any significant influence of candles, etc. on the surveyed parameters, but further investigations are recommended to confirm the results found. Replicability is not possible, but repeated cross-sectional studies should be able to show continuing improvement of air quality and further reductions of UFP in the hospitality industry.
Acknowledgements and Conflicts of Interests
The Austrian Academy of Science (Commission for Climate and Air Quality) provided all instruments used in this study and covered costs of service and calibration. No other funding was received for this study, but in maintenance of instruments and data collection the authors were supported by students of the Medical University of Vienna (Honoré- Spinler D, Riedmann H) and preceding diploma theses, especially one by Raab M, et al. [3]. The authors declare no conflicts of interests.
References
-
Schraufnagel DE (2020) The health effects of ultrafine particles. Exp Mol Med 52: 311-317.
-
Neuberger M (2018) indoor air and passive smoke. The pulmonologist 15(4): 254-262.
-
Raab M (2020) The ultrafine particle pollution in the Viennese gastronomy before the total smoking ban. Medical University of Vienna.
-
Moshammer H, Neuberger M, Nebot M (2004) Nicotine and surface of particulates as indicators of exposure to environmental tobacco smoke in public places in Austria. Int J Hyg Environ Health 207(4): 337-343.
-
Gorini G, Moshammer H, Sbrogiò L, Gasparrini A, Nebot M, et al. (2008) Italy & Austria Before and After Study: second-hand smoke exposure in hospitality premises before and after two years from the introduction of the Italian smoking ban. Indoor Air 18(4): 328-334.
-
Afshari A, Matson U, Ekberg LE (2005) Characterization of indoor sources of fine and ultrafine particles: a study conducted in a full-scale chamber. Indoor Air 15(2): 141- 150.
-
Neuberger M (2019) Effects of Involuntary Smoking and Vaping on the Cardiovascular System. Int J Occup Environ Med 1(1): 10-18.
-
Hantrakool S, Kumfu S, Chattipakorn SC, Chattipakorn N (2022) Effects of Particulate Matter on Inflammation and Thrombosis: Past Evidence for Future Prevention. Int J Environ Res Public Health 19(14): 8771.
-
Abdillah SFI, Wang YF (2023) Ambient ultrafine particle (PM0.1): Sources, characteristics, measurements and exposure implications on human health. Environ Res 218: 115061.
-
Machaczka O, Jirik V, Brezinova V, Vrtkova A, Miturova H, et al. (2021) Evaluation of Fine and Ultrafine Particles Proportion in Airborne Dust in an Industrial Area. Int J Environ Res Public Health 18(17): 8915.
-
(2020) Austrian Health Interview Survey (ATHIS). Statistics Austria.
-
Northrup TF, Jacob P, Benowitz NL, Hoh E, Quintana PJ, et al. (2016) Thirdhand Smoke: State of the Science and a Call for Policy Expansion. Public Health Rep 131(2): 233-238.
-
Cohen J (1988) Statistical Power Analysis for the Behavioral Sciences. 2nd (Edn.), Lawrence Erlbaum Associates.
-
Honoré Spinler DM (2022) Particulate matter pollution from tobacco smoke in Viennese night gastronomy two years after the introduction of the smoking ban. Medical University of Vienna.
-
Sima AK (2022) Medical University of Vienna.
-
McCaffrey M, Goodman PG, Clancy L (2005) Particulate pollution levels in Dublin pubs pre and post the introduction of the workplace smoking ban. Eur Respir J 26(49): 150.
-
Semple S, Creely KS, Naji A, Miller BG, Ayres JG (2007) Secondhand smoke levels in Scottish pubs: the effect of smoke-free legislation. Tob Control 16(2): 127-132.
-
Valente P, Forastiere F, Bacosi A, Cattani G, Di Carlo S, et al. (2007) Exposure to fine and ultrafine particles from secondhand smoke in public places before and after the smoking ban, Italy 2005. Tob Control 16(5): 312-317.
-
Neuberger M, Moshammer H, Schietz A (2013) Exposure to ultrafine particles in hospitality venues with partial smoking bans. J Expo Sci Environ Epidemiol 23(5): 519- 524.
-
Geiss O, Bianchi I, Barrero Moreno J (2016) Lung- deposited surface area concentration measurements in selected occupational and non-occupational environments. J Aerosol Sci 96: 24-37.
-
Pacitto A, Stabile L, Russo S, Buonanno G (2020) Exposure to Submicron Particles and Estimation of the Dose Received by Children in School and Non-School Environments. Atmosphere 11(5): 485.
-
Shah RU, Padilla LE, Peters DR, Dupuy Todd M, Fonseca ER, et al. (2023) Identifying Patterns and Sources of Fine and Ultrafine Particulate Matter in London Using Mobile Measurements of Lung-Deposited Surface Area. Environ Sci Technol 57(1): 96-108.
-
Gonzalez A, Boies A, Swanson J, Kittelson D (2022) Measuring the Air Quality Using Low-Cost Air Sensors in a Parking Garage at University of Minnesota, USA. Int J Environ Res Public Health 19(22): 15223.
-
Moshammer H, Neuberger M (2003) The Active Surface of Suspended Particles as a Predictor of Lung Function and Pulmonary Symptoms in Austrian School Children. Atmos Environ 37(13): 1737-1744.
-
Salo L, Hyvärinen A, Jalava P, Teinilä K, Hooda RK, et al. (2021) The characteristics and size of lung-depositing particles vary significantly between high and low pollution traffic environments. Atmos Environ 255: 118421.
-
Schwarz M, Schneider A, Cyrys J, Bastian S, Breitner S, et al. (2023) Impact of Ambient Ultrafine Particles on Cause-Specific Mortality in Three German Cities. Am J Respir Crit Care Med.
-
Canha N, Lage J, Coutinho JT, Alves C, Almeida SM (2019) Comparison of indoor air quality during sleep in smokers and non-smokers’ bedrooms: A preliminary study. Environ Pollut 249: 248-256.
- Pattern of Gonadal Hormones in Oral Testosterone-Supplimented Male Wistar Rats with Diabetes-Induced Hypogonadism
- Re-Evaluation of the Genotoxicity of Currently Used Food Dyes in Mouse Multiple Organs Via Continuous Administration by Drinking Using the Comet Assay
- Pharmacogenetics of Type 2 Diabetes Mellitus: Linking Genetic Variability to Drug Efficacy and its Cardiovascular Outcomes
- Exploratory Proteomic Profiling of SARS-CoV-2 Infected THP-1 Macrophages Reveals Alterations in Inflammatory Response and Cellular Metabolism
- Study of Genotoxicity of Hepatocarcinogens in Multiple Organs in Mice by Feeding and Drinking Using the Comet Assay
- Spirulina Polypeptides Inhibit the Growth of Human Lung Tumor (H460) Cells