A Systematic Review on Concentration of Heavy Metal in the Ambient Air of Different Industries and the Health Risk Assessment
Heavy metals are a group of pollutants that are found in ambient air of the industries. The metals can lead to cancerous and non-cancerous diseases in the exposed persons. In this systematic review, the concentration of heavy metals in the ambient air of industries and the related health risks were studied. In general, heavy metals with different average concentrations were found in various industries. Given the results, Zinc (539.96 μg/m³ ), Iron (216.04 μg/m³), Mercury (19.37 μg/m³), Lead (19.24 μg/m³), Arsenic (17/51 μg/m3), Chromium (12/18 μg/m³), Titanium (10/63 μg/m³ ), Nickel (9/09 μg/m³), Copper (8/11 μg/m³), Cadmium (6/7 μg/m³), Antimony (3/2 μg/m³), Manganese (2.99 μg/m³), Cobalt (1.32 μg/m³ ) were found in the air of the industries. For the zinc smelting, atomic energy, steel, roofing, printing, tape production, and cement, the highest concentration was for zinc (2518 μg/m³), lead (41/35 μg/m³), lead (45 μg/m³), lead (1/38 μg/m³), copper (20/20 μg/m³) and iron (216/04 μg/m³), respectively. All of the concentration in this research is reported in μg/m³. The average carcinogenic risk for the metals were 1.78×10⁻², 3.32×10⁻³, 3.6×10⁻², and 1.79×10⁻³ respectively for arsenic, cadmium, chromium, and nickel. The average non-carcinogenic risk of chromium, manganese, and mercury were 8.06×10⁴, 77×10-4, and 1.22×10⁻², respectively. According to the results, the variety of heavy metals in cement industry is more than in other industries, while the concentration of heavy metals in zinc smelting and atomic energy industries was more than remain. Zinc showed the highest average concentration and chromium showed the highest expected risk of carcinogenicity for occupational exposure
Introduction
Human uses the air every moment, it has a vital function for living beings [1]. A person breathes about 22,000 times a day and about 25 kg of air enters the lungs [1]. Generally, the effects of air pollution on humans are considered, however, air pollution is not ending of these effects [2]. The pollutants can affect humans, animals, plants and materials or the global environment and leave adverse effects [2]. Many of the pollutants enter the atmosphere via sources that are currently not controlled enough [3]. One of the pollutants is heavy metals [3]. Heavy metals are metals including cobalt, chromium, copper, gold, iron, lead, zinc, cadmium, manganese, nickel, mercury, and a limited number of other elements which have a specific gravity greater than 6 g/cm3 or an atomic mass greater than 50 [4]. From an economic point of view, they have an outstanding strategic role [4]. Although the presence of some of these elements in the body is very important in terms of nutrition for the metabolism, facing their excessive concentrations through different sources (air, water, and soil), can have adverse effects [5]. From the point of view of occupational health, exposure to heavy metals is also of particular importance. Occupational exposure to heavy metals mainly occurs through inhalation and during various industrial processes [6]. It can be mentioned that the effects on the central and peripheral nervous system, digestive system, kidneys, hematopoietic system, cardiovascular system, enzyme disorders, and finally cancer are the major effects of exposure to heavy metals [7]. Today, due to the industrialization of current societies, many cities or megacities have many industrial factories. As mentioned, one of the pollutants emitted from industries is heavy metals [8]. People in the cities, the workers of the industries, and their families are exposed to the metals in various ways. These metals enter workers’ houses through the contaminated clothes, hair and shoes, and expose their wives and children [9]. In this article, a systematic review of the concentration of heavy metals in the indoor air of the industries was investigated and the related health risks were calculated for the exposed workers of industries.
**Study Method**
In this systematic review, Databases of Science Direct, Google Scholar, SID, and MagIran were searched by applying the keywords “Air,” “Heavy metals”, and “Industry” in the period time from October 14, 2022, to October 23, 2022. In the next step, from the resulting articles, the cases including “Air,” Heavy metals”, and “Industry” in their title or summary keywords were selected. In this regard, 193 articles were related to the topic and 20 of them were selected after study of the abstract. Finally, 9 articles that reported the concentration of heavy metals in industrial air were included in the study [1, 2, 3, 4, 5, 6, 7, 8, 9].
To obtain the carcinogenic and non-carcinogenic risk, we use the method reported by Rostami, et al. [10]. Calculations, while it was 30 years for carcinogenic risk assessment in this line of research, equations (1) and (2) were used for calculation of the exposure concentration (EC) and estimated daily intake (EDI) then they were used for estimation of carcinogenic and non-carcinogenic risk, respectively.
Where, c: The concentration of employees exposed to heavy metal, ET (exposure time): In various industries, workers shifts are set every 8 hours., ED (exposure duration): The retirement age of workers is 30 years, EF (exposure frequency): The number of days that workers work in a year, which actually has 52 weeks in a year, each week including 5 working days, so we put 260, AT (averaging time): ED × 365 days, BW (body weight): The usual weight for women workers is 70 kg and for men 80 kg, so we use the average of these two, which is 75, and IR (inhalation rate): A normal person breathes 16 m³/day of air for 8 hours a day, but a worker uses 20 m³/day due to physical activities during our work. To assess the carcinogenic risks of heavy metals, we followed the equation provided by The United States Environmental Protection Agency (USEPA).
$$EC \left( \frac{\mu g}{m^3} \right) = \frac{c \left( \frac{\mu g}{m^3} \right) \times ET \left( \frac{h}{day} \right) \times ED(year) \times EF \left( \frac{day}{year} \right)}{AT(year) \times 365 \left( \frac{day}{year} \right) \times 24 \left( \frac{h}{day} \right)}$$
$$EDI \left( \frac{mg}{kg.day} \right) = \frac{C \left( \frac{\mu g}{m^3} \right) \times IR \left( \frac{m^3}{day} \right) \times ET \left( \frac{h}{day} \right) \times ED(year) \times EF \left( \frac{day}{year} \right)}{AT(year) \times 365 \left( \frac{day}{year} \right) \times 24 \left( \frac{h}{day} \right) \times BW(kg)}$$
Where, the Lifetime Cancer Risk (LTCR) denotes inhalation lifetime cancer risk and the Unit Risk (UR) denotes cancer unit risk. The UR values of As, Cd, Cr, and Ni are 4.3 × 10⁻³, 1.8 × 10⁻³, 1.2 × 10⁻², and 4.8 × 10⁻⁴ (µg/m³)⁻¹, respectively. Also, to assess the non-carcinogenic risk of Cr, Hg and Mn, the hazard quotient (HQ) value was employed as shown in the following equation (4).
To calculate the reference dose (RfD) for the heavy metals, we employed the reference concentration (RfC) approach. The values of RfC for Cr, Hg, and Mn were 8.86 × 10⁻⁴, 3.0 × 10⁻⁴, and 5.0 × 10⁻⁵, respectively.
While HQ values of more than 1.0 indicate a potential risk for exposed people a value of less than 1.0 is an indicator of an unacceptable level of risk.
$$LTCR = EC \left( \frac{\mu g}{m^3} \right) \times UR \left( \frac{\mu g}{m^3} \right)^{-1}$$
$$HQ = \frac{EDI \left( mg/kg.day \right)}{RfD \left( m/kg.day \right)}$$
Results and Discussions
Average Concentration of the Metals in the Industries
Out of 20 articles found about heavy metals in the air of different industries, 9 articles mentioned the concentration of heavy metals (zinc smelting industry in Iran, steel industry in Iran, roofing in Nigeria, printed circuit board industry in China, cement industries in China, Morocco, Czech Republic, and Iran, and Atomic Energy Organization in Iran), and according to the results, it can be seen from Figure 1 that zinc metal with a concentration (µg/m³) of 539.9 had the highest concentration among other metals, followed by: iron metal with a concentration of 216.04, mercury metal with a concentration of 37. 19, lead metal with a concentration of 19.24, arsenic metal with a concentration of 17.51, chromium metal with a concentration of 12.18, titanium metal with a concentration of 10.63, nickel metal with a concentration of 9.09, copper metal with a concentration of 8.11, There is cadmium metal with a concentration of 6.7, antimony metal with a concentration of 3.2, manganese metal with a concentration of 2.99 and cobalt metal with the lowest average concentration of 1.32.
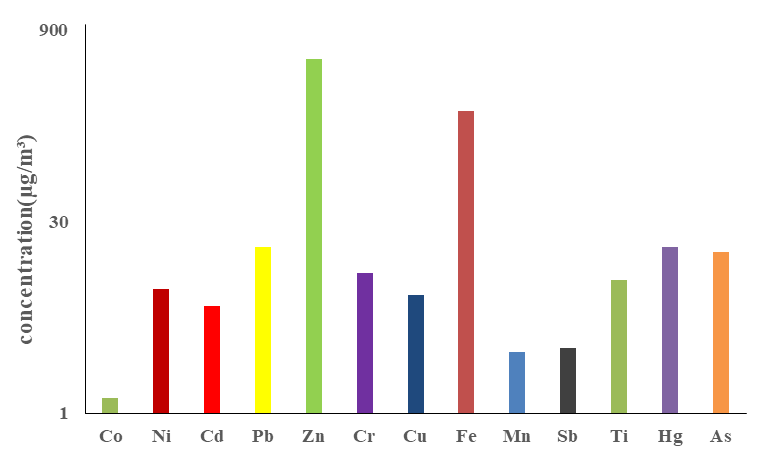
Figure1: The average concentrations of heavy metals in industries.
Concentration of the Metals in Various Industries
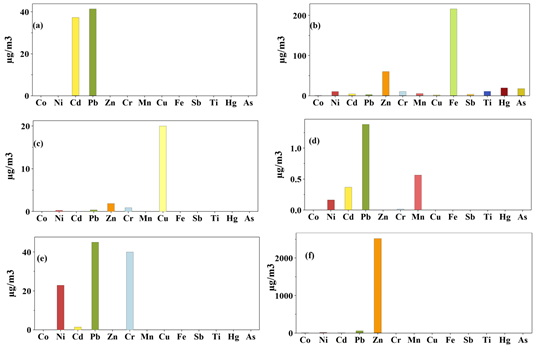
According to the obtained results, in the Atomic Energy Organization (Figure 2a), the concentrations of Lead (Pb) and Cadmium (Cd) are 41.35 µg/m3 and 37.3 µg/m3 respectively, which are more than other metals. The concentration of Pb metal in this industry is higher than in other industries, except the steel industry (41.35 vs. 45 µg/ m3). Also, Cd metal in this industry is more than other metals. In the cement industries (Figure 2b), the variety of metals in this industry is very large, and the most diverse industry is heavy metals. The concentrations of Iron (Fe) and Zinc (Zn) are 216.04 µg/m3 and 59.97 µg/m3 available in higher concentrations than other metals. The concentration of Fe metal in the air of this industry is much higher than other metals. In the Printed circuit board industry (Figure 2c), the concentration of Copper (Cu) is 20.025 µg/m3 available in higher concentration than other metals. In the Ile-ife roofing industry (Figure 2d), the concentrations of Pb, Manganese (Mn), Cd and nickel metals are 1.382 µg/m3, 0.564 µg/m3,
0.3663 µg/m3, and 0.1623 µg/m3 respectively, which are more than other metals. In the steel industry (Figure 2e), the concentrations of Pb, chromium (Cr), and Ni metals are 45 µg/m3, 40 µg/m3, and 23 µg/m3 respectively, which are more than other metals. The concentration of Cr and Ni in this industry is much higher than other industries. In the Zinc smelting industry (Figure 2f),) the concentrations of Zn and Pb are 2518 µg/m3 and 58.1 µg/m3 respectively, which are more than other metals.
Risk assessment
The standard amount of LTCR for an organization is from 1×10⁻⁵ to 1×10⁻⁶, and it is for USEPA 1×10⁻⁶ organizations, in this article, we follow the USEPA standard. The permissible HQ by USEPA is 1 [11]. According to Table 1, In the Zinc smelting industry, Ni and Cd metals showed the carcinogenic risk of 1.23×10⁻³ and 1.28×10⁻³ respectively. Cadmium and nickel can lead to chronic kidney dysfunction, osteomalacia (bone softening), acute heart failure, secondary hypertension, and arteriosclerosis [12]. In the steel industry, all three metals Ni, Cd and Cr have the risk of carcinogenesis and Cr metal has a much higher risk of carcinogenesis, and also, in this industry, the HQ or the non-carcinogenic risk of Cr metal is lower than the standard.
High concentration of chromium can lead to death, cancer, severe poisoning, allergy, or in the long term it can cause tumors body tissues [12]. In the roofing industry (Nigeria), Ni, Cd, and Cr metals have a carcinogenic risk. In the steel industry, all three metals Ni, Cd and Cr have the risk of carcinogenesis, and also, in this industry, the HQ of Cr, Mn metals are lower than the standard. Exposure to manganese can lead to iron deficiency [12]. In the Printed circuit board industry, Ni, Cd, and Cr metals have a carcinogenic risk, and also, in this industry, the HQ of Cr metal is lower than the standard. In Cement industries, Ni, Cd, Cr, As, Mn, Hg have a carcinogenic risk and As has a much higher risk of carcinogenesis. Inhalation of high concentrations of arsenic vapors and dust by the workers can lead to gastrointestinal side effects such as nausea, diarrhea, abdominal pain and also disorders of the nervous system [12]. For this industry, the HQ of Cr, Mn, and Hg metals are lower than the standard. In the Atomic Energy industry, Cd metal has a carcinogenic risk.
| Elements | LTCR | HQ | |
|---|---|---|---|
| Zinc smelting | Ni | 1.23×10⁻³ | - |
| Zinc smelting | Cd | 1.28×10⁻³ | - |
| Steel | Ni | 2.62×10⁻³ | - |
| Steel | Cd | 6.41×10⁻⁴ | - |
| Steel | Cr | 1.13×10⁻¹ | 2.53×10⁻³ |
| Roofing | Ni | 1.84×10⁻⁵ | - |
| Roofing | Cd | 1.56×10⁻⁴ | - |
| Roofing | Cr | 4.7×10⁻⁵ | 1.04×10⁻⁶ |
| Roofing | Mn | - | 3.57×10⁻⁵ |
| Printed circuit board | Ni | 2.9×10⁻⁵ | - |
| Printed circuit board | Cd | 1.7×10⁻⁵ | - |
| Printed circuit board | Cr | 2.62×10⁻³ | 5.83×10⁻⁵ |
| Cement industries | Ni | 1.16×10⁻³ | - |
| Cement industries | Cd | 1.93×10⁻³ | - |
| Cement industries | Cr | 2.86×10⁻² | 6.36×10⁻⁴ |
| Cement industries | As | 1.78×10⁻² | - |
| Cement industries | Mn | - | 3.42×10⁻⁴ |
| Cement industries | Hg | - | 1.22×10⁻² |
| Atomic Energy | Cd | 1.59×10⁻² | - |
Table 1: Health risk assessment of heavy metals in the indoor air of industries.
Conclusion
According to the obtained results, attention should be paid to the cement industries and the zinc smelting industry because the observed concentrations of metals in the air of these industries are much higher than other industries. In accord with the results obtained from the calculation of LTCR and HQ, as well as according to the stated standard, the LTCR of chromium metal exceeds the permissible limit and should be taken into account. We should also pay more attention to chromium metal and arsenic in the cement industry and to cadmium metal in the industry. It should be noted that the Atomic Energy Organization has also allocated a significant number in the LTCR. Regarding the results, more rigorous monitoring and health protection instructions are required to control of the adverse effects of the heavy metals and the workplaces. In this regard, emphasis on application of appropriate personal protection equipment and decrease of the contact time with the considerate shift planning by the managements system can be helpful.
Acknowledgments
The authors are grateful to thank you Semnan University of medical sciences for supporting this research and thank you to Mr. Mohamad Javad Akbari for typing quotes from this article.
References
-
Moattar F, Mikhchi KH, Mohammadzadeh A, Karbasi A, Delbari AS (2008) Determination of Heavy Metal (Lead, Cadmium) Pollution in Air around Nuclear Power. Journal of Environmental Science and Technology 14(3): 37-29.
-
Golbabaei F, Hassani Z, Shahtaheri SJ, Mahmoudi M, Tirgar A (2005) Assessing the exposure of smelting industry workers in Zanjan to heavy metals, 2004-2005. J Adv Med Biomed Res 13(53): 55-61.
-
Arfala Y, Douch J, Assabbane A, Kaaouachi K, Tian H, et al. (2018) Assessment of heavy metals released into the air from the cement kilns co-burning waste: Case of Oujda cement manufacturing (Northeast Morocco). Sustainable Environment Research 28(6): 363-373.
-
Huang Y, Liu J, Yang L, Li X, Hu G, et al. (2021) Fate of lead and cadmium in precalciner cement plants and their atmospheric releases. ACS omega 6(33): 21265-21275.
-
Mousavian NA, Mansouri N, Nezhadkurki F (2017) Estimation of heavy metal exposure in workplace and health risk exposure assessment in steel industries in Iran. Measurement 102: 286-90.
-
Ogundele LT, Owoade OK, Hopke PK, Olise FS (2017) Heavy metals in industrially emitted particulate matter in Ile-Ife, Nigeria. Environmental research 156: 320-325.
-
Shen W, Liu Y, Yan B, Wang J, He P, et al. (2017) Cement industry of China: Driving force, environment impact and sustainable development. Renewable and Sustainable Energy Reviews 75: 618-628.
-
Sýkorová B, Kucbel M, Raclavská H, Raclavský K, Matýsek D (2017) Heavy metals in air nanoparticles in affected industry area. Journal of Sustainable Development of Energy, Water and Environment Systems 5(1): 58-68.
-
Zhou P, Guo J, Zhou X, Zhang W, Liu L, et al. (2014) PM2. 5, PM10 and health risk assessment of heavy metals in a typical printed circuit noards manufacturing workshop. Journal of Environmental Sciences 26(10): 2018-2026.
-
Rostami R, Kalan ME, Ghaffari HR, Saranjam B, Ward KD, et al. (2021) Characteristics and health risk assessment of heavy metals in indoor air of waterpipe cafés. Building and Environment 190: 107557.
-
Beck NB, Becker RA, Erraguntla N, Farland WH, Grant RL, et al. (2016) Approaches for describing and communicating overall uncertainty in toxicity characterizations: US Environmental Protection Agency’s Integrated Risk Information System (IRIS) as a case study. Environment international 89: 110-1 28.
-
Golmohammadi R, Darvishi E (2019) The combined effects of occupational exposure to noise and other risk factors− a systematic review. Noise & Health 21(101): 125-141.
- Pattern of Gonadal Hormones in Oral Testosterone-Supplimented Male Wistar Rats with Diabetes-Induced Hypogonadism
- Re-Evaluation of the Genotoxicity of Currently Used Food Dyes in Mouse Multiple Organs Via Continuous Administration by Drinking Using the Comet Assay
- Pharmacogenetics of Type 2 Diabetes Mellitus: Linking Genetic Variability to Drug Efficacy and its Cardiovascular Outcomes
- Exploratory Proteomic Profiling of SARS-CoV-2 Infected THP-1 Macrophages Reveals Alterations in Inflammatory Response and Cellular Metabolism
- Study of Genotoxicity of Hepatocarcinogens in Multiple Organs in Mice by Feeding and Drinking Using the Comet Assay
- Spirulina Polypeptides Inhibit the Growth of Human Lung Tumor (H460) Cells