Nutritional Status of Primary School Going Children of Charkhole Village Kalimgpong West Bengal
Introduction: Nutritional status in children is an indicator of health and well-being at both theindividual and the population level. Screening for children health status is an integral part of social wellbeing. Nutritional intervention requires repeated measurement of nutritional status to assess severity and to track progress over time. Aims: To assess nutritional status of the participants with reference to their diet habits. To have a comparative analysis of the socio economic background and growth status of the children. Methodology: Methodological issues in the assessment of nutritional status are reviewed with emphasis on anthropometric measurement, body composition, and dietary pattern of children at risk for malnutrition, overnutrition and obesity. Standard anthropometric variables are measured like height weight circumference and skinfold measurement. Results: The findings of the study reveal obesity-1 and overweight children of both sexes in their pre puberty age group. Marginal variations in skinfold and other variables were noticed in the lower age group children among both sexes. Conclusion: Malnourishment among the participants was not found. Age specific height differences were lesser than the weight differences. Obesity among higher age group children indicated dietary significance among the pre adolescents
Background
Food insecurity and poor nutrition remain a problem in many developing countries, including India. Poor nutritional status during childhood can have long lasting scarring consequences into adulthood [1]. Children belonging to 5-10 yrs of age group are vulnerable because of their rapid growth rate [2, 3]. Malnutrition in young children puts them at a higher risk of experiencing health problems such as stunted growth, mental retardation, increased susceptibility to infectious diseases [4]. Under nourishment or mal nourishment as well as over nutrition in children can cause multiple adverse effects on the nutritional and growth status of children. Childhood obesity has become a major public health problem on the global upfront [5].
Tribal Communities are isolated from general population and are socially and economically disadvantaged. In view of their habitat and dietary habits, they often distinguish themselves from other population groups. Their food consumption pattern is influenced by vagaries of natures and varies from extreme deprivation in lean season to high level of intakes of several foods during post-harvest period. Geographical isolation, primitive agricultural practices, socio cultural taboos, lack of formal education, poor infrastructure facilities, improper health seeking behavior, poverty, etc. leads to the development of various morbidities and under nutrition.
The present study was done on primary school going children in a small village named Charkhole, located in the Kalimpong district of West Bengal. At an altitude of nearly 5500 feet, Charkhole is located just 27 km from Kalimpong town. The schools were located near the Chauk Bazar of the village, and some near the outskirts of kalimgpong.
The present study can have various applications in the field of child health care living in the under privileged circumstances. The study can give insights to the growth status of tribal hill dwelling children, living under unfavorable climatic conditions. The results of this study can show the level of national deficiency in children of the village and can assess any co relation with their socio economic status and family background. The present study can be useful indications of the required necessary steps to be taken for further development of the hill children both in respect of their diet and nutrition.
In Asia the rate of under nutrition is the highest in the world [6]. In the world, half of the count of malnourished children is from India, Bangladesh, Pakistan [7, 8]. 40% of this comes from India, significantly associated with high rates of morbidity and mortality in the world [9]. Among the total population of children in West Bengal, half of them are malnourished [10, 11]. Poor nutritional status in childhood can lead to long lasting scarring consequences in adulthood. It can effect in health, mortality, schooling, and productivity.
Objective
- To assess the nutritional status of children (age: 5yrs- 10yrs)of both the sexes, with reference to their dietary habits.
- To have the comparative analysis of d growth status of both the sets of subjects
- To have a comparative account of socio economic background of both set of subjects.
• This study aims to assess the risk factors that can lead due to this mal and under-nutritional effect—like stunted growth, mental retardation, increased susceptibility to infectious diseases [12].
Methods & Procedure
• Study Area: A cross sectional study is done on both male and female children of age 5-10 yrs, in charkhole village of kalingpong district in West Bengal.
• Sample size: around 150 male subjects and 150 female subjects of primary schools were selected for the study. All the subjects were of the age range between 5yrs to 10yrs of age.
• Methods: Anthropometric measurements like height, skin fold (biceps, triceps, sub-scapular, supra iliac, medial calf, mid-thigh-in mm),sitting height vertex, and weight were measured. Some derived variables are also to be implicated. Three commonly used under nutrition indicators i.e. stunting underweight and wasting are to be used to evaluate the nutritional status of d subjects. The sub ischial leg length (SILL) is to be derived by subtracting sitting height vertex from total height. The upper trunk length (UTL) is to be calculated by subtracting SILL from total height. The percentage of these two derived variables (SILLP and UTLP) to be estimated in terms of percentage ratio of the total height. Body mass index (BMI, kg/m2) is to be calculated by standard formula for all the subjects individually. The instruments to be used are-martin’s anthropometer, weighing machine, skin fold caliper, steel tape.
SH helps to define body proportions. SILL, SH/SILL are useful tools for clinicians and researchers in related areas. SH/H (SDS) ratio is done to consider exceptionally short or tall children.
• Statistical Variables: The mean, SD and age variations of the variables among the children are studied.
• Information: Socio economic information are collected on age, education level of parents, ethnicity, religion, parents occupation, number of siblings, family income, health and illness concept, classroom climate of the concerned school and hygiene, environmental status. The information is to be collected by questionnaire methods and later confirmed from school records and from the families of each subject. Special emphasis on their dietary habits is documented (Tables 1-4).
| Variables | Sex | Age in Years | |||||
|---|---|---|---|---|---|---|---|
| 5 | 6 | 7 | 8 | 9 | 10 | ||
| HEIGHT (cm) | Boys | 113.41 | 117.07 | 108.98 | 120.53 | 117.87 | 114.08 |
| Girls | 111.57 | 116.4 | 108.11 | 118.01 | 115.47 | 107.93 | |
| Weight (Kg) | Boys | 29.3 | 33.32 | 33.55 | 35.72 | 43.98 | |
| Girls | 24.69 | 26.22 | 28.4 | 35.6 | 33.8 | 38.98 | |
| BMI | Boys | 24.21 | 24.98 | 32.09 | 24.72 | 26.9 | 34.18 |
| Girls | 20.82 | 20.81 | 25.52 | 27.01 | 26.59 | 34.29 | |
| Category | Boys | Normal | Normal | Obese -1 | Normal | Over Weight | Obese -1 |
| Girls | Normal | Normal | Over Weight | Over Weight | Over Weight | Obese -1 |
Table 1: Shows the average of height, weight, BMI and the categorization of the subjects according to their ages and sex.
| Variables | Sex | Age in Years | |||||
|---|---|---|---|---|---|---|---|
| 5 | 6 | 7 | 8 | 9 | 10 | ||
| Mean HEIGHT | Boys | 113.41 | 117.07 | 108.98 | 120.53 | 117.87 | 114.08 |
| Girls | 111.57 | 116.4 | 108.11 | 118.01 | 115.47 | 107.93 | |
| Mean Weight | Boys | 29.3 | 33.32 | 35.77 | 33.55 | 35.72 | 43.98 |
| Girls | 24.69 | 26.22 | 28.4 | 35.6 | 33.8 | 38.98 | |
| Std. Deviation (Height) | Boys | 15.19 | 18.78 | 14.42 | 20.26 | 17.35 | 5.63 |
| Girls | 14.83 | 18.63 | 14.44 | 21.2 | 17.52 | 7.92 | |
| Std. Deviation (Weight) | Boys | 6.47 | 8.89 | 6.68 | 6.06 | 4.34 | 3.43 |
| Girls | 7.11 | 5.99 | 5.4 | 13.21 | 7.94 | 12.26 |
Table 2: Shows the statically analysis of height and weight to the subjects with mean, standard deviation.
| Variables | Sex | Age in Years | |||||
|---|---|---|---|---|---|---|---|
| 5 | 6 | 7 | 8 | 9 | 10 | ||
| BICEPS SF | Boys | 10.65 | 9.79 | 10.19 | 11.5 | 11.95 | 12.48 |
| Girls | 10.8 | 10 | 9.83 | 11.39 | 10.12 | 11.43 | |
| Std. Dev BICEPS | Boys | 2.77 | 2.32 | 1.8 | 2.21 | 2.05 | 1.48 |
| Girls | 3.97 | 4.75 | 3.87 | 4.48 | 3.79 | 6.23 | |
| TRICEPS SF | Boys | 14.85 | 13.83 | 13.61 | 14.75 | 13.65 | 14.47 |
| Girls | 16.03 | 13.3 | 12.44 | 15.02 | 13.36 | 12.97 | |
| Std. Dev TRICEPS | Boys | 3.53 | 1.77 | 2.37 | 3 | 1.68 | 1.42 |
| Girls | 7.58 | 5.51 | 5.69 | 5.16 | 4.96 | 3.14 | |
| SUB SCAPULAR | Boys | 17.92 | 19 | 17.46 | 18.81 | 18.21 | 19.55 |
| Girls | 25.02 | 16.41 | 15.63 | 17.87 | 15.53 | 13.87 | |
| Std. Dev SUB SCAPULAR | Boys | 4.08 | 3.07 | 3.31 | 4.25 | 3.55 | 2.22 |
| Girls | 36.96 | 6.15 | 5.14 | 6.81 | 5.82 | 3.84 | |
| SUPRAILIAC | Boys | 23.91 | 26.83 | 27.31 | 24.54 | 24.61 | 26.25 |
| Girls | 23.86 | 19.21 | 20.67 | 21.26 | 16.63 | 17.03 | |
| Std. Dev SUPRAILIAC | Boys | 3.09 | 3.32 | 11.71 | 3.59 | 2.98 | 3.86 |
| Girls | 13.87 | 8.79 | 14.02 | 14.24 | 4.09 | 4.28 | |
| 5 | 6 | 7 | 8 | 9 | 10 | ||
| Mean SILL | Boys | 31.77 | 31.32 | 31.7 | 32.27 | 33.22 | 36.53 |
| Girls | 33.97 | 32.1 | 32.53 | 33.32 | 33.62 | 36.02 | |
| Std. Dev SILL | Boys | 8.11 | 0.61 | 2.27 | 4.05 | 6.29 | 9.33 |
| Girls | 6.75 | 0.37 | 2.03 | 3.96 | 5.72 | 7.66 | |
| Mean UTL | Boys | 81.63 | 85.75 | 77.28 | 88.27 | 84.66 | 77.55 |
| Girls | 77.61 | 84.3 | 75.58 | 84.68 | 81.85 | 71.92 | |
| Std. Dev UTL | Boys | 14.63 | 18.97 | 13.95 | 20.66 | 15.44 | 7.89 |
| Girls | 13.64 | 18.67 | 14.06 | 21.44 | 15.98 | 7.2 |
Table 3: Shows the average of skinfold measurement of the subjects along with their statistical analysis with standard deviation
Food Habits and Socio-Economic Status
Nutrition is an important requirement for good health and growth among children. It also helps in cognitive potential, thinking ability among children. Food is very much culture specific, that is an individual have choice of food where he is living. More over food habits gets influenced by tradition, belief, notions and taboos of that particular culture. Other than this religion, education and economy also have impact on food habits. The children of charkhol are living in very poor socio economy conditions. They live in the hilly areas with their families either working in tea garden as workers or home stay workers. Children are also found as labor in home stays for earning money. Along with this they are also going to school.
The children take three courses of milk mainly breakfast, lunch and dinner rarely includes snacks too. Their daily diets comprise mainly of carbohydrate as mostly it is rise. All meals comprised mainly of carbohydrates component mostly rise, stale roti, protein component dal, egg, chicken, vegetables like potatoes and squash and rarely they consume fish. Occasionally they consume pork. They are not aware of motive of food intake. They are of opinion they consume food as directed their parents. They do not use much oil in their food and keep it simple and do not enrich it much with spices. Their diet primarily consists of cereals and pulses. Rice, dal and squash potato curry as lunch and dinner, stale roti with tea as breakfast. Milk & milk products are observed to be almost absent from their daily diet. Consumption of ghee is not there, they only sell it (Figures 1-4).
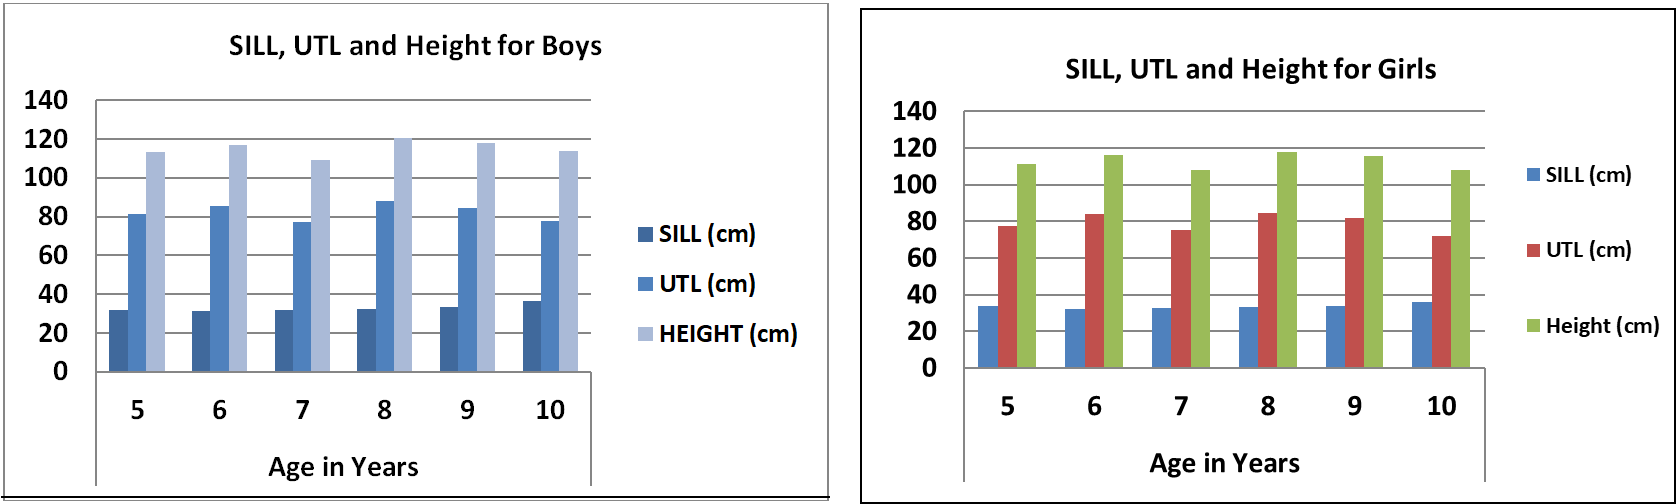
Figures 1 and 2: Bar Graph showing results of SILL, UTL of the participant boys and girls respectively.
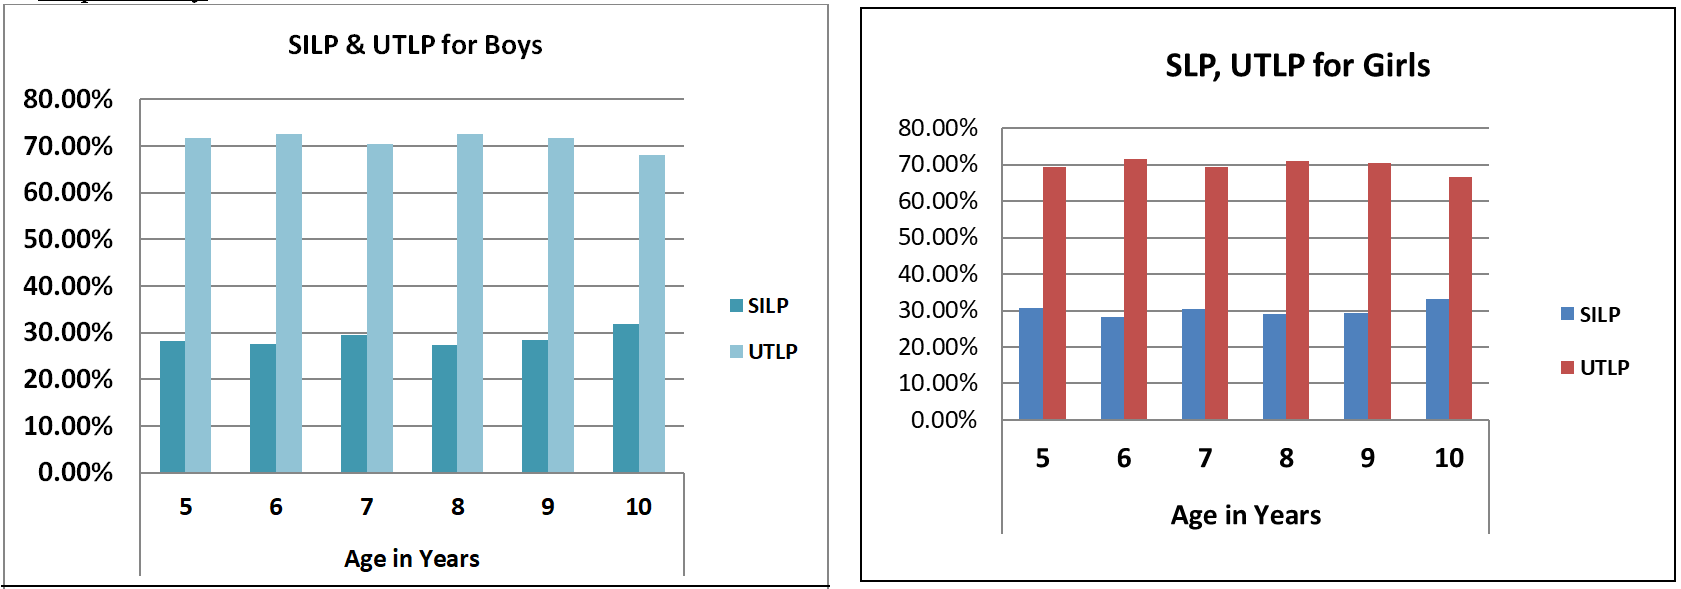
Figures 3 and 4: Bar Graph showing results of percentage of SILL, UTL of the participant boys and girls respectively.
Results and Analysis
The above study on male and female school going children shows marginal variation in their heights in correspondence with their ages. The variation in weight is noticeable in the 10year age group among the two sexes of the sample subjects. BMI calculation reveals normal category among children of 5-8 yrs. with both the sexes, while overweight children are found in the age group of 8-9 yrs. Obese -1 category is also found in the age group of 10 yr within both the sex.
Sub ischial leg length (SILL) shows a marginal higher average value among the girl subjects of al the concerned age groups. The percentage value of this variable (SILP) is higher among the girls than the boys, the highest value being seen among the 10yrs age group of girls. The upper trunk length (UTL) gives higher value among the boys of all age groups. The highest average UTL value is found in the age group of 8yrs among the boys. The percentage value of this variable (UTLP) shows marginal higher values among the boys, the highest average value being seen in the age group of 8 yr boys.
There has been marked variation in the values of skinfold measurement of the concerned subjects between the two sexes, relating to their subcutaneous fat deposition in various age groups. The biceps skinfold gives the highest average value among the boys of 10yrs old. The triceps skinfold value is highest among the lower age groups of 5-6 yrs. in both male and female subjects. The subscapular skinfold is markedly higher among the girl subjects of 5-6 yrs. age group. The suprailiac skinfold is remarkably less among the girl subjects of 8-10 yrs. age group, the highest value is found among the boys of age group 7yrs.
Discussion
Anthropometric measurements were used for various purposes, be for studying growth patterns, identifying sexual dimorphism, assessing nutritional status, body composition, relation to various physical as well as metabolic diseases and so on. Here we have tried to study the age variations and sexual dimorphism in various anthropometric variables teases nutritional status among children aged 5-10years of charkhole village, Kalimgpong, West Bengal, India. There were no significant sexual dimorphisms between the boys and girls in most of the age groups as well as in most of the anthropometric variables. This resembles with a study among the Chinese children where it was noticed that there were no sex differences before the age of 11-years [13, 14]. The study among the individuals from Naxalbari, Darjeeling District, West Bengal, India revealed the identification of sex from SILL and other anthropometric measurements [15].
The present study revealed age specific variations in weight of the participants, more than their heights. The Results differed from the study among the 6-12-years aged Bengalee school boys where variables like Ht, SILL, St Ht has positive significant correlation [16]. In a study done on children and adolescents and young adults from America it was found that, the UTL be a better predictor of BMI than SILL [17]. The SILL may be a good indicator of the quality of environment for growth in infancy. The present study showed no specific sex differences in SILL of the participants, whereas the female participants showed marked UTL variations in the lower age group. Ratio of various body segments such as Ht and SILL or UTLP and SILLP showed positive correlation among the Turkish children aged 3-18-years [18, 19].
Conclusion
The present study reveals lesser variation in heights of the participants, variations was marked in weights indifferent age groups. The children belonging from the lower age group were found to be normal weight. Obesity was found among children of the higher age groups. BMI of the participants showed no results of Malnourishment. The above study on the school going children aims to reveal the nutritional and health status of the subjects in both sexes within different age ranges. In addition, it reveals the traditional dietary pattern, diversity of the food consumed and their probable association with health status related to malnourishment or obesity factors among the pre-adolescent subjects.
References
-
Behrman JR (1988) Nutrition Health Birth Order and Seasonality. Intra house hold Allocation among Children in Rural India. Journal of Development Economics 28(1): 43-62.
-
Nandy S, Irving M, Gordon D, Subramanian SV, Davey SG (2005) Poverty, child undernutrition and morbidity: new evidence from India. Bull World Health Organ 83(3): 210-216.
-
International Institute for Population Sciences (IIPS) and ORC Macro (2007) National Family Health Survey (NFHS-2), 2005-2006, IIPS, Mumbai.
-
Indian Academy of Pediatrics UG teaching guidelines available.
-
Mandal A, Mandal GC (2012) Prevalence of overweight and obesity among the urban adolescent English medium school girls of Kolkata, India. IJPH 9(3).
-
Bhattacharya A, Pal B, Mukherjee S, Roy SK (2019) Assessment of nutritional status using anthropometric variables by multivariate analysis. BMC Public Health 19: 1045.
-
Joshi HS, Gupta R, Joshi MC, Mahajan V (2011) Determinants of Nutritional Status of School Children- A Cross-sectional Study in the Western Region of Nepal. NJIRM 2(1): 10-15.
-
Levinson JF (1998) India sector review of nutrition programmers. A background paper prepared for the World Bank, New Delhi India.
-
Bose K, Bisai S, Mukharjee S (2008) Anthropometric characteristics and nutritional status of rural school children. Intern J Biol Anthropol 2(1): 1-6.
-
Bose K, Bhunia D, Paul G, Mukhopadhyay A, Chakraborty R (2006) Age and Sex Variations in Under nutrition of Rural Bengalee Primary School Children of East Midnapore District, West Bengal, Indian. Journal of Human Ecology (14): 71-75.
-
Bisai S, Bose K, Ghosh A (2008) Nutritional status of Lodha children in a village of Paschim Medinipur district, West Bengal, Indian. J Public Health 52(4): 203-206.
-
Turan S, Bereket A, Omar A, Berber M, Ozen A, et al. (2005) Upper segment/lower segment ratio and arm span-height difference in healthy Turkish children. Acta paediatr 94(4): 407-413.
-
Kaushik A, Richa R, Mishra CP, Singh SP (2012) Nutritional status of rural primary school children and their socio- demographic correlates: A cross sectional study from Varanasi. Indian Journal of Community Health 24(4): 310-318.
-
Pal S, Bose K (2017) Anthropometric characteristics of rural primary school children of Hooghly District, West Bengal, India. Human Biology Review 6(1): 30-46.
-
Banik SD (2016) Interrelationships between height and selected linear body dimensions and estimation of sex in nepali-speaking adults from Naxalbari, Darjeeling. J Forensic Res 7(354): 2-8.
-
Frison S, Kerac M, Checchi F et al. (2016) Anthropometric indices and measures to assess change in the nutritional status of a population: a systematic literature review. BMC Nutr 2(76): 2-11.
-
Ghosh JR, Bandyopadhyay AR (2005) A study on cormic index among semi-urban bengalee boys of West Bengal, India. Coll Antropol 29(1): 33-36.
-
Burton R (2018) the sitting-height index of build, (Body Mass)/ (SittingHeight), as an improvement on the body mass index for children, adolescents and young adults. Children(Basel) 5(2): 30.
-
Rashmi P, Singh P (2019) Anthropometric Assessment of Nutritional Status among Scheduled Caste Children (6-12 years) in Lucknow. Human Biology Review 8(3): 197-204.
- The Indispensable Role of Informal Caregivers in Supporting the Aging Population
- Socio-Religious Significance of Kamakhya Temple in Guwahati, Assam
- Is Anthropology Possible?
- A Contribution to the History and Paleobiology of Harput/Elazığ Türkiye and Its Surroundings
- A Study on the Cowrie Shells of the Dimasas in Assam
- The Significance of International Organizations Cooperation in the Efficient Resolution of Global Conflict