The Effect of Novel Proprietary Test Formulation for Immunomodulatory activity by Assessing the CD Biomarkers and Colon Microscopy in TNBS-induced Ulcerative Colitis (UC) Rats Model
The aim of the present study was to evaluate the immunomodulatory action of Biofield Energy Healing (the Trivedi Effect®) Treatment to the animals and to the novel proprietary test formulation in tri-nitro benzene sulphonic acid (TNBS)-induced male Sprague Dawley rats. The test formulation consists of minerals (zinc, magnesium, iron, and copper) and vitamins (B6 , B12, and D3 ). Each ingredient of the test formulation was divided into two parts. One part was denoted as the control without any Biofield Energy Healing Treatment, while the other part was defined as the Biofield Energy Treated sample, which received the Biofield Energy Healing Treatment by a renowned Biofield Energy Healer, Mr. Mahendra Kumar Trivedi. Additionally, three group of animals were also received Biofield Energy Treatment per se under similar conditions. The cellular biomarkers like cluster of differentiation-4 (CD4+ ), CD8+ , and CD28+ , biochemistry and hematology along with histopathologic profile were evaluated. The percentage of CD4+ count was increased by 8.87% in the G6 (Biofield Energy Treatment per se at day -15) group as compared to the untreated test formulation (G4) group. While the expression of CD8+ count was increased by 10.12% and 13.01% in the G6 and G7 (Biofield Energy Treated test formulation at day -15) groups, respectively as compared with the disease control (G2) group. Moreover, the level of CD28+ was significantly (p≤0.001) increased by 15.50% in the G5 (Biofield Energy Treated test formulation) group compared to the G2 group. In hematological analysis, platelet count was increased in the G7 by 8% compared with the G4. The level of uric acid was decreased by 40.47%, 13.8%, and 14.28% in the G6, G8 (Biofield Energy Treatment per se to animals plus Biofield Energy Treated test formulation at -15 day), and G9 (Biofield Energy Treatment per se to animals plus untreated test formulation) groups, respectively as compared with the G4 group. Histopathologic findings of all the tested groups did not show any abnormal findings with respect to the safe and nontoxic treatment strategies, which indicated that, the test formulation and Biofield Energy Treatment per se ameliorates colon inflammation in the TNBS-induced colitis rats by decreasing histopathologic lesions. Overall, the experimental data concluded that the Biofield Energy Treated test formulation showed considerable improved cellular and humoral immune response as compared with the untreated test formulation. Thus, the Trivedi Effect®-Biofield Energy Healing Treatment per se and the test formulation considerable improved cellular immune response, immunomodulatory effect, and gut health function.
Introduction
Natural defence system of the body against various infectious diseases is maintained and denoted as immunity, while several factors has been reported to trigger the immunity such as internal and external stimuli, different forms of infection, and immunization [1]. Immune system has been categorized in two major categories; these are innate immune system (non-specific immune system) and adaptive immune system (specific or acquired immune system) [2]. In order to maintain the strong immunity, immune system has to be modulated using different methods. Vitamins, minerals and many alternative treatment approaches have been found to have significant contribution related with the immunomodulatory therapeutics. Besides, with comparison to the other synthetic drugs, vitamins and minerals have constituted the minimal side effects. These constituents may influence the immune system either by affecting the immune cells functions or affecting the antibody secretion in order to control the infection and to maintain the immune homeostasis. With continued increased incidence of diseases, increased population growth, and altered lifestyles [3], gastrointestinal diseases has been increasing. Besides, multidrug has been developed due to the high use of antibiotics [4]. Thus, a novel test formulation has been developed that would improve the immunomodulation using various haematological and biochemical characteristics. Immunomodulatory modulation based drugs has been increased its importance because they alter the immune response at desired level [5, 6]. Stress is one of the major factors which alters the immune system and causes many autoimmune and inflammatory diseases [7, 8]. The novel test formulation comprised of zinc chloride, ferrous sulphate, copper chloride (II-cupric), pyridoxine HCl (vitamin B6), cyanocobalamin (vitamin B12), magnesium (II) gluconate, and cholecalciferol (vitamin D3) and it was tested against the various immunologic parameters. Minerals and vitamins have been reported to alter the immune response and were reported to work against many inflammatory diseases [9, 10, 11]. In addition, the test formulation was treated with the complementary medicine, Biofield Energy Treatment by a renowned Biofield Energy Healer.
Biofield therapy, one of the best Complementary and Alternative Medicine (CAM) defines as the group of therapies altering the people’s health and well-being by interacting with their biofield. These therapies has been found to be significant against stress reduction and enhanced coping abilities, reduction in chronic pain in case of arthritis and other conditions, quicker recovery from many infectious diseases, and overall improved functioning of bodily systems. Biofield Energy Healing as CAM has been accepted worldwide [12, 13]. Biofield Energy Healing Therapies have been practiced and accepted by the U.S. population and is well defined by National Center for Complementary and Alternative Medicine (NCCAM) [14, 15]. Some complementary therapies significantly reported worldwide for their wide acceptability such as external qigong, Johrei, Reiki, therapeutic touch, yoga, Qi Gong, polarity therapy, Tai Chi, pranic healing, deep breathing, chiropractic/osteopathic manipulation, guided imagery, meditation, massage, homeopathy, hypnotherapy, progressive relaxation, acupressure, acupuncture, special diets, relaxation techniques, Rolfing structural integration, healing touch, movement therapy, pilates, mindfulness, Ayurvedic medicine, traditional Chinese herbs and medicines in biological systems both in vitro and in vivo. The Trivedi Effect®-Consciousness Energy Healing therapies found significantly improved the metal physicochemical properties [16, 17, 18], improved crop yield in agriculture science [19, 20], microbiology [21, 22, 23], biotechnology [24, 25], improved bioavailability of many compounds [26, 27, 28], improved skin health [29, 30], improved properties of nutraceuticals [31, 32], cancer science research [33, 34], improved overall bone health [35, 36, 37], human health and wellness. Thus, the present study was designed to study the immunomodulatory activity of the test formulation using immune biomarkers such CD markers (CD4+, CD8+, and CD28+), hematology parameters, biochemistry, and histopathology in Sprague Dawley rats.
Materials and Methods
Chemicals and Reagents
Copper chloride, cholecalciferol (vitamin D3), sodium carboxymethyl cellulose (Na-CMC), sulphasalazine, and iron (II) sulfate were procured from Sigma-Aldrich, USA. Pyridoxine hydrochloride (vitamin B6), zinc chloride, cyanocobalamin (vitamin B12), and magnesium (II) gluconate were purchased from TCI, Japan. TNBS (Tri-nitro Benzene Sulphonic acid) was purchased from HiMedia, India. All the other chemicals used in this experiment were analytical grade procured from India.
Experimental Animals
Randomly breed male Sprague Dawley rats with body weight around 220 to 350gm were used in this study. The animals were purchased from M/s. National Institute of Biologicals, India. Animals were randomly divided into nine groups based on their body weights consist of eight animals of each group. They were kept individually in sterilized polypropylene cages with stainless steel top grill having provision for holding pellet feed and drinking water bottle fitted with stainless steel sipper tube. The animals were maintained as per standard protocol throughout the experiment.
Consciousness Energy Healing Strategies
Each ingredient of the test formulation was divided into two parts. One part of each ingredient was considered as control, where no Biofield Energy Treatment was provided. Another part of each ingredient received Biofield Energy Treatment by Mr. Mahendra Kumar Trivedi (known as the Trivedi Effect®) under laboratory conditions for ~3 minutes. In addition, three different test group as per experimental protocol, the animals were also received Biofield Energy Treatment under laboratory conditions for ~3 minutes. The blessing/treatment was given to the test items by his physical presence without touching in the laboratory of Dabur Research Foundation, near New Delhi, India. Similarly, the control samples were subjected to “sham” healer under the same laboratory conditions for ~3 minutes. The “sham” healer did not have any knowledge about the Biofield Energy Treatment. After that, the Biofield Energy Treated samples were kept in the similar sealed condition. The Biofield Energy Treated animals were also taken back to the animal experimental room for further proceedings.
Experimental Test Groups
The gut health oxidative stress biomarkers experiment was divided into 9 animals groups from G1 to G9. G1 denoted as normal control with vehicle (0.5% CMC), G2 group defined as colitis control, with 50% TNBS in ethanol using intra- colonic route, G3 group included reference compound i.e. sulfasalazine (250mg/kg), G4 group included administration of untreated test formulation, G5 included Biofield Energy Treated test formulation, G6 group denoted as Biofield Energy Treatment per se to the animals (Day -15) along with vehicle (0.5% CMC), G7 group defined as Biofield Energy Treated test formulation from day -15, G8 group included Biofield Energy Treatment per se to the animals along with Biofield Energy Treated test formulation from day -15, and G9 group animals were administered with the Biofield Energy Treatment per se (day -15) to the animals along with the untreated test formulation. 50% TNBS in ethanol was given to the entire test group except G1.
Detailed Experimental Procedure
After acclimatization, animals were randomized and grouped based on their body weight after five days. Out of total nine groups, groups G1, G2, and G6 were treated with 0.5% w/v CMC-Na in distilled water for 8 weeks (day 1 to
56). Group 2 is TNBS induced colitis group (50% TNBS in ethanol), while group 3 was treated orally with sulphasalazine (reference item) at a dose of 250mg/kg body weight for 8 weeks. The freshly prepared suspension of untreated and Biofield Energy Treated Test formulation were administered orally to the G4 and G5 groups at a dose of 130.525mg/kg for 8 weeks. Similarly, group G7 and G8 group were treated with the test formulation at a dose 130.525mg/kg from the day of Biofield Energy Treatment (day -15 to 56), while in group G9, Biofield Energy Treated animals were treated with untreated test formulation for 8weeks. Before the induction of experimental colitis, a short fasting preceded. The duration ranged from 12 to 18hours, while the chronic colitis was induced by intra-colonic administration of TNBS-50% ethanol in a total volume of 400μL, at a dose of 10mg/rat. TNBS was instilled by a suitable medical-grade polyurethane catheter for enteral feeding approximately 8 cm proximal to the anal verge. Accordingly, TNBS injection was given on day 1, 8, 15, 21, 27, 34, 40, 48, and 54. TNBS-50% ethanol was given to all the animals from G2 to G9. At the end of the experiment, blood was collected from the retro-orbital plexus using capillary tube for the estimation of CD biomarkers (CD4+, CD8+, and CD28+), hematological parameters (RBC, Hb, PCV, MCV, MCH, MCHC, platelet count, and RDW-CV). Serum was used for the estimation of biochemical parameters such as magnesium, blood urea, creatinine, uric acid, calcium, phosphorus, sodium, potassium, and chloride ions. Colon tissues were collected and fixed with neutral buffer formalin (NBF) for histopathological analysis.
Assessment of Cellular Immune Responses
Cellular immune response, such as CD4+, CD8+, and CD28+ were estimated in whole blood using Guava Flow Cytometer; EasyCyte. The mean values were calculated for each group with SEM. The percent change in the Biofield Energy Treated group was calculated compared to the vehicle treatment group.
Assessment of Hematology Parameters
Haematological parameters such as RBC, Hb, PCV, MCV, MCH, MCHC, and platelet count, and RDW-CV values were analyzed using Hematology analyzer (Abbott Model- CD-3700) in blood samples.
Assessment of Biochemical Analysis
Blood biochemistry parameters such as magnesium, blood urea, creatinine, uric acid, calcium, phosphorus, sodium, potassium, and chloride ions were analyzed using serum by Biochemistry Analyzer, Spectralab A– plus, Italy.
Gross Pathology and Histopathology Analysis
Colon tissue was fixed in NBF, embedded in paraffin sections, stained with hematoxylin and eosin, and was examined under microscope for colonic inflammation, infiltration of neutrophils, lymphocytes, plasma cells, eosinophils, and histocytes into the intestinal wall, mucosa and sub mucosa, crypt distortion, abscess, ulceration, sub- mucosal edema, and thickening of intestinal wall. All the others vital organs were isolated for gross pathological assessment. The tissues were processed using Automatic Tissue Processor and embedded in paraffin wax using Tissue Embedding System (Medimeas Instruments, Model No. MTC-TE). Sections were cut at an approximate thickness of 4 to 5microns with the help of Microtome (Leica Biosystem, Model No. RM2125 RTS, Germany) and sprayed on Flotation Work Station and collected on double frosted slide, dried at room temperature or with the slide dryer, as required. All the sections were stained manually with hematoxylin and eosin staining method.
Statistical Analysis
The data were expressed as mean ± standard error of mean (SEM) and subjected to statistical analysis using SigmaPlot (Version 11.0). For between two groups comparison Student’s t-test was performed, while multiple groups analysis one-way ANOVA was performed followed by post hoc analysis by Dunnett’s test. The p≤0.05 was considered as statistically significant (n=8).
Results and Discussion
Measurement of Cellular (CD4+, CD8+, and CD28+) Immune Responses
The novel test formulation against cellular immune response and the vital biomarkers tested were CD4+, CD8+, and CD28+ and the results in term of percentage are presented in the Figure 1 (A-C). CD4+ and CD28+ levels treated with TNBS (G2) was found to be 8% and 4.26% higher, respectively than the normal control (G1) group. In addition, the experimental groups showed the percentage of CD4+ was increased by 8.87% in the G6 (Biofield Energy Treatment per se at day -15) group as compared with the untreated test formulation (G4) group. Moreover, the level of CD8+ was increased by 2.33%, 10.12%, 13.01%, and 7.50% in the G5 (Biofield Energy Treated test formulation), G6, G7 (Biofield Energy Treated test formulation at -15 Day), and G8 (Biofield Energy Treatment per se to animals plus Biofield Energy Treated test formulation at -15 day) groups, respectively as compared to the disease control (G2) group. Group G4 and G5 showed significant (p≤0.001) increase the level of CD28+ by 15.31% and 15.50%, respectively, when compared to the G2 group, while significant decreased level of CD28+ was observed in G7 group as compared to the G2 group.
Other experimental groups showed a change as compared with the diseases control (G2) group. The T-cells has been reported to have vital role in cellular immunity, while infection can be controlled by CD4+ or T4 cells (helper cells), while on the other side capacity to kill the infected cells or cancerous cells was governed by the suppressor or killer cells (T8 cells or CD8+). These cells are the major power cells to fight any infection [38, 39]. This experimental data suggested that the Biofield Energy Healing (the Trivedi Effect®) Treatment has shown a significant improved cellular immune response in the above test groups as compared with the disease control group, which could be used against various gastrointestinal inflammatory and autoimmune disorders.
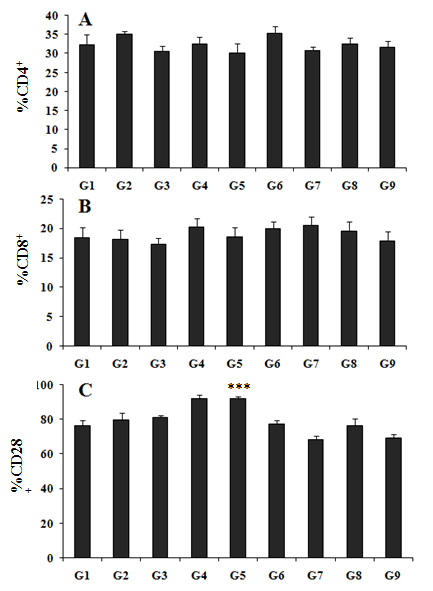
Figure 1: The effect on the cellular biomarkers in blood sample of male Sprague Dawley rats after treatment with the test formulation on various groups (G1 to G9). (A) CD4+; (B) CD8+; and (C) CD28+. G1: Normal control; G2: Disease control; G3: Sulphasalazine, 250 mg/kg; G4: Untreated test formulation; G5: Biofield Energy Treated test formulation; G6: Biofield treatment per se to animals (-15 Days); G7: Biofield Energy Treated test formulation (-15 Day); G8: Biofield Energy Treatment per se to animals plus Biofield Energy Treated test formulation (-15 day); and G9: Biofield Energy Treatment per se to animals plus untreated test formulation. All the values are represented as mean ± SEM (n=8) ***p≤0.001 vs. G2.
Hematological Analysis
Major hematological parameters were after treatment with the Biofield Energy Treated and untreated test formulation. The experimental data was presented in (Table 1), which showed the results and comparison was performed with change in percentage with disease control and untreated test formulation groups. However, all the experimental treatment groups showed altered levels compared with the G2 and G4 groups. The RBC count (106/ 𝜇L) in the Biofield Energy Treated test formulation group (G5) was slightly increased i.e. 9.38±0.09, while 9.27±0.15 in the G7 group. However, platelet count (thousand/mm3) was reported in the G5 and G7 groups by 4.15% and 8%, respectively compared with the untreated test formulation (G4) group. Therefore, the data suggested the changes in the hematological parameters in the treatment groups (G3 to G9) with respect to the tested parameters such as platelets, PCV, MCV, MCHC, hemoglobin, MCH, RDW-CV and RBC.
| Group | Hb | RBC | PCV | MCV | MCH | MCHC | Platelet Count (thousand/mm3) | RDW-CV |
|---|---|---|---|---|---|---|---|---|
| (gm/dL) | (106/L) | (%) | (fl) | (pg) | (%) | |||
| G1 | 17.00 ± 0.16 | 9.24 ± 0.19 | 43.36 ± 0.28 | 52.44 ± 0.56 | 18.45 ± 0.22 | 35.18 ± 0.11 | 1229.50 ± 38.07 | 13.30 ± 0.18 |
| G2 | 16.39 ± 0.20 | 9.40 ± 0.12 | 47.66 ± 0.59 | 50.74 ± 0.45 | 17.44 ± 0.16 | 34.38 ± 0.19 | 1464.63 ± 97.89 | 13.86 ± 0.17 |
| G3 | 16.59 ± 0.21 | 9.31 ± 0.19 | 47.64 ± 0.66 | 51.21 ± 0.60 | 17.84 ± 0.24 | 34.81 ± 0.14 | 1299.50 ± 83.46 | 13.76 ± 0.17 |
| G4 | 16.76 ± 0.31 | 9.14 ± 0.19 | 47.51 ± 0.90 | 52.01 ± 0.35 | 18.38 ± 0.12 | 35.30 ± 0.12 | 1400.63 ± 60.64 | 13.68 ± 0.17 |
| G5 | 17.19 ± 0.24 | 9.38 ± 0.09 | 48.36 ± 0.58 | 51.59 ± 0.30 | 18.33 ± 0.16 | 35.55 ± 0.13 | 1458.75 ± 102.88 | 13.81 ± 0.17 |
| G6 | 16.29 ± 0.17 | 8.86 ± 0.13 | 46.11 ± 0.51 | 52.08 ± 0.45 | 18.36 ± 0.17 | 35.29 ± 0.12 | 1405.88 ± 70.53 | 13.78 ± 0.27 |
| G7 | 16.89 ± 0.28 | 9.27 ± 0.15 | 47.88 ± 0.75 | 51.63 ± 0.51 | 18.21 ± 0.16 | 35.26 ± 0.10 | 1512.75 ± 82.22 | 13.75 ± 0.18 |
| G8 | 16.58 ± 0.37 | 9.00 ± 0.16 | 47.34 ± 0.99 | 52.59 ± 0.38 | 18.43 ± 0.10 | 35.06 ± 0.16 | 1367.00 ± 136.00 | 13.56 ± 0.34 |
| G9 | 16.94 ± 0.30 | 9.05 ± 0.16 | 47.98 ± 0.94 | 53.01 ± 0.64 | 18.74 ± 0.23 | 35.34 ± 0.15 | 1372.50 ± 82.40 | 14.30 ±0.44 |
Table 1: Hematology profile after treatment with the Biofield Energy _per se_ and Biofield Energy Treated test formulation in exp
Table 1: Hematology profile after treatment with the Biofield Energy per se and Biofield Energy Treated test formulation in experimental rats. G1: Normal control; ; G2: Disease control (50% TNBS in ethanol, (10 mg); 400 µL through intra-colonic route); G3: Sulphasalazine, 250 mg/kg; G4: Untreated test formulation; G5: Biofield Energy Treated test formulation; G6: Biofield treatment per se to animals (-15 Days); G7: Biofield Energy Treated test formulation (-15 Day); G8: Biofield Energy Treatment per se to animals plus Biofield Energy Treated test formulation (-15 Day); and G9: Biofield Energy Treatment per se to animals plus untreated test formulation. All the values are represented as mean ± SEM (n=8). RBC: Red blood cells, Hb: Haemoglobin; PCV: Packed cell volume; MCV: Mean corpuscular volume; MCH: Mean corpuscular haemoglobin; MCHC: Mean corpuscular haemoglobin concentration; RDW-CV: Red cell distribution width - coefficient of variation. All values are expressed as the mean ± SEM (n=8). Clinical manifestation of IBD includes exacerbated hematological imbalance leading to unexplained diarrhea and malena. Hematology provides an insight in the disease state of colitis. The various components of blood disproportionately altered in different treatment groups and colitis control group. Overall, the data suggested an improved haematological profile of animals suggesting significant role of the Biofield Energy Treated test formulation. The novel test formulation contained minerals and vitamins, which improved the animal hematology parameters compared with the untreated test formulation. This suggests that the novel test formulation has immunomodulatory activity that can be used effectively against various gut inflammatory and autoimmune diseases.
Biochemical Parameters
Blood biochemistry of all the animals after treatment with the test formulation showed significant alterations in the tested biochemical among all the treatment groups (G3 to G9) with respect to the magnesium, sodium, chloride, potassium, calcium and phosphorus. Besides, the level of uric acid was decreased by 40.48%, 13.69%, and 14.29% in the G6, G8, and G9 groups, respectively as compared with the G4 group. All the data of biochemistry after oral administration of the Biofield Energy Treated and untreated test formulation are presented in Table 2. Thus, role of the Trivedi Effect®- Biofield Energy Healing can be used to improve the immunity profile along with the wide range of applications in gut inflammatory diseases and its associated disorders.
| Group | Magnesium (mg/dL) | Blood Urea (mg/dL) | Creatinine (mg/dL) | Uric Acid (mg/dL) | Calcium (mg/dL) | Phosphorus (mg/dL) | Na+ (Meq/L) | K+ | Cl- |
|---|---|---|---|---|---|---|---|---|---|
| (mEq/L) | (mEq/L) | ||||||||
| G1 | 1.48 ± 0.06 | 29.89 ± 1.14 | 0.30 ± 0.00 | 0.26 ± 0.05 | 10.46 ± 0.11 | 7.21 ± 0.18 | 147.30 ± 1.03 | 4.81 ± 0.08 | 108.38 ± 0.98 |
| G2 | 1.66 ± 0.04 | 29.06 ± 1.82 | 0.30 ± 0.02 | 1.35 ± 0.50 | 11.08 ± 0.11 | 9.03 ± 0.75 | 143.60 ± 1.13 | 4.69 ± 0.10 | 104.35 ± 1.91 |
| G3 | 1.41 ± 0.10 | 25.70 ± 0.87 | 0.30 ± 0.03 | 0.75 ± 0.23 | 11.65 ± 0.08 | 9.68 ± 0.36 | 145.54 ± 0.84 | 4.76 ± 0.05 | 102.63 ± 1.19 |
| G4 | 1.86 ± 0.09 | 25.14 ± 1.05 | 0.28 ± 0.03 | 2.10 ± 0.29 | 10.95 ± 0.17 | 10.10 ± 0.60 | 143.81 ± 0.61 | 4.65 ± 0.11 | 106.25 ± 1.50 |
| G5 | 1.83 ± 0.10 | 28.13 ± 1.49 | 0.30 ± 0.00 | 2.26 ± 0.29 | 11.31 ± 0.15 | 10.35 ± 0.38 | 146.76 ± 0.63 | 4.84 ± 0.10 | 106.13 ± 1.33 |
| G6 | 1.64 ± 0.11 | 28.16 ± 0.89 | 0.31 ± 0.01 | 1.25 ± 0.29 | 10.28 ± 0.08 | 8.41 ± 0.31 | 145.85 ± 1.03 | 4.61 ± 0.18 | 108.38 ± 1.86 |
| G7 | 1.66 ± 0.09 | 35.56 ± 1.83 | 0.31 ± 0.02 | 2.14 ± 0.34 | 11.03 ± 0.15 | 10.49 ± 0.56 | 147.03 ± 1.03 | 4.70 ± 0.12 | 106.88 ± 1.25 |
| G8 | 1.71 ± 0.09 | 32.14 ± 2.08 | 0.30 ± 0.00 | 1.81 ± 0.30 | 11.15 ± 0.22 | 9.63 ± 0.52 | 147.23 ± 0.66 | 4.74 ± 0.05 | 105.75 ± 1.46 |
| G9 | 1.70 ± 0.09 | 27.81 ± 1.71 | 0.29 ± 0.01 | 1.80 ± 0.13 | 11.29 ± 0.22 | 9.65 ± 0.24 | 144.83 ± 0.71 | 4.85 ± 0.08 | 103.50 ± 0.73 |
Table 2: Estimation of animal biochemical parameters after treatment with the test formulation and Biofield Energy Treatment. G1:
Table 2: Estimation of animal biochemical parameters after treatment with the test formulation and Biofield Energy Treatment. G1: Normal control; G2: Disease control (50% TNBS in ethanol, (10mg); 400µL through intra-colonic route); G3: Sulphasalazine, 250mg/kg; G4: Untreated test formulation; G5: Biofield Energy Treated test formulation; G6: Biofield treatment per se to animals (-15 days); G7: Biofield Energy Treated test formulation (-15 day); G8: Biofield Energy Treatment per se to animals plus Biofield Energy Treated test formulation (-15 day); and G9: Biofield Energy Treatment per se to animals plus untreated test formulation. All the values are represented as mean ± SEM (n=8). RBC: Red blood cells, Hb: Haemoglobin; PCV: Packed cell volume; MCV: Mean corpuscular volume; MCH: Mean corpuscular haemoglobin; MCHC: Mean corpuscular haemoglobin concentration; RDW-CV: Red cell distribution width coefficient of variation. All values are expressed as the mean ± SEM (n = 8).
Gross and Histopathological Findings
Macroscopic evaluation of the colon after TNBS administration revealed the presence of hyperaemia, inflammation, mucosal edema and hemorrhagic ulcerations (Figure 2). To assess the severity of colonic inflammation histopathologically, histopathological score (HPS) was calculated [40, 41]. Ulceration, massive inflammatory cell infiltration, colon structure disorganization, goblet cell depletion, sub-mucosal edema and collagen deposition were found throughout the colons in the present study. The histopathologic analysis revealed Trans mural inflammation, characterized by inflammatory cell infiltration, which was associated with a thickening of the colon wall, ulcerations, loss of goblet cells and collagen deposition which were found significantly throughout the colon in the colitis control group. The HPS of the colon in rats was found to be significantly decreased in all the treatment groups except G5 group. The above findings could indicate that the Biofield Energy Treated and untreated Proprietary Product to animals ameliorates colon inflammation in the TNBS induced colitis rats by decreasing histopathological lesions.
Increased in HPS of colon in all the parameters tested were observed in colitis control group (G2), when compared to normal control (G1). However, sulphasalazine treated group showed decreased pattern of HPS in all the parameters tested except for increased collagen deposition as compared to the colitis control. Decreased in total HPS (ulceration, crypt distortion, goblet cell depletion, inflammatory cells infiltration, sub mucosal edema, hemorrhage, collagen deposition, and thickening of intestinal wall) was observed in all treatment groups except in the groups G3 and G5, when compared to G2. There was a decrease in the total HPS of colon and decrease in HPS of inflammatory cell infiltration, haemorrhage and collagen deposition in colon histopathology were observed in G6, G7, G8, and G9 group as compared to the colitis control. In addition, results with respect to various other organs of experimental animals were mostly non-specific, infrequent and minimal to moderate in nature. Moreover, the rates of occurrence of these findings recorded in the treated groups were either very low or comparable to the concurrent to the vehicle control group. Hence, all these findings in the organs other than the colon could be considered as spontaneous or incidental in nature, representing the normal physiological/metabolic or congenital changes encountered in rats of this age.
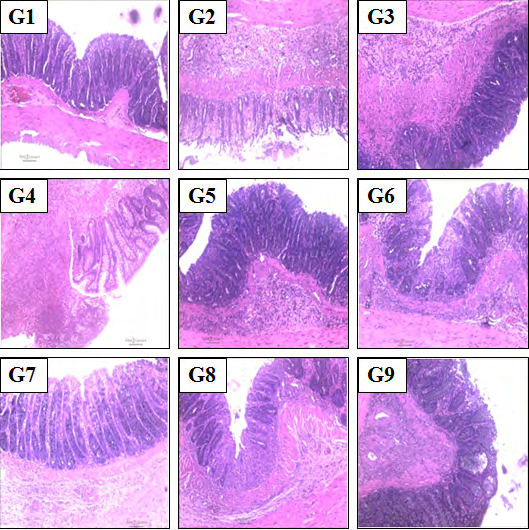
Figure 2: Representative photomicrograph of histopathology images of colon in various test groups stained with hematoxylin (H) and eosin (E). G1: Normal control; G2: Disease control (50% TNBS in ethanol, (10 mg); 400 µL through intra-colonic route); G3: Sulphasalazine, 250 mg/kg; G4: Untreated test formulation; G5: Biofield Energy Treated test formulation; G6: Biofield treatment per se to animals (-15 days); G7: Biofield Energy Treated test formulation (-15 day); G8: Biofield Energy Treatment per se to animals plus Biofield Energy Treated test formulation (-15 day); and G9: Biofield Energy Treatment per se to animals plus untreated test formulation. All the values are represented as mean ± SEM (n=8). RBC: Red blood cells, Hb: Haemoglobin; PCV: Packed cell volume; MCV: Mean corpuscular volume; MCH: Mean corpuscular haemoglobin; MCHC: Mean corpuscular haemoglobin concentration; RDW-CV: Red cell distribution width - coefficient of variation. All values are expressed as the mean ± SEM.
Overall, HPS of the colon in rats was found to be decreased in all the treatment groups except G5 group, which indicated that Biofield Energy Treated and untreated test formulation to the animals ameliorates the colon inflammation in the TNBS induced colitis rats by decreasing histopathological lesions.
Conclusion
The present experimental data of immunology with respect to gut health animal model suggested significant activity of the Biofield Energy Treated (the Trivedi Effect®) based test formulation. The cellular immune response was significantly improved along with hematological and biochemical data. The percentage of CD4+ count was increased by 8.87% in the G6 group as compared to the untreated test formulation (G4) group. Moreover, the level of CD8+ count was increased by 10.12% and 13.01% in the G6 and G7 groups, respectively as compared to the disease control (G2) group. Further, the expression of CD28+ was significantly increased by 15.50% in the G5 group compared to the G2 group. Blood profile data showed that the platelet count was increased in the G7 group by 8% compared with the G4 group. Uric acid level was decreased by 40.47%, 13.8%, and 14.28% in the G6, G8, and G9 groups, respectively as compared with the G4 group. However, animal colon and other organs histopathological findings of all the tested groups did not show any abnormal findings with respect to the safe and non-toxic treatment strategies. Histopathological score (HPS) of colon was found to be significantly decreased in all the treatment groups that suggested that the Biofield Energy Treated and untreated test formulation ameliorates the colon inflammation in the TNBS-induced colitis rats by decreasing histopathological lesions, which improve gut inflammatory conditions. Thus, the present immunological research study showed that the test formulation and the Trivedi Effect®-Biofield Energy Healing per se to the animals significantly enhanced immunomodulatory and gut health action. Therefore, the Biofield Energy Treated test formulation significantly effective as anti-inflammatory and immunomodulatory product, which can be act as a Complementary and Alternative Medicine (CAM) and would be used for various autoimmune disorders such as Systemic Lupus Erythematosus, Fibromyalgia, Aplastic Anemia, Addison Disease, Graves’ Disease, Celiac Disease (gluten- sensitive enteropathy), Dermatomyositis, Hashimoto Thyroiditis, Multiple Sclerosis, Reactive Arthritis, Vasculitis, Pernicious Anemia, Scleroderma, Type 1 Diabetes, Psoriasis, Chronic Fatigue Syndrome Myasthenia Gravis, Rheumatoid Arthritis, Sjogren Syndrome, Crohn’s Disease, Vitiligo, and Alopecia Areata, as well as inflammatory disorders such as Irritable Bowel Syndrome (IBS), Asthma, Ulcerative Colitis, Alzheimer’s Disease, Parkinson’s Disease, Dermatitis, Atherosclerosis, Hepatitis, and Diverticulitis.
Acknowledgement
The authors are gratefully acknowledged to Trivedi science, Trivedi Global, Inc., and Trivedi master wellness and to Dabur Research Foundation (DRF), India for their support.
References
-
Baxter D (2007) Active and passive immunity vaccine types excipients and licensing. Occup Med 57(8): 552- 556.
-
Vesely MD, Kershaw MH, Schreiber RD, Smyth MJ (2011) Natural innate and adaptive immunity to cancer. Annu Rev Immunol 29: 235-271.
-
Litchfield P, Cooper C, Hancock C, Watt P (2016) Work and Wellbeing in the 21st Century. International Journal of Environmental Research and Public Health 13(11): 1065.
-
Verma S, Singh SP (2008) Current and future status of herbal medicines. Vet World 1: 347-350.
-
Chauhan RS (2010) Nutrition, immunity and livestock health. Indian Cow Scient Econ J 7(24): 2-13.
-
Archana SJ, Paul R, Tiwari A (2011) Indian medicinal plants: A rich source of natural immuno-modulator. Int J Pharmacol 7(2): 198-205.
-
Fusco D, Colloca G, Monaco MRL, Cesari M (2007) Effects of antioxidant supplementation on the aging process. Clin Interv Aging 2(3): 377-387.
-
Pizzino G, Irrera N, Cucinotta M, Pallio G, Mannino F, et al. (2017) Oxidative stress: Harms and benefits for human health. Oxid Med Cell Longev 8416763.
-
Wintergerst ES, Maggini S, Hornig DH (2007) Contribution of selected vitamins and trace elements to immune function. Ann Nutr Metab 51(4): 301-323.
-
Karacabey K, Ozdemir N (2012) The effect of nutritional elements on the immune system. J Obes Wt Loss Ther 2: 152.
-
Lebish IJ, Moraski RM (1987) Mechanisms of immunomodulation by drugs. Toxicol Pathol 15(3): 338- 345.
-
Movaffaghi Z, Farsi M (2009) Biofield therapies: Biophysical basis and biological regulations. Complement Ther Clin Pract 15(1): 35-37.
-
Barnes PM, Powell-Griner E, McFann K, Nahin RL (2004) Complementary and alternative medicine use among adults: United States, 2002. Adv Data 343: 1-19.
-
Barnes PM, Bloom B, Nahin RL (2008) Complementary and alternative medicine use among adults and children: United States, 2007. Natl Health Stat Report 12: 1-23.
-
Fan K wai (2005) National center for complementary and alternative medicine website. J Med Libr Assoc 93: 410-412.
-
Trivedi MK, Tallapragada RM (2008) A transcendental to changing metal powder characteristics. Met Powder Rep 63(9): 22-28.
-
Trivedi MK, Nayak G, Patil S, Tallapragada RM, Latiyal O (2015) Studies of the atomic and crystalline characteristics of ceramic oxide nano powders after bio field treatment. Ind Eng Manage 4(3): 161.
-
Trivedi MK, Nayak G, Patil S, Tallapragada RM, Latiyal O, et al. (2015) Effect of biofield energy treatment on physical and structural properties of calcium carbide and praseodymium oxide. International Journal of Materials Science and Applications 4(6): 390-395.
-
Trivedi MK, Branton A, Trivedi D, Nayak G, Mondal SC, et al. (2015) Morphological characterization, quality, yield and DNA fingerprinting of biofield energy treated alphonso mango (_Mangifera indica_ L.). Journal of Food and Nutrition Sciences 3(6): 245-250.
-
Trivedi MK, Branton A, Trivedi D, Nayak G, Mondal SC, et al. (2015) Evaluation of biochemical marker-Glutathione and DNA fingerprinting of biofield energy treated _Oryza_ _sativa_. American Journal of BioScience 3(6): 243-248.
-
Trivedi MK, Branton A, Trivedi D, Nayak G, Charan S, et al. (2015) Phenotyping and 16S rDNA analysis after biofield treatment on _Citrobacter braakii_: A urinary pathogen. J Clin Med Genom 3(1): 129.
-
Trivedi MK, Patil S, Shettigar H, Mondal SC, Jana S (2015) Evaluation of biofield modality on viral load of Hepatitis B and C viruses. J Antivir Antiretrovir 7(3): 083-088.
-
Trivedi MK, Patil S, Shettigar H, Mondal SC, Jana S (2015) An impact of biofield treatment: Antimycobacterial susceptibility potential using BACTEC 460/MGIT-TB System. Mycobact Dis 5(4): 189.
-
Trivedi MK, Patil S, Shettigar H, Bairwa K, Jana S (2015) Phenotypic and biotypic characterization of _Klebsiella_ _oxytoca_: An impact of biofield treatment. J Microb Biochem Technol 7(4): 203-206.
-
Nayak G, Altekar N (2015) Effect of biofield treatment on plant growth and adaptation. J Environ Health Sci 1: 1-9.
-
Branton A, Jana S (2017) The influence of energy of consciousness healing treatment on low bioavailable resveratrol in male _Sprague Dawley_ rats. International Journal of Clinical and Developmental Anatomy 3(3): 9-15.
-
Branton A, Jana S (2017) The use of novel and unique biofield energy healing treatment for the improvement of poorly bioavailable compound, berberine in male _Sprague Dawley_ rats. American Journal of Clinical and Experimental Medicine 5(4): 138-144.
-
Branton A, Jana S (2017) Effect of The biofield energy healing treatment on the pharmacokinetics of 25-hydroxyvitamin D3 [25(OH)D3] in rats after a single oral dose of vitamin D3. American Journal of Pharmacology and Phytotherapy 2(1): 11-18.
-
Kinney JP, Trivedi MK, Branton A, Trivedi D, Nayak G, et al. (2017) Overall skin health potential of the biofield energy healing based herbomineral formulation using various skin parameters. American Journal of Life Sciences 5(2): 65-74.
-
Singh J, Trivedi MK, Branton A, Trivedi D, Nayak G, et al. (2017) Consciousness energy healing treatment based herbomineral formulation: A safe and effective approach for skin health. American Journal of Pharmacology and Phytotherapy 2(1): 1-10.
-
Trivedi MK, Branton A, Trivedi D, Nayak G, Plikerd WD, et al. (2017) A systematic study of the biofield energy healing treatment on physicochemical, thermal, structural, and behavioral properties of magnesium gluconate. International Journal of Bioorganic Chemistry 2(3): 135-145.
-
Trivedi MK, Branton A, Trivedi D, Nayak G, Plikerd WD, et al. (2017) Chromatographic and spectroscopic characterization of the consciousness energy healing treated _Withania somnifera_ (ashwagandha) root extract. European Journal of Biophysics 5(2): 38-47.
-
Trivedi MK, Patil S, Shettigar H, Mondal SC, Jana S (2015) The potential impact of biofield treatment on human brain tumor cells: A time-lapse video microscopy. J Integr Oncol 4(3): 141.
-
Trivedi MK, Patil S, Shettigar H, Gangwar M, Jana S (2015) _In vitro_ evaluation of biofield treatment on cancer biomarkers involved in endometrial and prostate cancer cell lines. J Cancer Sci Ther 7(8): 253-257.
-
Anagnos D, Trivedi K, Branton A, Trivedi D, Nayak G, et al. (2018) Influence of biofield treated vitamin D3 on proliferation, differentiation, and maturation of bone- related parameters in MG-63 cell-line. International Journal of Biomedical Engineering and Clinical Science 4(1): 6-14.
-
Lee AC, Trivedi K, Branton A, Trivedi D, Nayak G, et al. (2018) The potential benefits of biofield energy treated vitamin D3 on bone mineralization in human bone osteosarcoma cells (MG-63). International Journal of Nutrition and Food Sciences 7(1): 30-38.
-
Stutheit ME, Trivedi K, Branton A, Trivedi D, Nayak G, et al. (2018) Biofield energy treated vitamin D3: Therapeutic implication on bone health using osteoblasts cells. American Journal of Life Sciences 6(1): 13-21.
-
Uppal SS, Verma S, Dhot PS (2003) Normal values of CD4 and CD8 lymphocyte subsets in healthy indian adults and the effects of sex, age, ethnicity, and smoking. Cytometry B Clin Cytom 52(1): 32-36.
-
Miceli MC, Parnes JR (1991) The roles of CD4 and CD8 in T cell activation. Semin Immunol 3(3): 133-141.
-
Novak G, Parker CE, Pai RK, MacDonald JK, Feagan BG, et al. (2017) Histologic scoring indices for evaluation of disease activity in Crohn’s disease. Cochrane Database of Systematic Reviews 7(7): CD012351.
-
Gurcan MN, Boucheron LE, Can A, Madabhushi A, Rajpoot NM, et al. (2009) Histopathological image analysis: A review. IEEE Rev Biomed Eng 2: 147-171.
- Are the Vaccines the Only Solution to Prevent the COVID-19 Pandemic? Part Two
- Clinical Characteristics of Women in this New Global Immunodeficiency
- Cell Dynamics in HIV Pathogenesis: Insights and Implications
- Determination of the CDR (CDR1, CDR2) « Complementary- Determining Region Invertebrate Primitive Antibody from Sea Star »
- Prioritizing Care for High-Risk COVID-19 Patients in the EU: 10 Civic Recommendations to the Institutions
- Comprehensive Insights into ModRNA Vaccines: Persistent PP-Spike Recombinant Protein, Hyperimmune/Inflammatory Reactions, Thrombotic Vasculopathy, Chronic Organ Complications and Excess Deaths