What is the Prevalence of Persistent Symptoms in Older Adults after Covid-19 Infection? A Cohort Study
Aim: To compare the prevalence of persistent symptoms between older and younger adults infected with COVID-19 at 6-8 weeks following infection (baseline) and at 6-12 months (follow-up). Methods: A cohort study from the post-COVID service at Alfred Hospital, Melbourne, Australia. Participants completed standardized surveys at 6-8 weeks following infection (younger = 870, and older = 311), and 6-12 months later (younger = 84, and older = 37). The measurements included dyspnoea (Modified Medical Research Council Dyspnoea Scale – mMRC), fatigue (Fatigue Assessment Scale - FAS), anxiety and depression (Hospital Anxiety and Depression Scale - HADS), post-traumatic stress disorder (The Impact of Events Scale-Revised - IES-R) and quality of life (QoL) (Euroqol-5D questionnaire - EQ-5D). Results: At baseline, older adults had a lower prevalence of dyspnoea (mMRC: 21% vs. 31%, p<0.01), depression (HADS-D: 9% vs 26%, p<0.01), anxiety (HADS-A: 16% vs 36%, p<0.01), extreme fatigue (FAS: 9% vs 39%, p<0.01), post-traumatic stress (IES-R: 12% vs 27%, p<0.01) and reported better QoL (EQ-5D-5L-VAS: 69±18 vs 57±22, p<0.01) compared to younger adults, At follow-up, older adults continued to report a lower prevalence of symptoms than younger adults for anxiety (HADS-A: 17% vs 36%, p=0.03), extreme fatigue (FAS: 9% vs 44%, p<0.01), and better QoL (EQ-5D-VAS, 66±23 vs 56±21, p=0.03). Conclusion: Older adults experience fewer short-and long-term COVID-19 symptoms. Future research should focus on developing targeted interventions tailored to different age groups.
Abbreviations
NHS: National Health Service; UK: United Kingdom; MMRC: Modified Medical Research Council; SD: Standard Deviation; EQ VAS: EQ-5D-5L Visual Analogue Scale; 6MWT: 6-Minute Walk Test.
Introduction
The United Kingdom (UK) National Health Service (NHS) has defined post-COVID-19 syndrome as unexplained and persistent signs or symptoms over 12 weeks, developed during or after COVID-19 infection [1]. The current 12- week window is based on the median duration of symptoms disappearing [2]. A systematic analysis reveals that, on average, 45% of COVID-19 survivors continue to experience at least one persistent symptom after a follow-up period of 126 days. Fatigue, disrupted sleep, and shortness of breath were widely prevalent symptoms reported across hospitalized, non-hospitalized, and mixed groups. Additionally, the significant occurrence of persistent symptoms after 12 weeks highlights the need for prioritizing Long Covid care within healthcare services and policy. It is essential to comprehend the different types of Long Covid and affected populations to enable tailored healthcare and prevent potential future service overwhelm [3].
In older people, the prevalence of post-COVID-19 syndrome is approximately 9.3% and the most common symptom reported 90 days after recovery was fatigue, followed by cough and breathlessness [4, 5, 6]. In addition, according to Sathyamurthy, et al. a significant proportion of older people also had a risk of anxiety (7.5%) and depression (12.2%) 90 days after recovery and discharge from the hospital [4]. Guo, et al. showed that old patients tend to have more complications than young patients during hospitalization, but with timely and effective treatment they could also achieve comparably good outcomes as young patients [5]. According to Mansell, et al. further research specifically targeting Long Covid in older patients group is necessary. This is crucial as Long Covid should be considered in the differential diagnosis of symptoms, ensuring equitable access to multidisciplinary care interventions aimed at enhancing their functional capacity and overall quality of life [7]. Based on the significant proportion of these symptoms in older adults, it is necessary to understand the long-term consequences and the impact they have on their lives.
From this, the high prevalence of long COVID among the elderly population indicates the need for clinical attention and resource allocation for long COVID among older adults. Then, more comprehensive and prospective long-term follow- up research is needed to investigate if the natural history and patterns of recovery from COVID-19 are different in older adults when compared to younger adults and to accurately estimate the prevalence among the older population because little is known about the long-term effect of long COVID among the older population [4, 6, 8, 9]. A comprehensive understanding of patient care needs beyond the acute phase will help in the development of infrastructure for COVID-19 clinics that will be equipped to provide specialist care for older people, integrated into the outpatient setting. From this, this study aims to assess the prevalence of persistent symptoms in older adults (65 years and over) infected with COVID-19 at 6-8 weeks following infection and at 6-12 months follow-up, and to compare this to the prevalence in younger adults (aged less than 65 years).
Methods
This is a cohort study using routinely collected data from the post-COVID service at Alfred Hospital in Melbourne, Australia. All patients managed by Alfred Health for COVID-19 were invited to complete standardized surveys at 6-8 weeks following infection, and 6-12 months later. A description of the service has previously been published [10]. The study was approved by the Ethics Committee of the Alfred Hospital (66/22) and the methodology was in line with Strengthening the Reporting of Observational Studies in Epidemiology (STROBE) [11].
All patients admitted to the health service with a diagnosis of COVID-19 were identified using a standard report prepared by Alfred Health data analytics. Clinical staff in the post-COVID service use this list to contact all patients and invite them to participate in screening at 6-8 weeks following their admission. Patients included were over 18 years old, of both sexes and tested positive for COVID-19 Patients who declined the offer of follow-up from the Post COVID service or who were unable to complete screening questionnaires due to cognitive impairment or language barriers were excluded. It’s important to note that in Australia, an older adult is defined as an individual aged 65 years or older chronologically [12, 13].
All patients who agreed to receive follow-up from the post-COVID service were invited to complete standardized questionnaires via REDCap in order to identify the nature of ongoing symptoms and the services likely to be needed. Assessments and reassessments were taken place with completion of patient-reported outcomes via the REDCap system, but when patients could not access it, they were reached by phone. Routine follow-up using the same questionnaires was completed at 6-12 months after the first contact to quantify the proportion of patients with persistent symptoms.
Measurements
Dyspnea: Modified Medical Research Council Dyspnea Scale (MMRC); [14]. The mMRC is scored from 0 to 4; the higher the score, the worse the dyspnea [15]. The Global Initiative for Chronic Obstructive Lung Disease (GOLD) guidelines recommend the use of a mMRC score of 2 as the symptomatic cutoff point [16].
Fatigue: Fatigue Assessment Scale (FAS); [17, 18] Scores can vary from 10 (lowest level of fatigue) to 50 (highest level). Cut-offs were previously set: ≤ 21 indicates normal (i.e., healthy) levels of fatigue, 22-34 indicates mild-to-moderate fatigue, and ≥ 35 indicates extreme fatigue [19, 20]. The FAS is a 10-item general fatigue questionnaire to assess fatigue.
Anxiety and Depression: Hospital Anxiety and Depression Scale (HADS) questionnaire; [21, 22]. The questionnaire consists of seven questions for anxiety (questions 1, 3, 5, 7, 9, 11, and 13) and seven for depression (questions 2, 4, 6, 8, 10, 12, and 14). Responses are scored separately for anxiety and depression on a scale from 0 to 3. The maximum score is, therefore, 21 for anxiety and 21 for depression. The higher the score, the more severe the symptoms. A score ≥11 on either domain indicates probable anxiety or depression [23].
Post-traumatic stress disorder (PTSD): The Impact of Events Scale-Revised (IES-R); [24, 25]. The IES-R was used to quantify the subjective distress in response to the patients’ experience with COVID-19. IES-R is a 22-item scale scored from 0 (not at all) to 4 (extremely). Higher scores indicate worse distress. A total IES-R score ≥33 indicates that post- traumatic stress disorder’s likely presence [26].
Generic health status and quality of life: Euroqol-5D questionnaire (EQ-5D); [27, 28]. The questionnaire features five dimensions: mobility, self-care, usual activities, pain/ discomfort, and anxiety/depression.
All dimensions have five descriptors: no problems, slight problems, moderate problems, severe problems, and extreme problems, scored from 1 to 5, respectively. Higher scores are worse. EQ-5D-5L scores were also dichotomized into ‘no problem’ for scores equal to 1 or 2 and ‘moderate problem’ for scores 3, 4, and 5. At the end of the EQ-5D-5L, a visual analogue scale (EQ VAS) is available to measure the patient’s perspective on their health. The EQ VAS is numbered from 0 to 100, representing the worst and best health that the patient can imagine, respectively [29].
Physical Assessments: For patients who underwent or are still undergoing respiratory rehabilitation at Alfred Hospital, we used the data recorded at the assessment. For example, distance walked (in meters), vital signs such as blood pressure, peripheral oxygen saturation, and the submaximal heart rate achieved during the 6-minute walk test (6MWT).
Follow-up: We recorded the proportion of patients with persistent symptoms on routine follow-up at 6-12 months to identify any long-term impacts of COVID-19 or persistent symptoms after initial treatment.
Additional screening questions are in the supplementary material, and the details about the measures are according to the recently published study of our group [10].
Statistical Analysis
The results were presented in the form of means and their respective standard deviations (SD) and percentages for categorical variables or median (interquartile range), when appropriate, to describe the prevalence of symptoms in younger and older adults. The Kolmogorov-Smirnov test was used to verify the distribution of the data. Categorical variables were compared using the chi-square test and symmetrical distribution data with two measurements were compared by the unpaired Student test and the asymmetric data by the Mann-Whitney U test, when appropriate, to compare the prevalence of the symptoms between younger and older adults, respondents and non-respondents, and baseline and follow-up. All tests were two-tailed and p<0.05 was considered statistically significant.
Results
Between March 2020 and October 2023, 5471 individuals eligible through the post-COVID service were contacted and sent screening invitations (Figure 1). In total, 1181 patients returned the survey (21% of those eligible). Of these, 870 patients were younger adults (<65 years), and 311 were older adults (≥65 years). Compared to younger adults, older adults were more likely to be male and to have been hospitalized for COVID-19, and less likely to have been working prior to their infection (Table 1). After 6 to 12 months, 84 younger adults and 37 older adults responded to the follow-up.
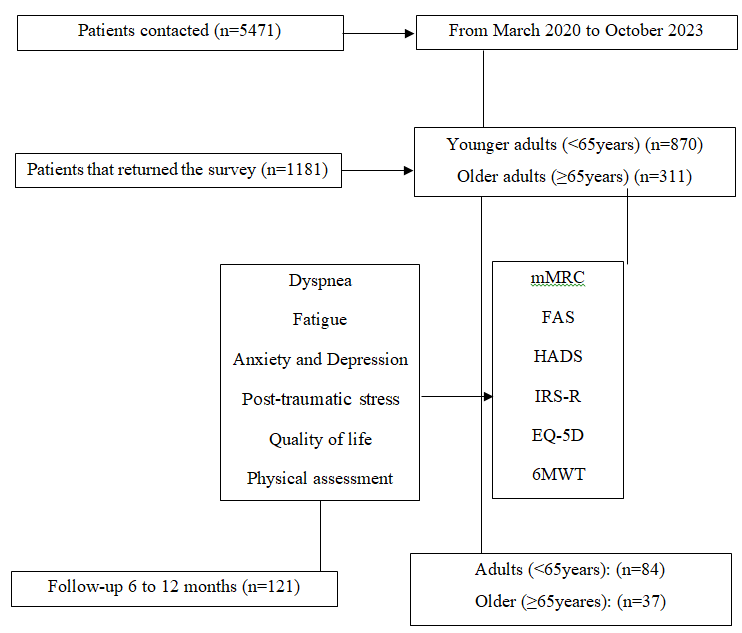
Legend: FAS: Fatigue Assessment Scale; mMRC: Modified Medical Research Council; EQ-5D: Euroqol-5D questionnaire; 6MWT: 6 meters walking test; HADS: Hospital Anxiety and Depression Scale questionnaire; IES-R: The Impact of Events Scale-Revised. Figure 1: Flowchart of the study.
Table 1 presents the prevalence and symptom comparison between younger adults and older adults at baseline. Older adults, compared to younger adults, had a lower prevalence of dyspnoea (mMRC: 21% vs. 31%, p<0.01), depression (HADS-D: 9% vs 26%, p<0.01), anxiety (HADS-A: 16% vs 36%, p<0.01), extreme fatigue (FAS: 9% vs 39%, p<0.01), and post-traumatic stress (IES-R: 12% vs 27%, p<0.01). In addition, older adults reported better quality of life compared to younger adults (EQ-5D-5L-VAS: 69±18 vs 57±22, p<0.01), and in specific domains related to usual activities (EQ-5D usual activities: 25% vs 45%, p<0.01), pain (EQ-5D pain: 29% vs 41%, p<0.01), and anxiety and depression (EQ-5D anxiety and depression: 21% vs 40%, p<0.01).
| Variables | Number of responses | All participants | N = 870 -74% | Younger adults | N = 311 -26% | Older adults | P value |
|---|---|---|---|---|---|---|---|
| Age, years | 1181 | 51±16 | 870 | 44±12 | 311 | 71±5 | <0.01 |
| Sex, female | 1179 | 721 (61%) | 868 | 557 (64%) | 311 | 164 (52%) | <0.01 |
| Hospitalized, n (%) | 676 | 584 (86%) | 564 | 480 (85%) | 112 | 104 (93%) | 0.01 |
| ICU, n (%) | 661 | 49 (7%) | 508 | 42 (8%) | 111 | 7 (6%) | 0.4 |
| Working/studying – Part- time, yes | 481 | 176 (36%) | 411 | 137 (33%) | 70 | 39 (56%) | <0.01 |
| Working/studying – Full- time, yes | 481 | 305 (63%) | 411 | 274 (67%) | 70 | 31 (44%) | <0.01 |
| Lung function test | |||||||
| FEV1, pred. (%) | 46 | 88±27 | 38 | 87±29 | 8 | 95±15 | 0.47 |
| FVC, pred. (%) | 47 | 90±28 | 38 | 88±30 | 9 | 98±13 | 0.36 |
| TLCO, pred. (%) | 28 | 97±28 | 23 | 98±26 | 5 | 94±36 | 0.75 |
| Physical Assessments | |||||||
| 6MWT, meters | 98 | 490±132 | 83 | 499±134 | 15 | 451±114 | 0.19 |
| Resting SpO 2 | 96 | 97±1.5 | 81 | 97±1.4 | 15 | 95±1.3 | <0.01 |
| Nadir SpO 2 | 98 | 94±3.4 | 83 | 94±3.3 | 15 | 91±3.4 | <0.01 |
| Resting HR | 96 | 85±13 | 81 | 86±13 | 15 | 82±13 | 0.24 |
| Endpulse HR | 97 | 113±17 | 82 | 114±16 | 15 | 107±18 | 0.13 |
| 30 STS, in seconds | 79 | 13±5.6 | 67 | 13±5.5 | 12 | 13±6.3 | 0.92 |
| Persistent symptoms | |||||||
| mMRC (Cut-off >2) | 750 | 213 (28%) | 524 | 164 (31%) | 226 | 49 (21%) | <0.01 |
| HADS – Depr. (Cut-off >11) | 737 | 155 (21%) | 517 | 134 (26%) | 220 | 21 (9%) | <0.01 |
| HADS – Anxiety (Cut-off >11) | 724 | 217 (30%) | 507 | 181 (36%) | 217 | 36 (16%) | <0.01 |
| EQ-5D Mobility (Cut-off >3) | 736 | 177 (24%) | 512 | 127 (25%) | 224 | 50 (22%) | 0.26 |
| EQ-5D Pers. care (Cut-off >3) | 739 | 45 (6%) | 514 | 36 (7%) | 225 | 9 (4%) | 0.07 |
| EQ-5D Usual act. (Cut-off >3) | 737 | 288 (39%) | 513 | 231 (45%) | 224 | 57 (25%) | <0.01 |
| EQ-5D Pain (Cut-off >3) | 735 | 279 (38%) | 512 | 213 (41%) | 223 | 66 (29%) | <0.01 |
| EQ-5D Anx./Dep. (Cut-off >3) | 736 | 254 (34%) | 512 | 207 (40%) | 224 | 47 (21%) | <0.01 |
| EQ-5D-5L - VAS | 711 | 60±21 | 494 | 57±22 | 217 | 69±18 | <0.01 |
| FAS - total, score | 721 | 28±9.8 | 503 | 30±9.6 | 218 | 23±8.2 | <0.01 |
| FAS - Physical | 729 | 15±5.1 | 506 | 16±4.9 | 223 | 12±4.3 | <0.01 |
| FAS - Mental | 725 | 12±5.2 | 506 | 14±5.3 | 219 | 10±4.2 | <0.01 |
| FAS (Cut-off >22 to 34), fatigue | 721 | 302 (42%) | 503 | 208 (41%) | 218 | 94 (43%) | 0.15 |
| FAS (Cut-off >35), extreme fatigue | 721 | 215 (30%) | 503 | 194 (39%) | 218 | 21 (9%) | <0.01 |
| IES-R TOTAL (Cut-off >33) | 658 | 152 (23%) | 463 | 127 (27%) | 195 | 25 (12%) | <0.01 |
Table 1: Prevalence and comparison of symptoms between younger adults and older adults.
Legend: 30 STS: 30-second sit-to-stand; ICU: Intensive care unit; FEV1: Forced expiratory volume in 1 second; L: litres; FVC: Forced vital capacity; TLCO: Clinical Interpretation of Transfer Factor; 6MWT: 6 minutes walking test; SpO2: Oxygen saturation; HR: Heart rate; mMRC: Modified Medical Research Council; HADS: Hospital Anxiety and Depression Scale; FAS: Fatigue Assessment Scale; EQ-5D: Euroqol-5D questionnaire; IES-R: Impact of Events Scale-Revised. Table 1: Prevalence and comparison of symptoms between younger adults and older adults.
According to Table 2, older adults reported fewer changes in memory (p<0.01), concentration (p<0.01), slowed thinking (p<0.01), heightened agitation (p<0.01), thinking difficulties (p<0.01) and fewer difficulties that affected their ability to carry out daily activities (p<0.01) compared to younger adults. Older adults reported fewer symptoms of extreme fatigue (p<0.01), depression (p<0.01), anxiety (p<0.01), pain (p<0.01), post-traumatic stress disorder (p<0.01), and limitations in usual activities (p<0.01) compared to younger adults (Table 2).
| Questions | Number of responses | All participants | N = 870 -74% | Younger adults | N = 311 -26% | Older adults | P value |
|---|---|---|---|---|---|---|---|
| Have you lost weight since your diagnosis of COVID-19, Yes | 720 | 231 (32%) | 498 | 163 (33%) | 222 | 68 (30%) | 0.32 |
| If yes, how much weight in kilograms have you lost? | 220 | 4.5±2.5 | 150 | 4.8±2.6 | 58 | 4.3±2.5 | 0.15 |
| Were you working or studying before you tested positive for COVID-19? Yes | 721 | 483 (67%) | 499 | 412 (82%) | 222 | 71 (32%) | <0.01 |
| Have you returned to work or study since your COVID-19 diagnosis? Yes | 487 | 411 (84%) | 416 | 347 (83%) | 71 | 64 (90%) | 0.09 |
| If you have returned to work or study? – Part-time | 411 | 177 (43%) | 347 | 142 (41%) | 64 | 35 (55%) | 0.02 |
| If you have returned to work or study? – Full-time | 411 | 234 (57%) | 347 | 205 (59%) | 64 | 29 (45%) | 0.02 |
| Memory changes, Yes | 703 | 407 (58%) | 483 | 306 (63%) | 220 | 101 (46%) | <0.01 |
| Concentration changes, Yes | 703 | 471 (67%) | 483 | 352 (73%) | 220 | 119 (54%) | <0.01 |
| Slowing Thinking, Yes | 702 | 463 (66%) | 482 | 343 (71%) | 220 | 120 (54%) | <0.01 |
| Heightened agitation, Yes | 699 | 337 (48%) | 482 | 263 (54%) | 217 | 74 (34%) | <0.01 |
| Thinking difficulties, Yes | 694 | 345 (49%) | 479 | 276 (57%) | 215 | 69 (32%) | <0.01 |
| Do your thinking difficulties affect your ability to undertake the day today? Yes | 340 | 269 (79%) | 272 | 225 (82%) | 68 | 44 (64%) | <0.01 |
| Getting better, Yes | 343 | 90 (26%) | 275 | 70 (25%) | 68 | 20 (29%) | 0.55 |
| Extreme Fatigue, Yes | 674 | 189 (27%) | 466 | 172 (37%) | 208 | 17 (8%) | <0.01 |
| Depression, Yes | 689 | 142 (20%) | 479 | 124 (26%) | 210 | 18 (8%) | <0.01 |
| Anxiety, Yes | 677 | 198 (29%) | 470 | 165 (35%) | 207 | 33 (15%) | <0.01 |
| PTSD, Yes | 617 | 139 (22%) | 431 | 116 (27%) | 186 | 23 (12%) | <0.01 |
| At least one symptom, Yes | 642 | 385 (60%) | 449 | 304 (67%) | 193 | 81 (42%) | <0.01 |
| Mobility limitation, Yes | 688 | 162 (23%) | 474 | 115 (24%) | 214 | 47 (22%) | 0.28 |
| Physical condition limitation, Yes | 691 | 41 (6%) | 476 | 32 (6%) | 215 | 9 (4%) | 0.12 |
| Usual activities limitation, Yes | 689 | 257 (37%) | 475 | 204 (43%) | 214 | 53 (24%) | <0.01 |
| Pain, Yes | 687 | 253 (36%) | 474 | 192 (40%) | 213 | 61 (28%) | <0.01 |
| Anxiety and depression, Yes | 688 | 232 (33%) | 474 | 188 (39%) | 214 | 44 (20%) | <0.01 |
Table 2: Comparison of the answers between younger adults and older adults.
Legend: PTSD: Post-traumatic stress disorder. Table 2: Comparison of the answers between younger adults and older adults.
The resolution of symptoms in younger adult and older adult respondents, over 6-12 months are presented in Table 3. There was a reduction in the proportion of younger adults reporting dyspnoea at 6-12 months compared to baseline (mMRC: 44% vs. 30%, p=0.04), with no changes in prevalence for other outcomes. At follow-up, older adults continued to report a lower prevalence of symptoms than younger adults for anxiety (HADS-A: 17% vs 36%, p=0.03), extreme fatigue (FAS: 9% vs 44%, p<0.01), and better quality of life (EQ- 5D-5L-VAS, 66±23 vs 56±21, p=0.03). Respondents to 6-12 month follow-up were more likely to report symptoms at baseline than those who did not respond, in both older and younger groups (Supplementary table).
| Persistent symptoms | N = 84 | Younger adults | P value | N = 37 | Older adults | P value | P value | ||
|---|---|---|---|---|---|---|---|---|---|
| Baseline | 6-12 months | Baseline | 6-12 months | 6-12 months Younger vs Older | |||||
| mMRC (Cut-off >2) | 80 | 33 (44%) | 24 (30%) | 0.04 | 35 | 11 (31%) | 10 (28%) | 0.5 | 0.53 |
| HADS – Depr. (Cut-off >11) | 78 | 26 (35%) | 24 (31%) | 0.34 | 34 | 6 (17%) | 9 (26%) | 0.25 | 0.41 |
| HADS – Anxiety (Cut-off >11) | 77 | 27 (35%) | 28 (36%) | 0.47 | 34 | 5 (15%) | 6 (17%) | 0.52 | 0.03 |
| EQ-5D Mobility (Cut-off >3) | 77 | 27 (35%) | 27 (35%) | 0.47 | 35 | 14 (40%) | 8 (23%) | 0.09 | 0.14 |
| EQ-5D Pers. care (Cut-off >3) | 78 | 8 (11%) | 13 (17%) | 0.21 | 35 | 3 (9%) | 3 (9%) | 0.66 | 0.2 |
| EQ-5D Usual act. (Cut-off >3) | 78 | 47 (63%) | 39 (50%) | 0.06 | 35 | 15 (43%) | 11 (31%) | 0.22 | 0.05 |
| EQ-5D Pain (Cut-off >3) | 78 | 38 (48%) | 36 (46%) | 0.26 | 35 | 16 (46%) | 12 (34%) | 0.23 | 0.16 |
| EQ-5D Anx./Dep. (Cut-off >3) | 78 | 33 (42%) | 35 (45%) | 0.48 | 35 | 12 (34%) | 12 (34%) | 0.59 | 0.19 |
| EQ-5D-5L - VAS | 74 | 52±20 | 56±21 | 0.32 | 35 | 68±21 | 66±23 | 0.62 | 0.03 |
| FAS - total, score | 78 | 31±10 | 31±9.5 | 0.55 | 33 | 26±10 | 26±9.1 | 0.87 | 0.01 |
| FAS - Physical | 78 | 17±5.3 | 16±5.1 | 0.64 | 34 | 14±5.1 | 13±4.7 | 0.53 | <0.01 |
| FAS - Mental | 78 | 14±5.2 | 14±5.0 | 0.5 | 33 | 12±5.5 | 12±5.0 | 0.69 | 0.18 |
| FAS (Cut-off >22 to 34), fatigue | 77 | 25 (34%) | 28 (36%) | 0.89 | 31 | 17 (49%) | 20 (64%) | 0.44 | <0.01 |
| FAS (Cut-off >35), extreme fatigue | 77 | 38 (48%) | 34 (44%) | 0.65 | 35 | 7 (20%) | 3 (9%) | 0.12 | <0.01 |
| IES-R TOTAL (Cut-off >33) | 72 | 24 (33%) | 23 (32%) | 0.36 | 27 | 8 (26%) | 8 (26%) | 0.98 | 0.51 |
Table 3: Comparison of symptoms between younger adults and older adults in baseline assessment and after 6 to 12 months of COV
Legend: mMRC: Modified Medical Research Council; HADS: Hospital Anxiety and Depression Scale; FAS: Fatigue Assessment Scale; EQ-5D: Euroqol-5D questionnaire; IES-R: Impact of Events Scale-Revised. Table 3: Comparison of symptoms between younger adults and older adults in baseline assessment and after 6 to 12 months of COVID-19 infection.
Discussion
This study reports the prevalence of persistent symptoms in older adults after COVID-19 infection. The results showed that older adults reported fewer symptoms of dyspnea, depression, anxiety, fatigue, post-traumatic stress, and demonstrated a better quality of life at 6-8 weeks following infection (baseline) compared to younger adults. Older adults also reported fewer changes in memory, concentration and thinking when compared to younger adults. When compared at 6-12 months follow-up, older adults continued to report fewer symptoms of anxiety and fatigue, and demonstrated a better quality of life compared to younger adults. There were no differences between older and younger adults for the proportion of patients reporting limitations to mobility, personal care or usual activities at 6-12 months follow-up.
Our findings suggest that older adults generally have better outcomes following COVID-19 infection than younger adults, and contrary to our expectation, experienced a lower symptom burden. These findings are similar to a systematic review [30] which reported the prevalence of symptoms by age (<60 years old and ≥60 years old), where the prevalence of some symptoms in <60 years old was higher than that in ≥60 years old, as found in our results. In older adults, the process of inflammaging, together with immunosuppression or immunosenescence, creates the perfect situation to increase the risk of poor evolution after COVID-19 infection [31, 32, 33]. However, according to current evidence, [32, 34] due to the decompensation of underlying chronic diseases that can mimic clinical manifestations of COVID-19, older adults have a different clinical presentation than younger adults, characterized by more atypical and fewer typical symptoms. In addition, symptoms of Long Covid might be difficult to distinguish from those perceived to be due to ageing, particularly in older people with comorbidities and potential side-effects from polypharmacy [7]. Shanbehzadeh, et al. [34] emphasized that persistent symptoms like fatigue and pain depend on various factors, including cognitive, physiological, and psychological aspects, rather than solely age. Sathyamurthy, et al. [4] found that most older adults retained their baseline functional status after 90 days of recovery from acute COVID-19. In this context, older age was not an independent predictor [34, 35]. These studies support the results of this study, in which, older adults reported fewer symptoms than younger adults.
The COVID-19 pandemic significantly impacted work, study, finances, socialization, and the availability of social support, even in developed countries with sophisticated infrastructure [36, 37]. These diverse factors might have influenced different age groups, potentially affecting their symptoms and well-being. For example, digital tools successfully addressed various pandemic-related challenges in which older adults, who often encounter difficulties accessing and utilizing technology, did not enjoy the same advantages as younger generations [38]. Although, according to an Australian scoping review, [39] mental health problems (i.e. psychological distress, anxiety, depression, poor well- being) increased during the COVID pandemic in young people, those with fewer socio-economic resources and those with pre-existing mental health conditions. These results support our findings, as younger adults reported more symptoms of depression, anxiety, and post-traumatic stress compared to older adults. In addition Castell-Alcalá, et al. [40] affirmed that confinement due to the COVID-19 pandemic was not associated with a worsening of physical function, cognition, depressive mood, and quality of life in pre-frail elderly individuals over 70 years of age. Wróblewska, et al. [41] concluded that the better the functional state of a senior and the support received from relatives, the lower the severity of depression and the lower the quality of a senior’s life, especially in terms of mental state, the greater the negative impact on his/her well-being in isolation. Schäfer, et al. [42] in their systematic review and meta-analysis, illustrated minor declines in mental health among older adults during the initial phases of the pandemic. These findings challenge prior assertions that older adults are uniquely susceptible to adverse mental health outcomes.
In relation to quality of life (QoL), our results showed that older adults demonstrated a better QoL at 6-8 weeks following infection (baseline) compared to younger adults, particularly in the domains of usual activities, pain (EQ- 5D pain), and anxiety and depression (EQ-5D anxiety and depression). At 6-12 months follow-up, older adults continued to demonstrate a superior QoL in comparison to younger adults and there were no differences in the proportion of patients reporting limitations to mobility, personal care or usual activities. According to Salci, et al. [43] the high level of QoL following infection was associated with white race, home ownership, fewer hours of daily screen time, lack of musculoskeletal and anxiety symptoms and no changes to work conditions. The results are in line with our study, as younger adults reported more symptoms and reduced QoL because had to reduce their working hours, and presented more pain and anxiety symptoms in comparison to older adults. In addition, Moens, et al. [44] showed that on the different dimensions of the EQ-5D, in which 89.58% of the post-COVID-19 infected persons reported some or extreme pain, 82.45% indicated some or serious limitations when performing usual activities and 42.59% indicated anxiety/depression. Self-care was preserved in most post- COVID-19 infected persons, as we found in our study. The pandemic disrupted not only social contacts of the general population, but also induced fear, stress, financial concerns, and worries about health, eventually leading to a lower QoL [44].
Strengths and Limitations
This study has several strengths. Firstly, it applied methodology in line with Strengthening the Reporting of Observational Studies in Epidemiology (STROBE) [11]. Secondly, to the best of our knowledge, this cohort study represents the first examination of persistent symptoms in older individuals following COVID-19 infection, utilizing a sample size of this magnitude and comparing populations. Thirdly, these novel results offer fresh insights into symptoms experienced by both older and younger adults and propose potential solutions tailored to these distinct populations post-pandemic.
There are limitations worth mentioning. Firstly, the absence of a control group with pre-infection information in this study reduces the certainty of establishing a causal link between symptoms before and after COVID-19 infection. Secondly, the substantial loss to follow-up in secondary analyses and the notable disparities between respondents and non-respondents pose a significant challenge to the generalizability of these findings. Thirdly, according to our results, younger and older adults who responded to the follow-up were the most symptomatic, which may have influenced the prevalence of long-term outcomes.
Implications for Research and Clinical Practice
Research evidence is just beginning to emerge regarding the persistent symptoms and their consequences in older adults with post-COVID-19. Our data suggest that older age per se does not predispose individuals to persistent symptoms, and that assessment and care should be individualized across all age groups. We recommend employing more objective measures, rather than relying solely on self-reported data, for assessing these outcomes and evaluating other symptoms, such as strength and balance. These functions hold particular importance for older adults. Furthermore, randomized clinical trials (RCTs) are needed to identify optimal treatments for post-COVID-19 symptoms in order or mitigate their persistence.
Conclusion
Older adults reported fewer symptoms of dyspnea, depression, anxiety, fatigue, and post-traumatic stress, and demonstrated a better quality of life at 6-8 weeks following COVID-19 infection compared to younger adults. When compared at 6-12 months follow-up, older adults continued to report fewer symptoms of anxiety and fatigue, and demonstrated a better quality of life compared to younger adults. Further research is needed to understand the persistent symptoms in these populations and the best strategies for treatment according to different age groups.
Declarations
Authors’ Contributions: The study was conceived by AH, MO and ABS. Data were collected by TM, MC, JBeaman, DF, LW, JBuchanan, JU, NL, CM, KF, and JBondarenko. Data were analysed by MO and AH. MO and MH wrote the manuscript. All authors critically reviewed the manuscript and approved submission of the final version. Funding Statement: This study is supported by a research grant by the Coordenação de Aperfeiçoamento de Pessoal de Nível Superior- Brasil (CAPES - 001). Conflict of Interest Disclosure: The authors reported no potential conflict of interest. Data Availability Statement: The data are not publicly available due to privacy or ethical restrictions. Ethics Approval Statement: This study was approved by the Ethics Committee of the Alfred Hospital (66/22).
References
-
National Institute for Health and Care Excellence (NICE) (2020) COVID-19 rapid guideline: managing the long- term effects of COVID-19.
-
Jimeno-Almazán A, Pallarés JG, Buendía-Romero Á, Martínez-Cava A, Franco-López F, et al. (2021) Post- covid-19 syndrome and the potential benefits of exercise. Int J Environ Res Public Health 18(10): 5329.
-
O’Mahoney LL, Routen A, Gillies C, Ekezie W, Welford A, et al. (2023) The prevalence and long-term health effects of Long Covid among hospitalised and non-hospitalised populations: A systematic review and meta-analysis. EClinicalMedicine 55: 101762.
-
Sathyamurthy P, Madhavan S, Pandurangan V (2021) Prevalence, Pattern and Functional Outcome of Post COVID-19 Syndrome in Older Adults. Cureus 13(8): e17189.
-
Guo T, Shen Q, Guo W, He W, Li J, et al. (2020) Clinical Characteristics of Elderly Patients with COVID-19 in Hunan Province, China: A Multicenter, Retrospective Study. Gerontology 66(5): 467-475.
-
Daitch V, Yelin D, Awwad M, Guaraldi G, Milić J, et al. (2022) Characteristics of long-COVID among older adults: a cross-sectional study. Int J Infect Dis 125: 287- 293.
-
Mansell V, Hall Dykgraaf S, Kidd M, Goodyear-Smith F (2022) Long COVID and older people. Lancet Heal Longev 3(12): 849-854.
-
Nalbandian A, Sehgal K, Gupta A, Madhavan MV, McGroder C, et al. (2021) Post-acute COVID-19 syndrome. Nat Med 27(4): 601-615.
-
Tosato M, Carfì A, Martis I, Pais C, Ciciarello F, et al. (2021) Prevalence and Predictors of Persistence of COVID-19 Symptoms in Older Adults: A Single-Center Study. J Am Med Dir Assoc 22(9):1840-1844.
-
Holland AE, Fineberg D, Marceau T, Chong M, Beaman J, et al. (2019) A Post COVID-19 follow-up service at a tertiary hospital in Victoria, Australia: a prospective cohort study. Med J Aust.
-
Cuschieri S (2019) The Strobe guidelines. Saudi J Anaesth 13(5): 31-34.
-
WHO (2022) Ageing and Health.
-
Orimo H (2006) Reviewing the definition of elderly. Nihon Ronen Igakkai Zasshi 43(1): 27-34.
-
Kovelis D, Segretti NO, Probst VS, Lareau SC, Brunetto AF, et al. (2008) Validation of the Modified Pulmonary Functional Status and Dyspnea Questionnaire and the Medical Research Council scale for use in Brazilian patients with chronic obstructive pulmonary disease. J Bras Pneumol 34(12): 1008-1018.
-
Mahler DA, Wells CK (1988) Evaluation of clinical methods for rating dyspnea. Chest 93(3): 580-586.
-
Vestbo J, Hurd SS, Agusti AG, Jones PW, Vogelmeier C, et al. (2013) Global strategy for the diagnosis, management, and prevention of chronic obstructive pulmonary disease GOLD executive summary. Am J Respir Crit Care Med 187(4): 347-365.
-
Vold JH, Gjestad R, Aas CF, Meland E, Johansson KA, et al. (2021) Validation of a three-item Fatigue Severity Scale for patients with substance use disorder: a cohort study from Norway for the period 2016–2020. Health Qual Life Outcomes 19(1): 1-11.
-
Lee KA, Hicks G, Murcia NG (1991) Validity and reliability of a scale to assess fatigue. Psychiatry Res 36(3): 291- 298.
-
Vries J, Michielsen H, Heck GL, Drent M (2004) Measuring fatigue in sarcoidosis: The Fatigue Assessment Scale (FAS). Br J Health Psychol 9(3): 279-291.
-
Hendriks C, Drent M, Elfferich M, Vries J (2018) The Fatigue Assessment Scale: Quality and availability in sarcoidosis and other diseases. Curr Opin Pulm Med 24(5): 495-503.
-
Herrmann C (1997) International experiences with the hospital anxiety and depression scale - A review of validation data and clinical results. J Psychosom Res 42(1): 17-41.
-
Bjelland I, Dahl AA, Haug TT, Neckelmann D (2002) the validity of the Hospital Anxiety and Depression Scale. J Psychosom Res 52(2): 69-77.
-
Zigmund AS, Snalth RP (1983) the Hospital Anxiety and Depression Scale. Acta psychiatr Scand 67(6): 361-370.
-
Braakman MH, Kortmann FAM, Brink WVD (2009) Validity of “post-traumatic stress disorder with secondary psychotic features”: A review of the evidence. Acta Psychiatr Scand 119(1): 15-24.
-
Forte G, Favieri F, Tambelli R, Casagrande M (2020) COVID-19 pandemic in the italian population: Validation of a post-traumatic stress disorder questionnaire and prevalence of PTSD symptomatology. Int J Environ Res Public Health 17(11): 1-16.
-
Christianson S, Marren J (2012) The Impact of Event Scale - Revised (IES-R). Medsurg Nurs 21(5): 321-322.
-
Hansen H, Beyer N, Frolich A, Godtfredsen N, Bieler T (2021) Inter-Day Test–Retest Reproducibility of the CAT, CCQ, HADS and EQ-5D-3L in Patients with Severe and Very Severe COPD. Patient Relat Outcome Meas 12: 117- 28.
-
Balestroni G, Bertolotti G (2015) EuroQol-5D (EQ-5D): An instrument for measuring quality of life. Monaldi Arch Chest Dis 78(3): 155-159.
-
EuroQol Research Foundation (2018) EQ-5D-3L User Guide, pp: 169-232.
-
Yang T, Yan MZ, Li X, Lau EHY (2022) Sequelae of COVID-19 among previously hospitalized patients up to 1 year after discharge: a systematic review and meta- analysis. Springer Berlin Heidelberg 50: 1067-1109.
-
Franceschi C, Bonafe M, Valensin S, Olivieri F, Luca M, et al. (2000) Inflamm-aging. An evolutionary perspective on immunosenescence. Ann N Y Acad Sci 908: 244-254.
-
Belda ABG, Garces MF, Sanchis ME, Madrazo M, Carmona M, et al. (2021) COVID-19 in older adults: What are the differences with younger patients? Geriatr Gerontol Int 21(1): 60-65.
-
Peterfi A, Meszaros A, Szarvas Z, Penzes M, Fekete M, et al. (2022) Comorbidities and increased mortality of COVID-19 among the elderly: A systematic review. Physiol Int 109(2): 163-176.
-
Shanbehzadeh S, Zanjari N, Yassin M, Yassin Z, Tavahomi M (2023) Association between long COVID, functional activity, and health-related quality of life in older adults. BMC Geriatr 23(1): 1-11.
-
Tsampasian V, Elghazaly H, Chattopadhyay R, Debski M, Naing TKP, et al. (2023) Risk Factors Associated With Post-COVID-19 Condition A Systematic Review and Meta-analysis. JAMA Intern Med 183(6): 566-580.
-
Shrestha N, Shad MY, Ulvi O, Khan MH, Karamehic MA, et al (2020) the impact of COVID-19 on globalization. One Heal 11: 100180.
-
Onyeaka H, Anumudu CK, Sharify ZT, Godswill E, Mbaegbu P (2021) COVID-19 pandemic: A review of the global lockdown and its far-reaching effects. Sci Prog 104(2): 1-18.
-
Jaarsveld MG (2020) The Effects of COVID-19 among the Elderly Population: A Case for Closing the Digital Divide. Front Psychiatry 11: 577427.
-
Zhao Y, Leach LS, Walsh E, Batterham PJ, Calear AL, et al (2022) COVID-19 and mental health in Australia – a scoping review. BMC Public 22(1): 1-13.
-
Castell MV, Barrientos R, Polentinos CE, Caballero BM, Tejera DM, et al. (2022) Evolution of physical function, cognition, depressive mood, and quality of life during the Covid-19 pandemic in prefrail elderly people: A longitudinal cohort study (Covid-Mefap). Exp Gerontol 168: 111946.
-
Wroblewska IM, Chmielewski JP, Wojciechowska M, Chmielowiec B, Starz G, et al. (2022) Impact of isolation on the bio psychosocial functioning of older people with COVID-19. Ann Agric Environ Med 29(4): 560-567.
-
Schafer SK, Lindner S, Kunzler AM, Meerpohl JJ, Lieb K (2023) The mental health impact of the COVID-19 pandemic on older adults: a systematic review and meta-analysis. Age Ageing 52(9): 1-12.
-
Salci MA, Carreira L, Baccon WC, Marques FRDM, Höring CF, et al. (2023) Perceived quality of life and associated factors in long COVID syndrome among older Brazilians: A cross-sectional study. J Clin Nurs 33(1): 178-191.
-
Moens M, Duarte RV, De Smedt A, Putman K, Callens J, et al. (2022) Health-related quality of life in persons post- COVID-19 infection in comparison to normative controls and chronic pain patients. Front Public Heal 10: 991572.
- Electrolyte Considerations for Athletes
- Comprehensive Rehabilitation in Adults with Diabetic Peripheral Neuropathy: A Literature Review on Frequency, Intensity, and Duration Parameters
- Exercise Duration and Its Association with ADHD Symptom Severity in Children and Adolescents: A Parent-Reported Survey Study
- Adaptation of the Adult Neurophysiology of Pain Questionnaire for Use in Pediatrics
- A Non-Pharmacological Multidisciplinary Pain Program within a Hospital Wellness Program: A Mixed Methods Study
- The Effect of Frenkel's Exercise with PNF on Functional Reach in Stroke Survivors: A Randomized Control Trial