Phytochemical Screening by FTIR Spectroscopic Analysis in the Methanolic Extracts Coffee (C. Arabica. L) to Seeds and Peels (Unroasted and Roasted) Cultivars Grown in Yemen
In this study methanolic extract of one plant namely Arabic coffee, were screened for the presence of analysis Constituents and tested for their of Fourier Transform infrared (FTIR) spectra. Infrared measurement techniques of methanolic extracts of Coffee (C. arabica. L) Seeds and peels (unroasted and roasted) include the following functional groups: Phenolic (O-H), Aliphatic- (CH), nitro compounds (CN), Aromatics (C = C) and Aliphatic (C-O). The FTIR method was performed on a spectrophotometer system, which was used to detect the characteristic peak values and their functional groups. The results of the present study generated the FTIR spectrum profile for the medicinally important plants of Arabic coffee can be used in the industry.
Introduction
Coffee is one of the most widely drunk beverages in the world, and is a very important source of foreign exchange income for many countries. More than 125 million people in the coffee growing areas worldwide derive their income directly or indirectly from its products [1, 2]. It ranks second after oil in international trade and has created several million jobs in the producer and consumer countries where more than nine million tons of green beans are produced annually [3]. The band of C-N functional groups are 1641 cm–1, 1640 cm–1, and 1642 cm–1. Chlorogenic acid is the main phenol compound found in coffee. Chlorogenic acid was indicated by functional groups of O-H, C = O and C-C. They were appeared at 3000 cm–1, 1700 cm–1, and 1200 cm-1, respectively. The presence of trigonelline compounds is explained by the bond of C-N, C = O, and O-H at 1400 cm–1, 1700 cm–1, and 3000 cm–1, respectively [4]. According to Akbar, et al. The samples have similarities in functional groups that contained O-H (3400 cm-1), C-H aromatic (2900 cm-1), C-H aliphatic (2800 cm-1), C=C (1640 cm-1), C=C aromatic (1550 cm-1), and C-H alkanes (1450 cm-1).
Matter and Method
Fourier Transform infrared (FTIR) Analysis
Study setting: The studies on the FTIR spectra of the selected of the methanol extract Coffee (C. arabica. L) Seeds and peels (roasted and unroasted) were obtained from the Modern and Global Pharm of the Research and Development Center Sana’a.
Determination of Function Groups by Fourier Transform infrared (FTIR) Assay
IR spectra of Coffee (C. arabica. L) Seeds and peels (roasted and unroasted) methanol extract (10 mg) was mixed uniformly with 100 mg were taken to determine their functional groups. A portion of the powdered plant extract was with potassium Bromide (KBr) salt (1% w/w), in order to prepare translucent sample discs, and then pressed into a disc before analysis. The powder was compressed into a thin pellet using KBr press. Pellets were placed in the Perkin- Elmer FT-IR spectrometer (410, Jasco, Japan) compartment and scanned the IR region between 4000 to 500 cm-1 [5].
Results and Discussion
Determination of Function Groups by Fourier Transform infrared (FTIR) Assay
The FTIR Spectra were recorded in regions below 1200,500 cm−1 (the fingerprint region). FTIR results showed the presence of functional groups of various phytochemicals. Phenolic, alkanes, carboxylic acid, carbonyl, alkenes, ketones, aromatics, respectively in the Selected of the methanol extract Coffee (C. arabica. L) Peels and Seeds (unroasted and roasted) which may be responsible for various pharmacological activities. These phytochemicals have various functional groups like O-H, C-H, CºN, C=C and C-O.
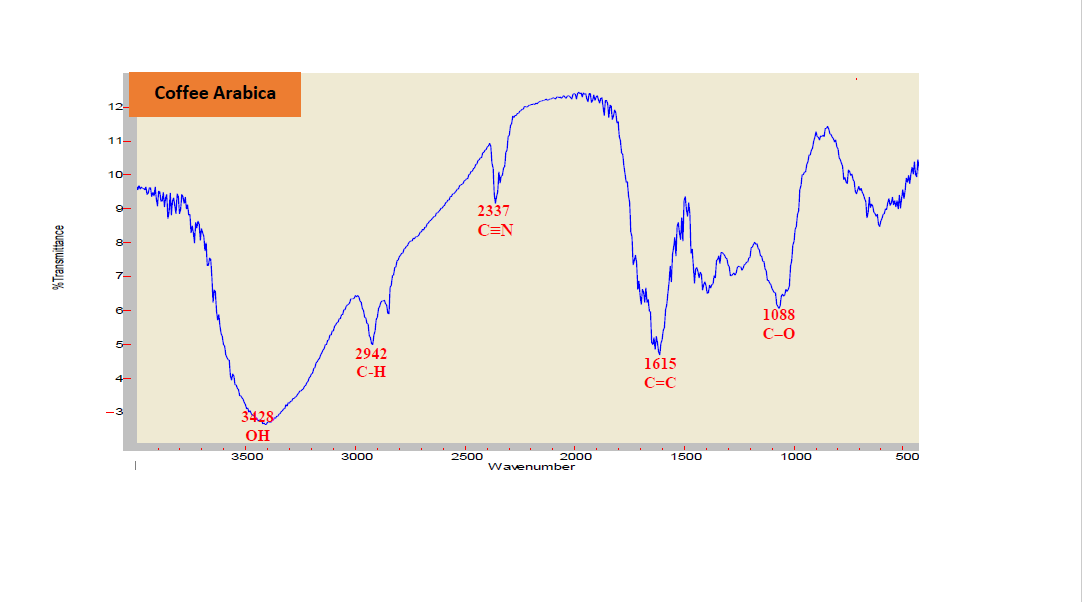
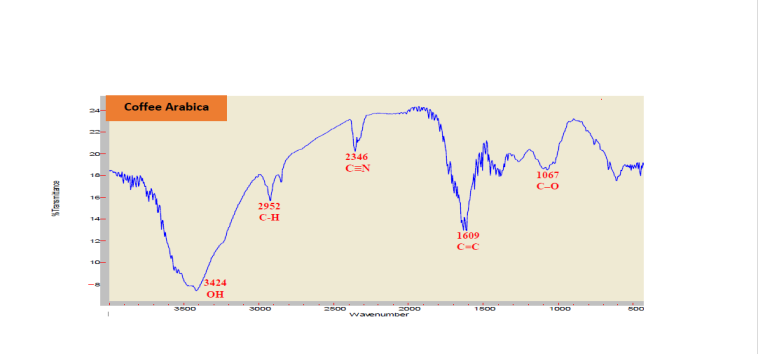
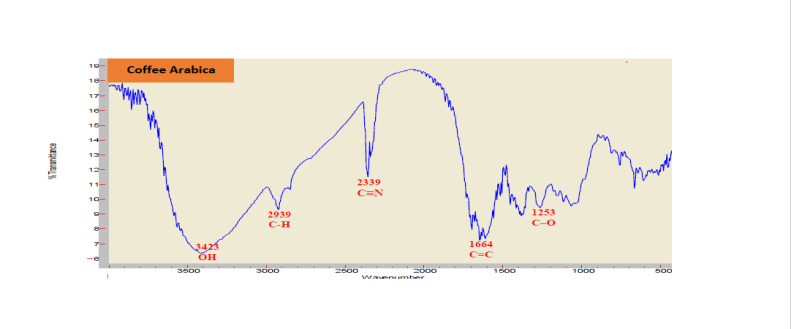
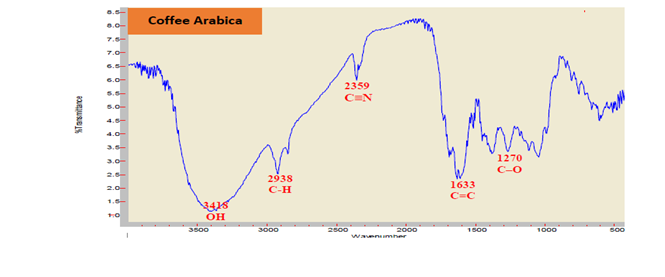
Figures (1-6) and Tables (1,2) five function groups were found (Phenolic-O-H, Aliphatic -C-H, Nitrile- CºN, aromatics- C=C and Aliphatic C-O groups) were detected in the Coffee (C. arabica. L) Peels and Seeds (unroasted), shows the ATR- FTIR spectra of the studied coffee blends at frequency region of 4000–500 cm-1. The strong absorbency for primary and secondary was shown at the peak 3423 to 3438 cm-1 also show that at the wave number (2930-2952), (2339-2360) (1609-1753) (1067-1252) represented the major functional groups of Phenolic, Aliphatic, Nitriles, aromatics, Aliphatic, respectively.
The IR band between 3200 and 3500cm-1 are due to O-H stretching Vibrations, so each extract contain phenolic- O-H. The IR band at 2930-2952cm-1 is stretching of an aliphatic compound group C-H, so extract contain C-H group. The band CºN is between 2339-2360 cm-1 are due to Nitriles, so each extract contains CºN group. The band C=C at 1609-1753cm-1 are due to aromatics, so each extract contains C=C group, and The band C-O at 1067-1252cm-1 are due to aliphatic group.
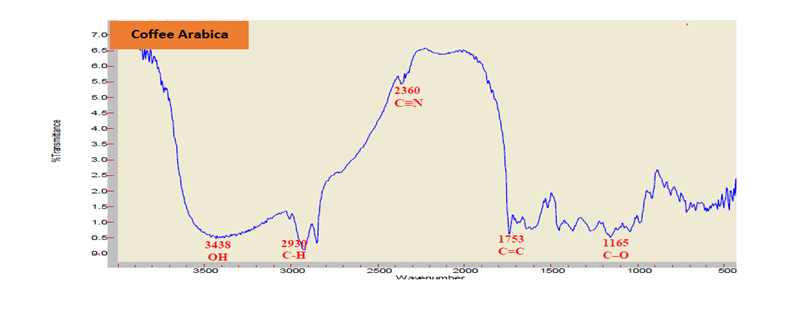
| The Functional Groups | IR.Wavenumber (CM- 1) of the methanol sample extract Coffee (C. arabica .L) peels (unroasted) Udaini ALMahweet (Hufash). | IR.Wavenumber (CM-1) of the methanol sample extract Coffee (C. arabica .L) peels (unroasted) Udaini Ibb (Kafr). | IR.Wavenumber(CM-1) of the methanol sample extract Coffee (C. arabica .L) peels (unroasted) Udaini Sana’a (Haraz). |
|---|---|---|---|
| Phenolic- O-H (Stretching) | 3438 CM-1(medium intensity) | 3428 CM-1 (strong intensity) | 3424 CM-1 (strong intensity) |
| Aliphatic- C-H (Stretching) | 2930 CM-1 (medium intensity) | 2942 CM-1 (medium intensity) | 2952 CM-1 (medium intensity) |
| Nitriles- CºN (Stretching) | 2360 CM-1 (weak intensity) | 2337 CM-1 (weak intensity) | 2346 CM-1(weak intensity) |
| Aromatics- C=C (Stretching) | 1753 CM-1 (medium intensity) | 1615 CM-1 (medium intensity) | 1609CM-1 (medium intensity) |
| Aliphatic- C-O (Stretching) | 1165 CM-1 (medium intensity) | 1088 CM-1 (medium intensity) | 1067 CM-1 (medium intensity) |
Table 1: FT-IR Technique: FT-IR spectrum of the methanol extract Coffee (C. arabica. L) Peels (unroasted).
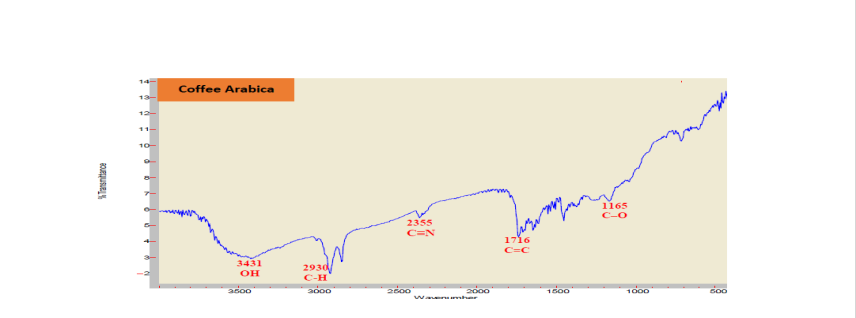
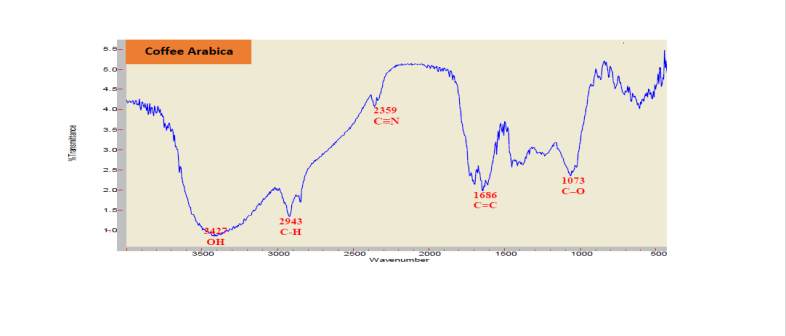
| The Functional Groups | IR.Wavenumber (CM-1) of the methanol sample extract Coffee (C. arabica .L) Seeds (unroasted) Udaini ALMahweet (Hufash). | IR.Wavenumber (CM-1) of the methanol sample extract Coffee (C. arabica .L) Seeds (unroasted) Udaini Ibb (Kafr). | IR.Wavenumber (CM-1) of the methanol sample extract Coffee (C. arabica .L) Seeds (unroasted) Udaini Sana’a (Haraz). |
|---|---|---|---|
| Phenolic- O-H (Stretching) | 3431 CM-1(medium intensity) | 3427 CM-1(strong intensity) | 3423 CM-1(strong intensity) |
| Aliphatic- C-H (Stretching) | 2930 CM-1 (strong intensity) | 2943 CM-1 (medium intensity) | 2939CM-1(medium intensity) |
| Nitriles- CºN (Stretching) | 2355 CM-1 (medium intensity) | 2359 CM-1(weak intensity) | 2339CM-1( (medium intensity |
| Aromatics- C=C (Stretching) | 1716 CM-1(medium intensity) | 1686 CM-1(medium intensity) | 1664 CM-1(strong intensity) |
| Aliphatic- C-O (Stretching) | 1165 CM-1(medium intensity) | 1073 CM-1(medium intensity) | 1252CM-1(medium intensity) |
Table 2: FT-IR Technique: FT-IR spectrum of the methanol extract Coffee (C. arabica. L) Seeds (unroasted).
A similar investigation done by Heneczkowski M, et al. [6], the green coffee spectrum shows functional groups characteristic of cellulose, hemicellulose and lignin (3680– 2950 cm−1-OH stretching; 2960–2860 cm−1 - C-H stretching; 1470–1430 cm−1-O-CH3; 1090–970 cm−1-C-O-C). Alkyl, aliphatic and aromatic compounds are visible in the range of 1730–1700 cm−1, while 900–700 cm−1 corresponds to C-H stretching from aromatic hydrogen compounds. According to Terouzi W, et al. [7] the ranges 1612–1598 cm−1, 1570– 1560 cm−1 and 1488–1452 cm−1 are typical for the aromatic ring vibration. Another specific bands corresponding to the phenol group vibrations are C-OH deformation vibrations (1370–1308 cm−1), C-OH stretching vibrations (1172–1112 cm−1) and, in the case of sulfonic derivatives, vibrations are related to those substituents in ranges 1188–1180 cm−1.
Similarly, Terouzi W and Oussama A [8] the peak at 3008 cm-1 could be assigned to the functional group (trans =C–H stretch), and strong bands between 1750 and 1650cm-1 arising from the stretching vibration of the ester carbonyl functional groups of the triglycerides. The band of the aromatic ring stretch of the lignin appears at 1604 cm-1. Figures (7-12) and Tables (3,4) five function groups were found (Phenolic-O-H, Aliphatic -C-H, Nitrile- CºN aromatics- C=C and Aliphatic C-O groups) were detected in the Coffee (C. arabica. L) Peels and Seeds (roasted), shows the ATR- FTIR spectra of the studied coffee blends at frequency region of 4000–500 cm-1. The strong absorbency for primary and secondary was shown at the peak 3398-3421 cm-1, also show that at the wave number (2929-2946) (2357-2385)
(1615-1744) (1075-1270) represented the major functional groups of Phenolic, Aliphatic, Nitriles, aromatics, Aliphatic, respectively.
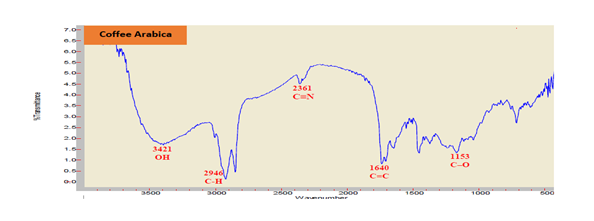
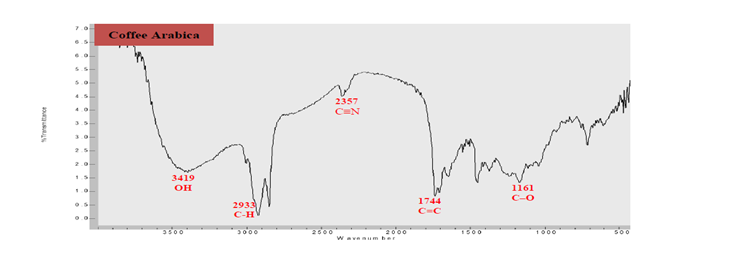
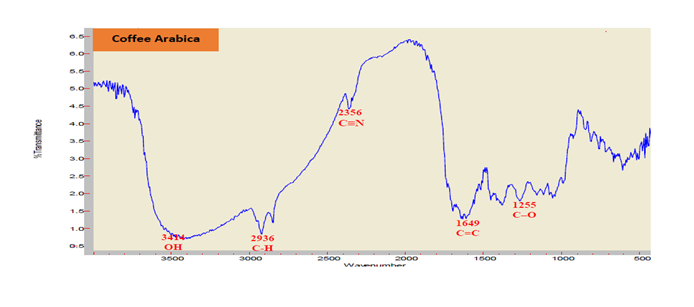
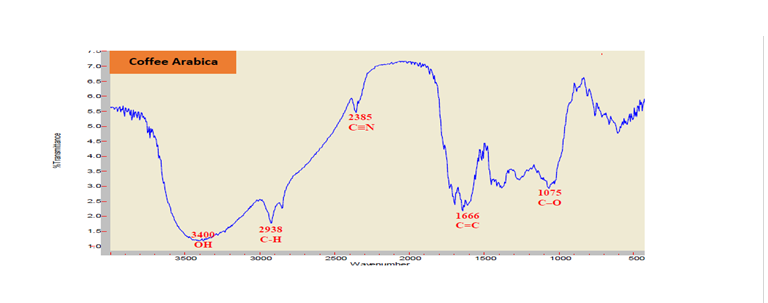
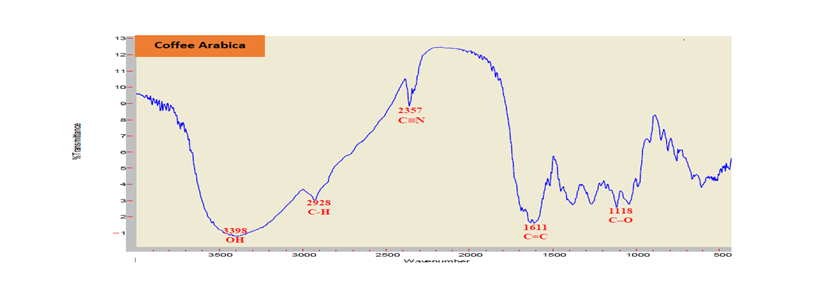
The IR band between 3200 and 3500cm-1 are due to O-H stretching Vibrations, so each extract contain phenolic- O-H. The IR band at 2929-2946cm-1 is stretching of an aliphatic compound group C-H, so extract contain C-H group. The band CºN is between 2357-2385cm-1 are due to Nitriles, so each extract contains CºN group. The band C=C at 1615-1744cm-1 are due to aromatics, so each extract contains C=C group, and The band C-O at 1075-1270 cm-1 are due to aliphatic group.
A similar investigation done Chen Y, et al. [4], Analysis using FTIR for green, roasted Liberica at 200 °C and 230 °C Liberica coffee bean has been carried out. Carbohydrates showed in an extensive feature in areas between 900 cm–1 to 1 200 cm–1 as a result of the vibration of C-O stretching on C-O-H bonds such as glyosidic bonds and related to polysaccharide sugars. The carbonyl bond (C = O) appears at1735 cm–1 and 1733 cm–1. Amel E. The FT–IR spectra of the cotton fabrics dyed with the Coffee extract displayed similar absorption bands at 3500 to 3900 cm−1 peaks corresponding to the (–OH) stretch. However, new peaks at 1100 cm−1 and 1500 to 1800 cm−1 were observed in the spectra of the cotton fabrics dyed with the Coffee extract [9, 10, 11, 12, 13].
| IR.Wavenumber (CM-1) of the methanol sample extract Coffee (C. arabica .L) peels (roasted) Udaini ALMahweet (Hufash). | IR.Wavenumber (CM-1) of the methanol sample extract Coffee (C. arabica .L) peels (roasted) Udaini Ibb (Kafr). | |||
|---|---|---|---|---|
| Phenolic-O-H (Stretching) | 3421 CM-1 (medium intensity) | 3418 CM-1 (strong intensity) | ||
| Aliphatic-CH (Stretching) | 2946 CM-1 (strong intensity) | 3400CM-1 (strong intensity) | ||
| Nitriles- CºN (Stretching) | 2361 CM-1 (weak intensity) | 2938 CM-1 (strong intensity) | ||
| Aromatics C=C (Stretching) | 1640 CM-1 (strong intensity) | 1666 CM-1 (strong intensity) | ||
| Aliphatic C-O (Stretching) | 1153 CM-1 (medium intensity) | 1075 CM-1 (medium intensity) | ||
| The Functional Group | IR.Wavenumber (CM-1) of the methanol sample extract Coffee (C. arabica .L) Seeds (roasted) Udaini ALMahweet (Hufash). | IR.Wavenumber (CM-1) of the methanol sample extract Coffee (C. arabica .L) Seeds (roasted) Udaini Ibb (Kafr). | IR.Wavenumber (CM-1) of the methanol sample extract Coffee (C. arabica .L) Seeds (roasted) Udaini Sana’a Haraz). | |
| Phenolic-O-H (Stretching) | 3419 CM-1 (medium intensity) | 3414 CM-1 (strong intensity) | ||
| Aliphatic-CH (Stretching) | 2933 CM-1 (strong intensity) | 2936 CM-1 (strong intensity) | ||
| Nitriles- CºN Stretching) | 2357 CM-1 (weak intensity) | 2356 CM-1 (weak intensity) | ||
| Aromatics C=C (Stretching) | 1744 CM-1 (strong intensity) | 1649 CM-1 (strong intensity) | ||
| Aliphatic C-O (Stretching) | 1161 CM-1 (medium intensity) | 1255 CM-1 (medium intensity) |
Table 3: FT-IR Technique: FT-IR spectrum of the methanol extract Coffee (C. arabica. L) Peels (roasted).
Conclusion
In view of the aforementioned, the objective of the present study was to evaluate the potential of FTIR spectra show the absorption of typical functional groups of methanol extract Coffee (C. arabica. L) Seeds and peels (roasted and unroasted), namely Phenolic-O-H, Aliphatic -C-H, Nitrile- CºN, aromatics-C=C and Aliphatic C-O groups as reported in other food products, indicating that the Coffee (C. arabica. L) Roasted and unroasted is a matrix rich in biomolecules, with great potential in the food industry. These results allowed us to conclude that the FTIR technique facilitates quick identification of the chemical composition of Coffee (C. arabica. L) Roasted and unroasted from different varieties, and shows small differences in their absorbance peaks with methanol extract Coffee (C. arabica. L) Seeds and peels (roasted and unroasted) .We found that the variety presented lower contents of the chemical compounds according to the analyzed spectrum.
References
-
Lashermes P, Combes MC, Ansaldi C, Gichuru E, Noir S (2011) Analysis of alien introgression in coffee tree (Coffee arabica L.). Molecular breeding 27(2): 223- 232.
-
Mishra MK, Slater A (2012) Recent Advances in the Genetic Transformation of Coffee. Biotechnol Res Int 580857.
-
ICO (2016) Sustainability of the coffee sector in Africa. 117th session of the Council, London, United Kingdom.
-
Chen Y, Xie MY, Yan Y, Zhu SB, Nie SP, et al. (2008) Discrimination of Ganoderma lucidum according to Geographical origin with near infrared diffuse reflectance Spectroscopy and pattern recognition techniques. Analytica Chemical Acta 618(2): 121-130.
-
Masek A, Latos-Brozio M, Kałużna-Czaplińska J, Rosiak A, Chrzescijanska E (2020) Antioxidant Properties of Green Coffee Extract. Forests 11(5).
-
Heneczkowski M, Kopacz M, Nowak D, Kuźniar A (2001) Infrared spectrum analysis of some flavonoids. Acta Pol Pharm 58(6): 415-420.
-
Terouzi W, Oussama A (2016) Mid-infrared spectroscopy and chemometrictools applied to quantification of adulteration in Arabica coffee by addition of roasted barley. International Journal of Engineering Research and Management (IJERM) 3(7): 1-5.
-
Heriyanti H, Panggabean Y, Pangestu ET, Asyhar R, Sutrisno S (2019) Initial Roasting Temperature Effect on Thermal Behavior and Characteristic of Liberica Coffee 14(4).
-
AElabid AE, A Mahajoub IE, Ahmed MA (2021) Mechanisms and Functional Properties of Colored Coffee Compounds Dyed Cotton Fabrics. International Journal of Textile Science 10(1): 7-20.
-
Idroes AR, Ginting B, Karma T, Rahimah S, Helwani Z, et al. (2021) Identification of Gayo Arabic coffee beans and powder using the FTIR-PCA combination method. IOP Conf Series: Materials Science and Engineering 1087- 012059.
-
Eloy Diasa RC, Valderramab P, Marçob PH, dos Santos Scholzc MB, Edelmanna M, et al. (2018) Quantitative assessment of specific defects in roasted ground coffee via infrared-photoacoustic spectroscopy food chemistry 255: 132-138.
-
Redgwell RJ, Trovato V, Curti D, Fischer M (2002) Effect of roasting on degradation and strucutural features of polysaccharides in Arabica coffee beans. Carbohydrate Research 337(5): 421-431.
-
Rodriguez YFB, Guzman NG, Hernandez JG (2020) Effect of the Postharvest Processing Method on the Biochemical Composition and Sensory Analysis of Arabica Coffee. Eng agríc 40(2).
- Effects of 5-HTP and Melatonin on the Sleep Cycle of Medical Students
- Adsorption of Bisphenol A on NH4OH- Modified Rice Husk and Sugar Cane Bagasse Biochar
- Comparative Assessment of the Reinforcement Efficiency of Palm Fruit Fibre and Coconut Fibre in High Density Polyethylene (HDPE) Matrix Composite
- Importance of Bio Compounds Naturally Present in Food with Functionality in Animal Metabolism
- Sub-Acute Study on the Cardiotoxic Effects of Monosodium Glutamate Ingestion in Albino Rat
- Weight Management and Its Natural Solutions: A Review