Identification of Hub Genes and Pathways in Cervical Cancer by Statistical and Bioinformatics Analysis
Introduction
Cervical cancer is one of the common malignancies in women worldwide. Exploration of pathogenesis and molecular mechanism of cervical cancer is pivotal for development of effective treatment for this disease. There are several research try to find the key gene and pathways of cervical cancer for development diagnosis of this disease Previous studies revealed that identified thirteen key genes as the intersecting genes of the enrichment pathways and the top 20 nodes in PPI network [1]. Survival analysis revealed that high mRNA expression of MCM2, PCNA, and RFC4 was significantly associated with longer overall survival, and the survival was significantly better in the low-expression RRM2 group. According to a study in Daniel S, et al. [2] investigate the key pathways and genes in the progression of cervical cancer. The gene expression profiles GSE7803 and GSE63514 were obtained from the Gene Expression Omnibus database. Differentially expressed genes (DEGs)
were identified using GEO2R and the limma package, and Gene Ontology (GO) and Kyoto Encyclopedia of Genes and Genomes (KEGG) enrichment analyses were conducted using the Database for Annotation, Visualization and Integrated Discovery. The PPI network identified 4 key genes (PCNA, CDK2, VEGFA and PIK3CA), which were hub genes for preinvasive and invasive cervical cancer. In conclusion, bioinformatics analysis identified 4 key genes in cervical cancer progression (PCNA, CDK2, VEGFA and PIK3CA), which may be potential biomarkers for differentiating normal cervical epithelial tissue from cervical cancer. Another study in Doulah MSU [3] identifies key genes and pathways and illuminates new molecular mechanisms underlying cervical cancer. Thy found top 9 hub genes with a high degree of connectivity (over 72 in the PPI network) were down- regulated TSPO, CCND1, and FOS and up-regulated CDK1, TOP2A, CCNB1, PCNA, BIRC5 and MAD2L1. Module analysis indicated that the top 3 modules were significantly enriched in mitotic cell cycle, DNA replication and regulation of cell cycle (P < 0.01). In Gaudet P, et al. [4] performed pathway analysis in order to improve current knowledge on the molecular drivers of cervical cancer and detect potential targets for treatment. They used three publicly available Affymetrix gene expression data-sets (GSE5787, GSE7803, GSE9750), From PPI-network they found 5 signaling modules associated with MYC signaling (Module 1), cell cycle deregulation (Module 2), TGFβ-signaling (Module 3), MAPK signaling (Module 4) and chromatin modeling (Module 5). Potential targets for treatment which could be identified were CDK1, CDK2, ABL1, ATM, AKT1, MAPK1, and MAPK3 among others. In Hanukoglu I [5] determine the genes associated with cervical cancer development. They identified that DPP4, EDN3, FGF14, TAC1 and WNT16 involved in the pathogenesis of cervical cancer. They used Microarray data (GSE55940 and GSE46306) from Gene Expression Omnibus. In Jaakkola MK, et al. [6] found seven key genes- DTL, HMGB3, KIF2C, NEK2 and RFC4. They used three publicly available Affymetrix gene expression data sets (GSE5787, GSE7803, GSE9750), vouching for a total 9 cervical cancer cell lines, 39 normal cervical samples, 7 CIN3 samples and 111 cervical cancer samples.
Materials and Methods
Microarray Data
In this study the dataset GSE7803 of cervical cancer was used. The GSE7803 included 10 normal cervix samples and 21 cervical cancer samples, each from different patients, were each assayed on single HG_U133A arrays and 22,284 genes. The targeted gene expression dataset GSE7803 was downloaded from the Gene Expression Omnibus (GEO, http://www.ncbi.nlm.nih.gov/geo/) database of NCBI. GSE7803, submitted by Joyce AP, et al. [7], based on the GPL96 platform ([HG-U133A] Affymetrix Human Genome U133A Array).
Data Processing and Identification of Differentially Expressed Genes
First the data are normalized by Doulah MSU [8] i. Min-Max scaling: Subtract the minimum value and divide by the range (i.e., maximum value - minimum value) of each column and, ii. Standardization scaling: Subtract the mean and divide by the standard deviation of each column. We have cheeked the outliers in the dataset. Outlier is a data point that consists of an extreme value on the variables. Although outliers are considered an error or noise, they may carry important information [9]. Detected outliers are candidates for aberrant data that may otherwise; adversely lead to model specification, biased parameter estimation and incorrect results. It is therefore paramount to identify them before modeling and analysis. Then using a number of outlier detection methods of Doulah MSU, et al. [10], we find there is no outlier in the sample.
Then applying expressed robust t statistics (ERT) methods to identify differentially express genes. Various statistical methods of Doulah MSU [11, 12] were used for significance analysis of DEGs, these statistical methods are shown in the following Table 1 below-
| Tests Name | Statistics | Description |
|---|---|---|
| Students t test | $t = \frac{\bar{x}_1 - \bar{x}_2}{s\sqrt{\frac{1}{n_1} + \frac{1}{n_2}}}$ | $s_1^2 = \frac{(x_i - \bar{x}_1)^2}{n_1 - 1},\ s_2^2 = \frac{(x_i - \bar{x}_2)^2}{n_2 - 1},$$s = \sqrt{\frac{(n_1 - 1)s_1^2 + (n_2 - 2)s_2^2}{n_1 + n_2 - 2}}$$dF = n_1 + n_2 - 2$ |
| Welch t test | $t_w = \frac{\bar{x}_1 - \bar{x}_2}{\sqrt{\frac{s_1^2}{n_1} + \frac{s_2^2}{n_2}}}$ | $s_1^2 = \frac{(x_i - \bar{x}_1)^2}{n_1 - 1},\ s_2^2 = \frac{(x_i - \bar{x}_2)^2}{n_2 - 1},$$dF = \frac{(\frac{s_1^2}{n_1} + \frac{s_2^2}{n_2})}{\frac{(s_1^2}{n_1} + \frac{s_2^2}{n_2})^2}$ |
| F test | $F = \frac{s_1^2}{s_2^2}$ | $s_1^2 = \frac{(x_i - \bar{x}_1)^2}{n_1 - 1},\ s_2^2 = \frac{(x_i - \bar{x}_2)^2}{n_2 - 1},\ dF = n_1 + n_2 - 2$ |
| Likelihood ratio test | $LRT = -2\log_e(\frac{\bar{x}_1}{\bar{x}_2})$$LRT = -2\log_e(\bar{x}_1) + 2\log_e(\bar{x}_2)$ | $dF = n_1 + n_2 - 2$ |
| Hochberg and Benjamini test | $\left(\frac{i}{m}\right)Q$ | i = the individual p-value's rank,m = total number of tests,Q = the false discovery rate (a percentage, chosen by you). |
Table 1: Summary of Statistical Methods.
Evaluation Criteria for Finding Pathways and Hub Genes
The hub genes were identified by Gene Ontology (GO) and KEGG pathway enrichment analysis of DEGs and from module analysis of protein-protein interaction (PPI) network.
Gene Ontology (GO) Enrichment Analysis of DEGs
GO term enrichment analysis was conducted by the DAVID functional annotation tool to excavate DEG function and biological significance. The Gene Ontology Consortium is the set of biological databases and research groups actively involved in the gene ontology project. This includes a number of model organism databases and multi-species protein databases, software development groups, and a dedicated editorial office. Whereas gene nomenclature focuses on gene and gene products, the Gene Ontology focuses on the function of the genes and gene products. There is no universal standard terminology in biology and related domains, and term usages may be specific to a species, research area or even a particular research group Wu K, et al. [13]. This makes communication and sharing of data more difficult. The Gene Ontology project provides ontology of defined terms representing gene product properties. The ontology covers three domains:
- Cellular component: cellular component, the parts of a cell or its extracellular environment;
- Molecular function: molecular function, the elemental activities of a gene product at the molecular level, such as binding or catalysis;
- Biological process: biological process, operations or sets of molecular events with a defined beginning and end, pertinent to the functioning of integrated living units: cells, tissues, organs, and organisms.
KEGG (Kyoto Encyclopedia of Genes and Genomes) Pathway Enrichment Analysis of DEGs
GO analysis and Kyoto Encyclopedia of Genes and Genomes (KEGG; www.genome.jp/kegg/pathway.html) pathway analysis were conducted to identify DEGs at the biologically functional level [14]. The Database for Annotation, Visualization, and Integrated Discovery (DAVID; david.abcc.ncifcrf.gov) was used to integrate functional genomic annotations [15]. P<0.05 was considered to indicate a statistically significant difference [16].
Construction of DC Network and Pruning by PPIs
To identify DC gene pairs between GC-sensitive and GC-resistant groups, a DC network was constructed using the DiffCorr R package [17]. Pearson’s correlation coefficient was used for calculating the co-expression between gene pairs under conditions A (resistant) and B (sensitive) separately. Pearson’s correlation coefficient between genes x and y under condition A is defined as
$$r_A(x,y) = \frac{\sum (x_k - \bar{x})(y_k - \bar{y})}{\sqrt{(x_k - \bar{x})^2 (y_k - \bar{y})^2}}$$
where $\bar{x}$ and $\bar{y}$ are respectively the mean expressions of gene x and y under condition A, and A is the number of samples under condition A, and k is the sample index. The correlation values were transformed using Fisher’s Z transformation such that Spiga E, et al. [18].
$$Z_A = \frac{1}{2} \log \frac{1+r_A}{1-r_A}$$
The test statistic for each individual gene pair is the difference between the Z-transformed correlations under conditions A and B (ZA and ZB) such that Walsh C, et al. [19].
$$Z = \frac{Z_A - Z_B}{\sqrt{\frac{1}{n_A} - \frac{1}{n_B} - 3}}$$
where nA and nB are respectively the numbers of samples under conditions A and B. DiffCorr provides a significance of the correlation difference between two conditions (p-value) for each individual gene pair and only links with assigned p-values < 0.01 are deemed significant and remain in the DC network while the remaining links are removed from the network. Decomposing DC network into resistant and sensitive sub-networks: The DC network is further decomposed into two subnetworks, DC resistant and DC sensitive, based on the weights of the links given by (rA- rB) for individual gene pairs. In the DC resistant sub-network, only the links that satisfy both of the two conditions rA- rB > 0.5 and rA > 0.5 are included. Similarly, in the DC sensitive sub-network, only links that satisfy both of the two conditions rA- rB < -0.5 and rB > 0.5 are included. These conditions ensure that selected links represent high or moderate co-expression between the respective genes under the condition of interest but not under the second condition. Decomposing the DC network in this way allows easier biological interpretation for detected modules under each condition, as only genes with homogeneous changes between conditions are highlighted in each subnetwork.
Protein-Protein Interaction (PPI) Network
Protein-protein interactions (PPIs) are the physical contacts of high specificity established between two or more protein molecules as a result of biochemical events steered by electrostatic forces including the hydrophobic effect. Many are physical contacts with molecular associations between chains that occur in a cell or in a living organism in a specific biomolecular context. Proteins rarely act alone as their functions tend to be regulated. Many molecular processes within a cell are carried out by molecular machines that are built from numerous protein components organized by their PPIs [20]. These interactions make up the so-called interact omics of the organism, while aberrant PPIs are the basis of multiple aggregation-related diseases, such as Creutzfeldt-Jakob, Alzheimer’s diseases.
Module Analysis of Protein-Protein Interaction (PPI) Network
Search Tool for the Retrieval of Interacting Genes (STRING) database (http://www.stringdb.org/) was used to acquire PPI information for the DEGs. Cytoscape software was applied to visualize the PPI network according to PPI information [21]. The top DEGs with a high degree of connectivity in the PPI network were selected to discuss their function and effect on cervical cancer. Then, we successively performed module analysis and GO analysis to identify the biological processes that the module genes were significantly enriched in by the plug-ins Molecular Complex Detection (MCODE) and Biological Network Gene Ontology tool (BINGO) in Cytoscape. Finally, the connectivity of these pivotal DEGs was verified through protein protein interaction (PPI) network [22].
Computing Software
In this study, we have used several software [23, 24]. These are- R statistical software (version 3.6.1), Cytoscape (version 3.7.2), Molecular Complex Detection (MCODE), Biological Network Gene Ontology tool (BiNGO), Search Tool for the Retrieval of Interacting Genes (STRING) database, The Database for Annotation, Visualization and integrated Discovery (DAVID) [25].
Results and Discussion
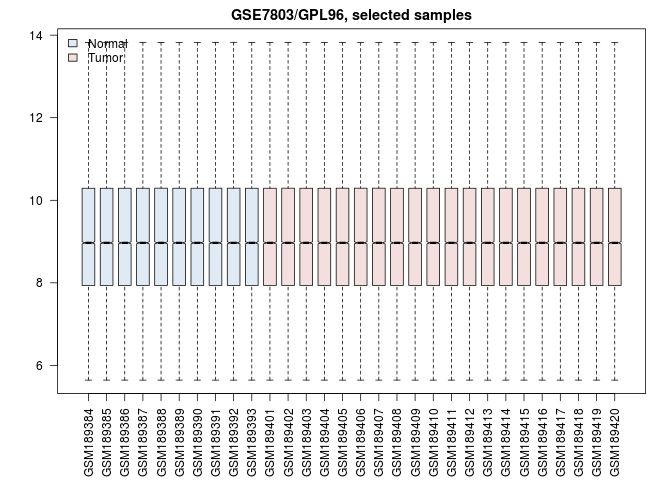
By the box plot in Figure 1 the effect of preprocessing can be observed all sample of cervical cancer from dataset GSE7803 indicates that the sample we choose to study have been normalized appropriately. The medians of the preprocessed data are equal and the variation is smaller due to the division by their MAD. Note that by box plotting a data frame a fast overview of the distributions of columns in a data frame is obtained.
From Table 2, we have applied several statistical methods on cervical cancer dataset for identifying differentially express genes. We found that Student’s t test identified 5,222 DEGs, Welch t test recognized 4,825 DEGs, F test recognized 1,300 DEGs, LRT identified 6,241DEGs and Hochberg and Benjamini test identified 2,812 DEGs.
| Test | Parameter | DEG |
|---|---|---|
| Students t test | p value <0.01 | 5,222 |
| Welch t test | p value <0.01 | 5,101 |
| F test | F tab <F cal | 1,300 |
| LRT | Tab < calculate | 6,241 |
| Hochberg and Benjamini test | p value <0.01 | 2,812 |
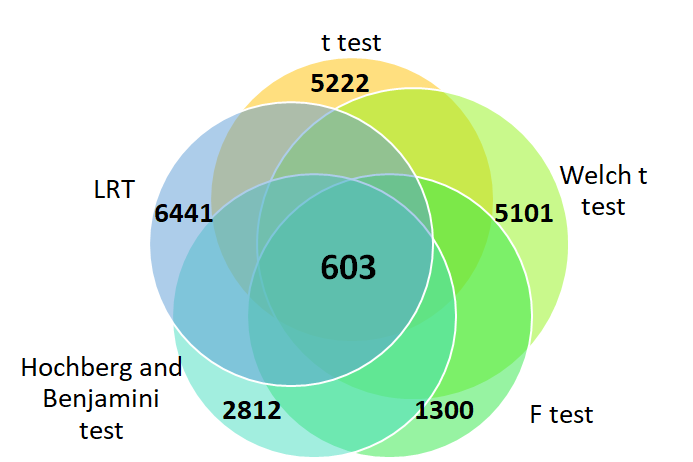
From the resulting Venn diagram in Figure 2, it can be seen that identification of the differentially expressed genes in the GSE7803 gene expression profile dataset. The five statistical methods (Students t test, Welch t test, F test, LRT and Hochberg and Benjamini test) showed a common 603 differentially expressed genes.
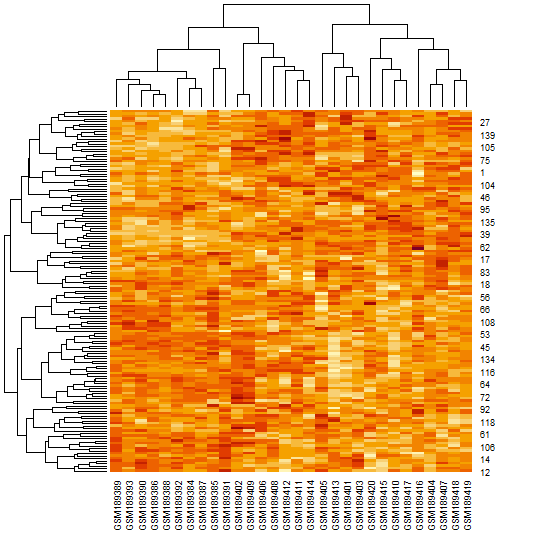
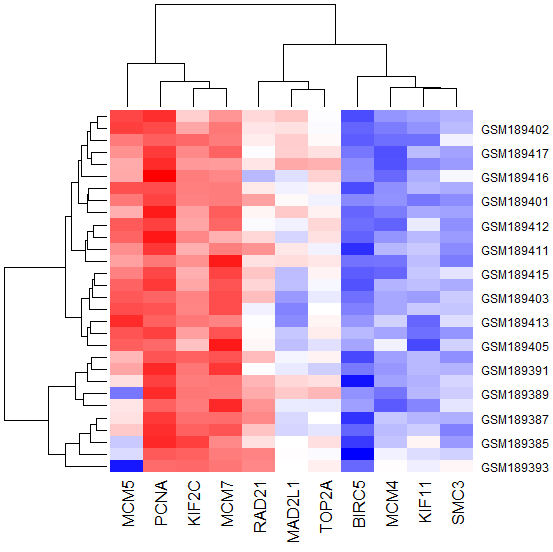
The five points and the clusters are indicated by the row and column side shadings, respectively. The tree can be cut into branches (clusters) by specifying the height or number of branches desired. Usually, we cut the tree right above the height where the branches become dense. In this dataset, the dendrogram was out into seven final clusters. The gene expression data can be displayed in a heatmap in the order of the dendrogram in Figure 3.
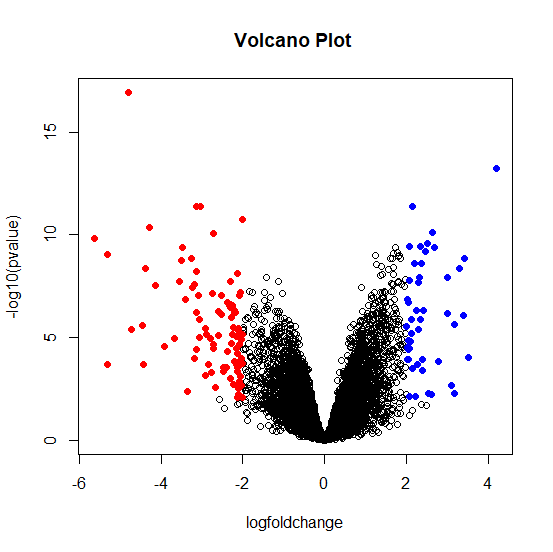
From Figure 4, one chooses to complete the significance values (p-values) of the genes, it is interesting to compare the size of the fold change to the statistical significance level. The volcano plot arranges genes along dimensions of biological and statistical significance. The first (horizontal) dimension is the fold change between the two groups (on a log scale, so that up and down regulation appear symmetric) and the second (vertical) axis represents the p-value from the moderated test on a negative log scale, so smaller p-values appear higher up. More precisely, in the volcano plot the Red: DEGs with fold changes less than 2, which indicated down regulated genes; Blue: DEGs with fold changes over 2, which indicated down regulated genes. The first axis indicates biological impact of the change; the second indicates the statistical evidence or reliability of the change.
In Table 3 showed the detailed information on the top 10 differentially expressed genes in the analysis result including gene symbol, gene name, average expression value, expression fold change, and statistics, such as t value and P value.
| Gene.symbol | Gene name | P.Value | adj.P.Val | t | logFC |
|---|---|---|---|---|---|
| UPK1A | Uroplakin 1A | 1.35E-21 | 3.01E-17 | -2.32E+01 | -4.81 |
| DSG1 | Desmoglein 1 | 3.88E-19 | 4.32E-15 | -1.92E+01 | -4.44 |
| CDKN2A | Cyclin dependent kinase inhibitor 2A | 2.20E-18 | 1.63E-14 | 1.81E+01 | 4.27 |
| ENDOU | Endonuclease, poly(U) specific | 3.23E-17 | 1.80E-13 | -1.65E+01 | -3.11 |
| KNTC1 | Kinetochore associated 1 | 1.32E-15 | 5.87E-12 | 1.45E+01 | 2.18 |
| IL1R2 | Interleukin 1 receptor type 2 | 1.64E-15 | 6.07E-12 | -1.44E+01 | -3.16 |
| BBOX1 | Gamma-butyrobetaine hydroxylase 1 | 4.61E-15 | 1.47E-11 | -1.39E+01 | -2.77 |
| KRT1 | Keratin 1 | 9.31E-15 | 2.59E-11 | -1.35E+01 | -5.51 |
| AR | Androgen receptor | 1.61E-14 | 3.99E-11 | -1.32E+01 | -2.01 |
| ECT2 | Epithelial cell transforming 2 | 2.45E-14 | 5.47E-11 | 1.30E+01 | 2.69 |
Table 3: Detailed information on the top 10 differentially expressed genes.
From Figure 5 it is found that DEGs significantly enriched in Cell cycle, DNA replication, Homologous recombination, p53 signaling pathway, small cell lung cancer, Base excision repair, Influenza A, Fanconi anemia pathway, Type I diabetes mellitus, Rheumatoid arthritis activities.
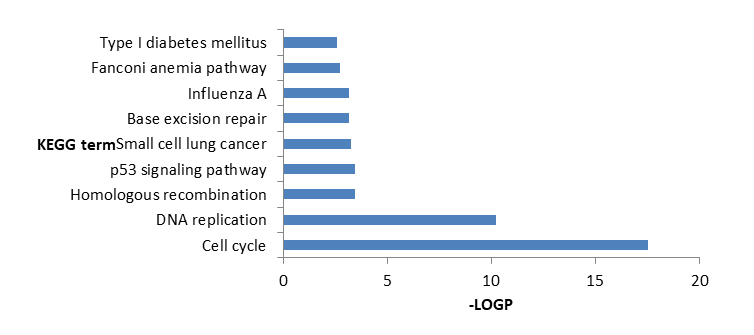
From Table 4 showed the detailed information of Top 10 significantly enriched KEGG pathways including KEGG id, KEGG name, Percentage in genome, P-Value, Fold Enrichment and FDR
| KEGG ID | KEGG name | Count | Percentage in genome | P-Value | Fold Enrichment | FDR | |
|---|---|---|---|---|---|---|---|
| 4110 | Cell cycle | 31 | 5.938697 | 2.81E-18 | 7.412716 | 3.57E-15 | |
| 3030 | DNA replication | 14 | 2.681992 | 5.75E-11 | 11.53089 | 7.31E-08 | |
| 3440 | Homologous recombination | 7 | 1.340996 | 3.33E-04 | 7.157105 | 0.423026 | |
| 4115 | p53 signaling pathway | 10 | 1.915709 | 3.63E-04 | 4.425502 | 0.46098 | |
| 5222 | Small cell lung cancer | 11 | 2.10728 | 5.15E-04 | 3.83717 | 0.652782 | |
| 3410 | Base excision repair | 7 | 1.340996 | 6.95E-04 | 6.289577 | 0.879633 | |
| 5164 | Influenza A | 16 | 3.065134 | 7.12E-04 | 2.726516 | 0.90062 | |
| 3460 | Fanconi anemia pathway | 8 | 1.532567 | 0.001815 | 4.475602 | 2.282842 | |
| 4940 | Type I diabetes mellitus | 7 | 1.340996 | 0.002558 | 4.94181 | 3.203524 | |
| 5323 | Rheumatoid arthritis | 10 | 1.915709 | 0.002639 | 3.369416 | 3.302791 | |
| GO ID | GO Term | Count | Percentage | P-Value | Fold Enrichment | FDR | |
| GO:0005515 | Protein binding | 361 | 68.24197 | 3.49E-23 | 1.412805 | 5.26E-20 | |
| GO:0003682 | Chromatin binding | 34 | 6.427221 | 4.35E-08 | 2.98964 | 6.54E-05 | |
| GO:0005524 | ATP binding | 80 | 15.12287 | 1.12E-07 | 1.839778 | 1.69E-04 | |
| GO:0003688 | DNA replication origin binding | 7 | 1.323251 | 2.37E-07 | 21.87873 | 3.56E-04 | |
| GO:0003677 | DNA binding | 83 | 15.68998 | 1.44E-06 | 1.704666 | 0.002161 | |
| GO:0043142 | Single-stranded DNA-dependent ATPase activity | 6 | 1.134216 | 4.51E-06 | 20.62851 | 0.006784 | |
| GO:0003678 | DNA helicase activity | 7 | 1.323251 | 5.00E-05 | 10.02775 | 0.075209 | |
| GO:0003697 | Single-stranded DNA binding | 12 | 2.268431 | 7.85E-05 | 4.436239 | 0.118022 | |
| GO:0008574 | ATP-dependent microtubule motor activity, plus-end-directed | 6 | 1.134216 | 9.35E-05 | 12.13442 | 0.140632 | |
| GO:0003690 | Double-stranded DNA binding | 11 | 2.079395 | 1.15E-04 | 4.669005 | 0.172637 |
Table 4: Top 10 significantly enriched KEGG pathways.
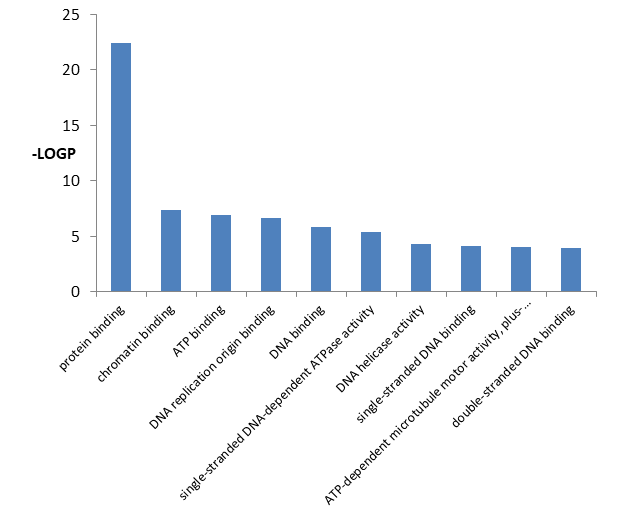
From Table 5 it is showed the detailed information of top 10 significantly enriched GO pathways molecular function including GO id, GO term, percentage, p value, fold increment, and false discovery rate.
From Figure 6 it is found that the DEGs significantly enriched in protein binding, chromatin binding, ATP binding, DNA replication origin binding, DNA binding, single-stranded DNA-dependent ATPase activity, DNA helicase activity, single- stranded DNA binding, ATP-dependent microtubule motor activity, plus-end-directed, double-stranded DNA binding activities.
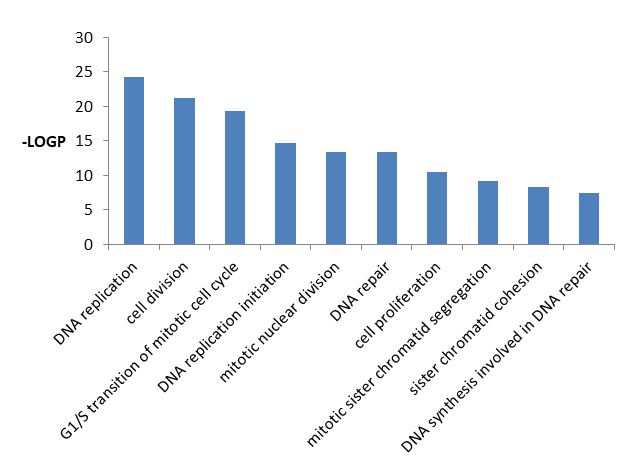
From Table 6 it is showed the detailed information of top 10 significantly enriched GO pathways biological process including GO id, GO term, percentage, p value, fold increment, and false discovery rate.
| GO ID | GO Term | Count | percentage | P-Value | Fold Enrichment | FDR | |
|---|---|---|---|---|---|---|---|
| GO:0006260 | DNA replication | 39 | 7.372401 | 6.73E-25 | 8.711513 | 1.17E-21 | |
| GO:0051301 | Cell division | 52 | 9.829868 | 5.66E-22 | 5.143941 | 9.85E-19 | |
| GO:0000082 | G1/S transition of mitotic cell cycle | 29 | 5.482042 | 4.24E-20 | 9.843703 | 7.39E-17 | |
| GO:0006270 | DNA replication initiation | 16 | 3.024575 | 2.33E-15 | 17.31134 | 4.05E-12 | |
| GO:0007067 | Mitotic nuclear division | 35 | 6.616257 | 3.76E-14 | 4.886265 | 6.55E-11 | |
| GO:0006281 | DNA repair | 34 | 6.427221 | 4.50E-14 | 5.009239 | 7.84E-11 | |
| GO:0008283 | Cell proliferation | 38 | 7.183365 | 3.34E-11 | 3.594705 | 5.82E-08 | |
| GO:0000070 | Mitotic sister chromatid segregation | 11 | 2.079395 | 8.00E-10 | 15.23398 | 1.39E-06 | |
| GO:0007062 | Sister chromatid cohesion | 18 | 3.402647 | 5.79E-09 | 6.050566 | 1.01E-05 | |
| GO:0000731 | DNA synthesis involved in DNA repair | 11 | 2.079395 | 3.47E-08 | 10.88141 | 6.03E-05 |
Table 5: Top 10 significantly enriched GO pathways biological process.
From Figure 7 it is found that DEGs significantly enriched in DNA replication, cell division, G1/S transition of mitotic cell cycle, DNA replication initiation, mitotic nuclear division, DNA repair, cell proliferation, mitotic sister chromatid segregation, sister chromatid cohesion, DNA synthesis involved in DNA repair activities.
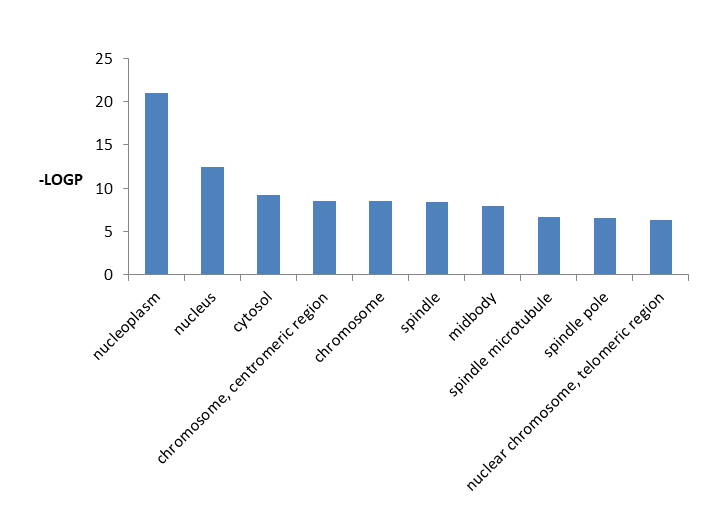
In Table 7 we showed the detailed information of top 10 significantly enriched GO pathways cellular component including GO id, GO term, percentage, p value, fold increment, and false discovery rate.
| GO ID | GO Term | Count | Percentage | P-Value | Fold Enrichment | FDR |
|---|---|---|---|---|---|---|
| GO:0005654 | Nucleoplasm | 160 | 30.24575 | 9.09E-22 | 2.111605 | 1.28E-18 |
| GO:0005634 | Nucleus | 223 | 42.15501 | 3.95E-13 | 1.513103 | 5.57E-10 |
| GO:0005829 | Cytosol | 146 | 27.59924 | 6.85E-10 | 1.618197 | 9.66E-07 |
| GO:0000775 | Chromosome, centromeric region | 14 | 2.646503 | 3.08E-09 | 9.024335 | 4.34E-06 |
| GO:0005694 | Chromosome | 18 | 3.402647 | 3.28E-09 | 6.298618 | 4.63E-06 |
| GO:0005819 | Spindle | 19 | 3.591682 | 4.60E-09 | 5.769395 | 6.48E-06 |
| GO:0030496 | Midbody | 19 | 3.591682 | 1.30E-08 | 5.411603 | 1.83E-05 |
| GO:0005876 | Spindle microtubule | 11 | 2.079395 | 2.16E-07 | 9.185484 | 3.05E-04 |
| GO:0000922 | Spindle pole | 16 | 3.024575 | 2.55E-07 | 5.393312 | 3.60E-04 |
| GO:0000784 | Nuclear chromosome, telomeric region | 17 | 3.213611 | 4.86E-07 | 4.804715 | 6.85E-04 |
Table 6: Top 10 significantly enriched GO pathways cellular component.
From Figure 8 it is clear that DEGs significantly enriched in nucleoplasm, nucleus, cytosol, chromosome, centromeric region, chromosome, spindle, midbody, spindle microtubule, nuclear chromosome, telomeric region activities.
From Table 8 we showed the GO ID, GO term, P value and corresponding gene name of module 1.
| GO-ID | Term | Count | P Value | Genes in test set |
|---|---|---|---|---|
| GO:0005515 | Cell Cycle | 25 | 3.49E-23 | MCM7|BUB1B|NCAPG|TTK|RFC5|GINS1|FEN1|RFC3|PCNA|MC M7|RECQL|MRE11A|MCM10|CDC7|IG1ORC5|ORC6RAD51|CCNE 2|MCM3|MCM4|MCM5|MCM6|MCM2|ATR |
| GO:0003682 | DNA Metabolic Process | 20 | 4.35E-08 | MCM7|BUB1B|NCAPG|TTK|AURKA|CCNB2|CCNB1|RACGAP1|P BK|NEK2|E2F3|DLGAP5|UBE2C|MRE1A|KIF23|CDC7|NDC80|M SH6|CCA2|TUBBA| |
| GO:0005524 | ATP Binding | 29 | 1.12E-07 | FEN1|PCNA|MCM7|MCM10|ORC5|ORC6|OBFC1|TOPBP1|RFC5| GINS1|RFC3|RECQL|MRE11A|CDC7|FOS|IGF1|MSH6|RAD51|CC NE2|MCM3|MCM4|MCM5|MCM6|MCM2|ATR|RAD51|IL8|CKS2| MCM3 |
| GO:0003688 | Cell Cycle Phase | 15 | 2.37E-07 | UBE2C|BUB1B|NCAPG|MRE11A|KIF23|TTK|NDC80|AURKA|MS H6|CCNA2|CCNB2|CCNB1|TUBB2A|RAD51|PBK |
| GO:0003677 | DNA Binding | 30 | 1.44E-06 | UBE2C|BUB1B|NCAPG|MRE11A|KIF23|TTK|CDC7|NDC80|AUR KA|MSH6|CCNA2|CCNB2|CCNB1|TUBB2A|RAD51|PBK|CKS2|T IMELESS|NEK2|DLGAP5|MAD2L1|CKS2|TIMELESS|MAD2L1|TI MELESS|MCM6|MCM2|ATR|MAD2L1 |
Table 7: The top 5 significantly enriched GO terms and Corresponding gene information in module 1.
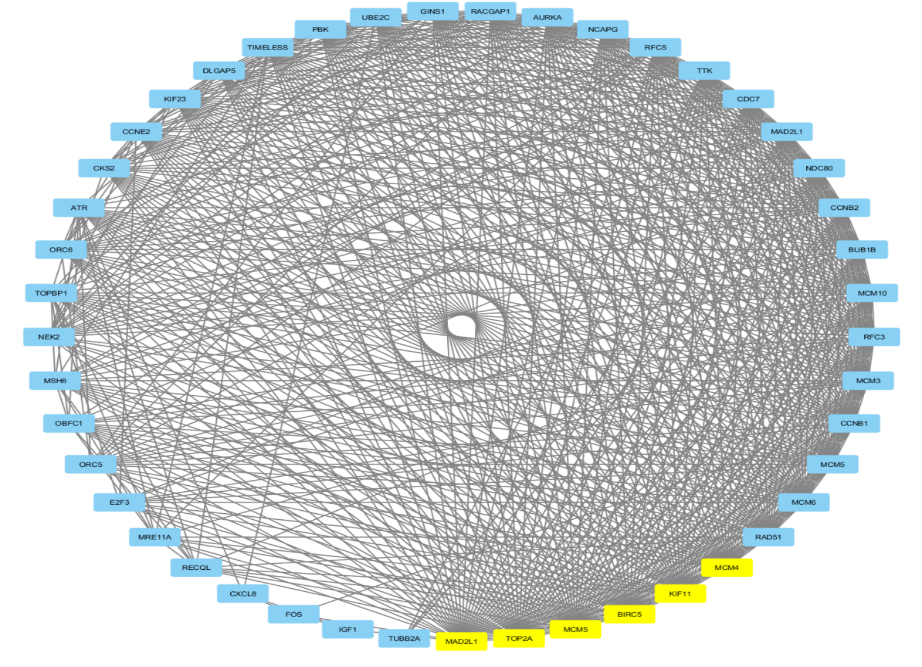
From Figure 9, the differentially expressed genes (DEGs) were identified using GSE7803 and the limma package, and Gene Ontology (GO) and Kyoto Encyclopedia of Genes and Genomes (KEGG) enrichment analyses were conducted using the Database for Annotation, Visualization and Integrated Discovery. The hub genes were identified using Cytoscape and proteinprotein interaction (PPI) networks were constructed using the STRING database. From Figure 9 it is found that the six yellow node (MAD2L1, TOP2A, MCM5, BIRC5, KIF11, MCM4) in the network represent the core node with degree of connectivity greater than 15. The PPI network identified six key genes (MAD2L1, TOP2A, MCM5, BIRC5, KIF11, MCM4), which were hub genes for preinvasive and invasive cervical cancer. In conclusion, bioinformatics analysis identified six key genes in cervical cancer progression (MAD2L1, TOP2A, MCM5, BIRC5, KIF11, MCM4), which may be potential biomarkers for differentiating normal cervical epithelial tissue from cervical cancer.
In Table 9 we showed the GO ID, GO term, P value and corresponding gene name of module 2.
| Term | Count | P Value | Genes in test set | |
|---|---|---|---|---|
| GO:0006260 | DNA Replication | 14 | 6.73E-25 | TIPIN|SMC3|SMC4|NSL1|ZWINT|STAG1|CENPF|DBF4|PRC1|CCNE1|RAD21|KNTC1|KIF2C|BUB3 |
| GO:0051301 | Cell Division | 12 | 5.66E-22 | TIPIN|STAG1|CENPF|RAD21|KNTC1|KIF2C|BUB3|SMC3|SMC4|NSL1|ZWINT|RAD21 |
| GO:0000082 | Cell Cycle Phase | 14 | 4.24E-20 | TIPIN|SMC3|SMC4|NSL1|ZWINT|STAG1|CENPF|DBF4|PRC1|CCNE1|RAD21|KNTC1|KIF2C|BUB3 |
| GO:0006270 | Nuclear Division | 13 | 2.33E-15 | TIPIN|SMC3|SMC4|NSL1|TOP2A|STAG1|CENPF|PRC1|CCNE1|RAD21|KNTC1|KIF2C|BUB3 |
| GO:0007067 | Mitotic Nuclear Division | 11 | 3.76E-14 | TIPIN|STAG1|CENPF|RAD21|KNTC1|KIF2C|BUB3|SMC3|SMC4|NSL1|ZWINT |
Table 8: The top 5 significantly enriched GO terms and Corresponding gene information in module 2.
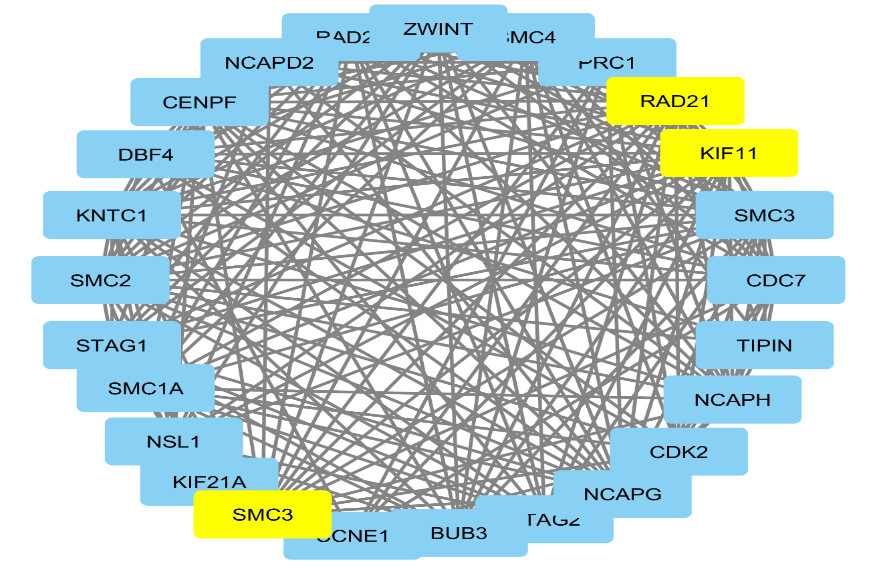
KEGG pathway analysis showed that the DEGs were significantly enriched in Figure 10 it is found that the three yellow node (SMC3, RAD21, KIF11) in the network represent the core node with degree of connectivity greater than 14. By comprehensive analysis, they confirmed that cell cycle was a key biological process and a critical driver in cervical cancer. They identified DEGs and screened the key genes and pathways closely related to cervical cancer by bioinformatics analysis, simultaneously deepening our understanding of the molecular mechanisms underlying the occurrence and progression of cervical cancer.
The Table 10 we showed the GO ID, GO term, P value and corresponding gene name of module 3.
| GO-ID | Term | Count | P Value | Genes in test set |
|---|---|---|---|---|
| GO:0005654 | Mitotic Cell Cycle | 19 | 9.09E-22 | BARD1|BLM|CDKN2A|PLK2|KIF11|SMC1A|CKS1B|S MC2|KAT2B|CDC23|RBL1|PTTG1|NUSAP1|CDK1|BI RC5|NBN|TRIP13|CEP55|CDKN3 |
| GO:0005634 | Cell Cycle Phase | 15 | 3.95E-13 | BARD1|BLM|CDKN2A|SMC1A|FANG|CKS1B|KAT2 B|CDK7|CDC23|TPR|NUSAP1|CDK1|BIRC5|NBN|C DKN3 |
| GO:0005829 | Cell Cycle | 16 | 6.85E-10 | BARD1|BLM|CDKN2A|KIF11|SMC1A|SMC2|KAT2B| CDC23|PTTG1|NUSAP1|CDK1|BIRC5|NBN|TRIP13| CEP55|CDKN3 |
| GO:0000775 | Regulation Of Cell Cycle | 14 | 3.08E-09 | BLM|CDKN2A|KIF11|SMC1A|SMC2|CDC23|PTTG1| NUSAP1|CDK1|BIRC5|NBN|TRIP13|CEP55|CDKN3 |
| GO:0005819 | Cell cycle process | 13 | 4.60E-09 | PLK2|BLM|CDKN2A|KIF11|SMC1A|SMC2|CDC23|P TTG1|NUSAP1|CDK1|BIRC5|CEP55|CDKN3 |
Table 9: The top 5 significantly enriched GO terms and Corresponding gene information in module 3.
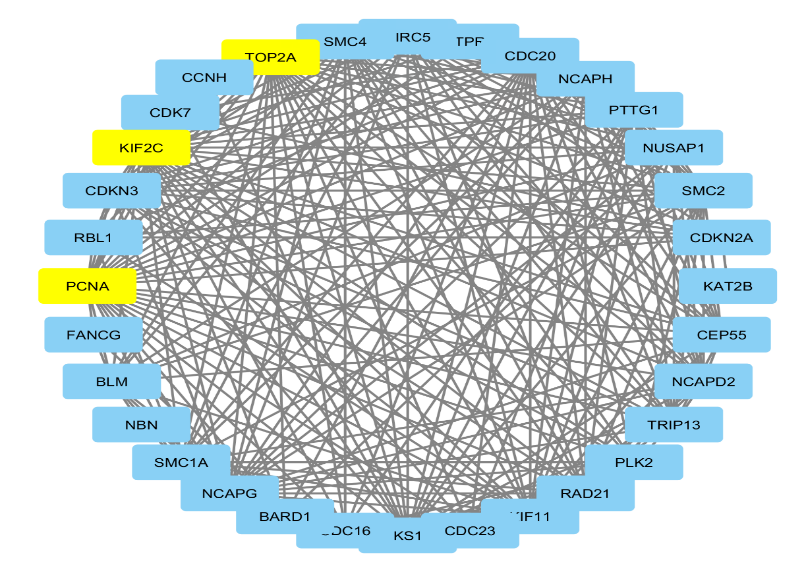
Performed pathway analysis in order to improve current knowledge on the molecular drivers of cervical cancer and detect potential targets for treatment. From PPI-network in Figure 11 it is found that the three yellow nodes (KIF2C, PCNA, and TOP2A) in the network represent the core node with degree of connectivity greater than 15. Potential targets for treatment which could be identified were KIF2C, PCNA, and TOP2A among others.
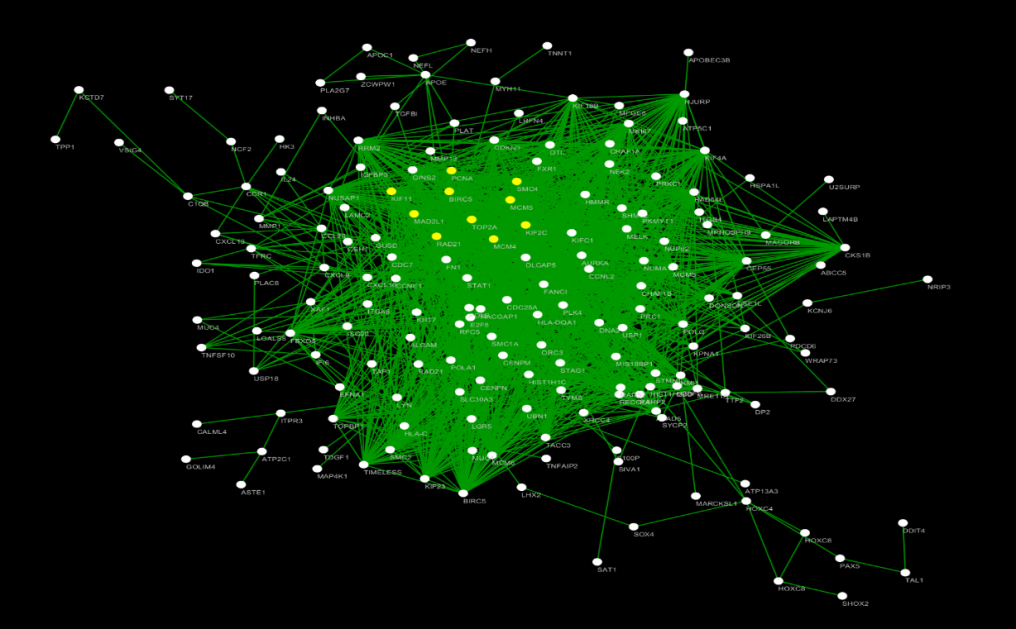
From Figure 12 it is clear that the 10-yellow node (KIF2C, RAD21, MAD2LI, TOP2A, BIRC5, KIF11, MCM5, PCNA, MCM4, SMC3) in the network represent the core node with degree of connectivity greater than 58 which consider as hub genes.
From Figure 13 Heat map of the Hub genes from the protein-protein interaction network analysis results the expression level of the 10 hub genes showed. The heat map based on database preliminarily demonstrated the expression change of the key genes in cervical cancer. The results were basically coincident with the front enrichment analysis results.
From Table 11 it is identified that the ten hub genes have two KEGG pathways and these two pathways are cell cycle and DNA replication.
| KEGG ID | Pathway Name | Count | Name of Gene | P value |
|---|---|---|---|---|
| Hsa04110 | Cell cycle | 6 | KIF2C, RAD21, MAD2LI, TOP2A, BIRC5, KIF11 | 1.04E-08 |
| Hsa03030 | DNA replication | 4 | MCM5, PCNA, MCM4, SMC3 | 2.60E-06 |
Table 10: The detailed information of 10 hub genes KEGG pathways.
Conclusion
In this research the original cervical cancer microarray dataset GSE7803 used and by applying Students t test, Welch t test, F test, Likelihood ratio test, Hochberg and Benjamini test 603 common differentially express genes identified between normal and cancerous cervix samples. Then, these differentially express genes used for subsequent bioinformatics analysis. GO term enrichment analysis showed that the DGEs are significantly enriched in protein binding , chromatin binding , ATP binding , DNA replication origin binding, DNA binding, single-stranded DNA-dependent ATPase activity , DNA helicase, DNA replication, cell division, DNA replication initiation, mitotic nuclear division, DNA repair, cell proliferation, mitotic sister chromatid segregation, nucleoplasm , nucleus , cytosol , chromosome, centromeric region , chromosome activities in cervical cancer. KEGG pathway enrichment analysis found that DEGs are significantly enriched in Cell cycle, DNA replication, Homologous recombination, p53 signaling pathway, small cell lung cancer, Base excision repair, Influenza A, Fanconi anemia pathway, Type I diabetes mellitus, Rheumatoid arthritis activities. The enriched GO terms and KEGG pathways explained the specific molecular mechanisms of cervical cancer to some extent. Then, by constructing protein-protein interaction network the top ten hub genes with relatively high degree of connectivity (over 58 in PPI network) are identified. These top ten hub genes are KIF2C, RAD21, MAD2LI, TOP2A, BIRC5, KIF11, MCM5, PCNA, MCM4, and SMC3. Finally, the KEGG pathway enrichment analysis of this Hub genes found that six hub genes (KIF2C, RAD21, MAD2LI, TOP2A, BIRC5, KIF11) are significantly enriched in cell cycle, and four Hub genes (MCM5, PCNA, MCM4, SMC3) are significantly enriched DNA replication.
Conflict of Interest
There is no conflict of interest.
Acknowledgements
The authors would like to thank the anonymous reviewers for their valuable comments.
References
-
Ciemny M, Kurcinski M, Kamel K, Kolinski A, Alam N, et al. (2018) Protein–peptide docking: opportunities and challenges. Drug Discovery Today 23(8): 1530-1537.
-
Daniel S, Peter FR, Tobias AB, Constance C (2019) Comparative analysis of differential gene expression tools for RNA sequencing time course data. Briefings in Bioinformatics 20(1): 288-298.
-
Doulah MSU (2019) Application of Machine Learning Algorithms in Bioinformatics. Bioinformatics & Proteomics Open Access Journal 3(1): 000127.
-
Gaudet P, _Škunca_ N, Hu JC, Christophe G (2017) Primer on the Gene Ontology. Methods Mol Biol 1446: 25-37.
-
Hanukoglu I (2017) Conservation of the Enzyme- Coenzyme Interfaces in FAD and NADP Binding Adrenodoxin Reductase-A Ubiquitous Enzyme. J Mol Evol 85(5-6): 205-218.
-
Jaakkola MK, Seyednasrollah F, Mehmood A, Elo LL (2017) Comparison of methods to detect differentially expressed genes between single-cell populations. Briefings in Bioinformatics 18(5): 735-743.
-
Joyce AP, Zhang C, Bradley P, Havranek JJ (2015) Structure-based modeling of protein: DNA specificity. Brief Funct Genomics 14(1): 39-49.
-
Doulah MSU (2019) A Comparison among Twenty- Seven Normality Tests. Research & Reviews: Journal of Statistics 8(3): 41-59.
-
Doulah MSU, Islam MH (2019) An Alternative Robust Measure of Outlier Detection in Univariate Data Sets. Research & Reviews: Journal of Statistics 8(1): 1-11.
-
Doulah MSU, Islam MH (2018) Alternative Robust Methods of Multivariate Outlier Detection. J Math Stat 1(1): 1-9.
-
Doulah MSU (2018) Alternative Measures of Standard Deviation Coefficient of Variation and Standard Error. International Journal of Statistics and Applications 8(6): 309-315.
-
Doulah MSU (2021) An Alternative Measures of Moments Skewness Kurtosis and JB Test of Normality. Journal of Statistical Theory and Applications 20(2): 219-227.
-
Wu K, Yi Y, Liu F, Wu W, Chen Y, et al. (2018) Identification of key pathways and genes in the progression of cervical cancer using bioinformatics analysis. Oncol Lett 16(1): 1003-1009.
-
Lisova O, Belkadi L, Bedouelle H (2014) Direct and indirect interactions in the recognition between a cross- neutralizing antibody and the four serotypes of dengue virus. J Mol Recognit 27(4): 205-214.
-
Malhis N, Gsponer J (2015) Computational identification of MoRFs in protein sequences. Bioinformatics 31(11): 1738-1744.
-
Muto A, Kotera M, Tokimatsu T, Nakagawa Z, Goto S, et al. (2013) Modular architecture of metabolic pathways revealed by conserved sequences of reactions. J Chem Inf Model 53(3): 613-622.
-
Qin K, Dong C, Wu G, Lambert NA (2011) Inactive- state preassembly of G(q)-coupled receptors and G(q) heterotrimers. Nat Chem Biol 7(10): 740-747.
-
Spiga E, Degiacomi MT, Dal Peraro M (2014) New Strategies for Integrative Dynamic Modeling of Macromolecular Assembly. Adv Protein Chem Struct Biol 96: 77-111.
-
Walsh C, Hu P, Batt J, Santos C (2015) Microarray Meta- Analysis and Cross-Platform Normalization: Integrative Genomics for Robust Biomarker Discovery. Microarrays 4(3): 389-406.
-
Westermarck J, Ivaska J, Corthals GL (2013) Identification of protein interactions involved in cellular signaling. Mol Cell Proteomics 12(7): 1752-63.
-
Wodak SJ, Pu S, Vlasblom J, Séraphin B (2009) Challenges and rewards of interaction proteomics. Mol Cell Proteomics 8(1): 3-18.
-
Tang X, Xu Y, Lu L, Jiao Y, Liu J (2018) Identification of key candidate genes and small molecule drugs in cervical cancer by bioinformatics strategy. Cancer Manag Res 10: 3533-3549.
-
Doulah MSU (2019) Time Series Forecasting: A Comparative Study of VAR ANN and SVM Models. Journal of Statistical and Econometric Methods 8(3): 21-34.
-
Wu X, Peng L, Zhang Y, Chen S, Lei Q, et al. (2019) Identification of Key Genes and Pathways in Cervical Cancer by Bioinformatics Analysis. Int J Med Sci 16(6): 800-812.
-
Tan Y, Liu Y (2011) Comparison of methods for identifying differentially expressed genes across multiple conditions from microarray data. Bioinformation 7(8): 400-404.
- Carbon Code for Analysis of Protein Stability in Protein Mutation
- Number of Contiguous Amino Acids in Nanon of 16A Diameter
- Effect of Dietary Inclusion Levels of Moringa Olerifera Oil on the Growth Performance and Nutrient Retention of Broiler Starter Chicks
- Proteomics Loans in Kinetoplastids during the Last Decade
- “Identification of SARS-CoV-2 in Human Genome based on Protein Dynamics Conversion and Target Genes Marking via Bioinformatics Approaches”
- Loud Noises Lead to Dementia