Modeling the Growth and Death of MCF-7 Breast Cancer While Simulating the Effects of Cancer Therapy Involving Optimal Levels of Phyto Extract
Breast cancer is a growing epidemic in today’s society. There are three main types of cells involved with MCF-7 breast cancer: cancer stem cells (CSC), progenitor cells (PC), and terminally differentiated cells (TDC). For the growth curve portion of this project, a line of MCF-7 breast cancer cells were grown with and without hydrogen peroxide and counted daily for 6 days. To mathematically model the cell growth, an ordinary differential equations model developed by Liu, et al. In their paper Nonlinear Growth Kinetics of Breast Cancer Stem Cells: Implications for Cancer Stem Cell Targeted Therapy was examined. While their model gives reasonable cell count estimates for short time periods, it greatly underestimates the number of CSC over longer time periods. This project adjusts their model by adding a feedback loop in order to more accurately estimate the number of CSC as well as PC and TDC. Thus, personalized targeted cancer stem cell treatment may be utilized in cancer patients with specific types of cancer. For the death curve portion of this project, MCF-12A healthy breast cells, and MCF-7 cancerous breast cells were grown in vitro, mimicking those growing in vivo. Red clover (Trifolium pratense) and blue false indigo (Baptisia australis) extracts were added to both cell types. Red clover and blue false indigo were chosen for this experiment due to their phytoestrogenic properties. Phytoestrogens are similar to mammalian estrogens and can, therefore, weakly bind to estrogen receptors, such as the ER+ receptors on MCF-7 cells. By performing a trypan blue exclusion assay, we were able to determine the death rates of both cell groups as a result of the added extracts. This project has helped researchers understand the rate at which cells died under exposure to the extracts.
Introduction
Breast cancer is the most common diagnosed cancer in women in the United States, followed by skin cancer. Although
it can occur in both males and females it is more common in females. There are two types of breast cancer that frequently occur in women, the first one being ductal carcinoma. This type of malignancy starts in the ducts that move milk from the breast to the nipple. The second type of breast cancer is lobular carcinoma, which starts in the parts of the breast, called lobules which are responsible for producing the milk [1].
Liu, et al. [2] model in Nonlinear Growth Kinetics of Breast Cancer Stem Cells: Implications for Cancer Stem Cell Targeted Therapy features three types of cancer cells: cancer stem cells, progenitor cells, and terminally differentiated cells. Cancer stem cells (CSC) are groups of cells found within cancerous tissue and are typically associated with aggressive forms of breast cancer. When these cells divide, they can either divide symmetrically or asymmetrically. These divisions are what cause tumors to grow. If they divide symmetrically, they can either produce two more CSC or create two of a new kind of cell called a progenitor cell (PC). If they divide asymmetrically, the division produces one CSC and one PC. Likewise, PC can divide either symmetrically or asymmetrically. The PC division can create two PC, or two terminally differentiated cells (TDC), or one of each. Once a cell becomes a TDC, it no longer divides to create new TDC.
Liu, et al. suggests a system of differential equations to describe the growth patterns of these cells.
$$\frac{d x_0(t)}{dt} = (p_0 - q_0) v_0 x_0(t) - d_0 x_0(t)$$
$$\frac{d x_1(t)}{dt} = (1 - p_0 + q_0) v_0 x_0(t) + (p_1 - q_1) v_1 x_1(t) - d_1 x_1(t)$$
$$\frac{d x_2(t)}{dt} = (1 - p_1 + q_1) v_1 x_1(t) - d_2 x_2(t)$$
The first equation describes the CSC and how they divide. The number of CSC is represented by $x_0(t)$ at time $t$, the probabilities with which the CSC divide is defined by $(p_0 - q_0)$ (creating two CSC versus two PC; symmetrically versus asymmetrically), and the rate of cell division is represented by $v_0$. The second term of the equation $d_1 x_0(t)$ represents the CSC that die either due to natural causes or due to some cancer therapy. The second equation describes the PC. The first part of the equation is the change in $x_1(t)$, the number of PC, due to CSC division. The middle part is the change in $x_2(t)$ due to PC division and the second half is the adjustment for the dead TDC. Liu et al. explain that if these three equations can accurately describe the growth of these cells, cancer stem cell targeted therapy could be a precise way of treating those with certain types of cancer.
One of the weaknesses in Liu, et al. model, however, is that TDC simply disappear after they die in the sense that they are no longer accounted for by the model. This behavior does not occur in actual cancer cells. Thus, Liu, et al. model significantly underestimates the number of CSC especially as computer simulations based on their model are run over longer time intervals. In the discussion of their results, Liu, et al. themselves write, “The dead cells cannot maintain the functional interaction with CSC but instead may release cellular components that stimulate an inflammatory response, which is well known to promote tumor growth”. More specifically, research papers by Korkaya, et al. [3] and Ham, et al. [4] indicate that this inflammatory response due to decomposing dead TDC causes an increase in the growth rate of the number of CSC.
The goal of this project was to incorporate the previously described inflammatory response into Liu, et al. differential equations model. Adjusting the set of differential equations to include a feedback loop that accounts for TDC not completely dying off, but either partially dying off, or creating more CSC was incorporated into the response. The variable $x_0(t)$ was added to the improved model for the number of dead, intact TDC that could possibly decompose to create new CSC. The modified model is shown below.
$$\frac{d x_0(t)}{dt} = (p_0 - q_0) v_0 x_0(t) - d_0 x_0(t) + d_2 x_3(t)$$
$$\frac{d x_1(t)}{dt} = (1 - p_0 + q_0) v_0 x_0(t) + (p_1 - q_1) v_1 x_1(t) - d_1 x_1(t)$$
$$\frac{d x_2(t)}{dt} = (1 - p_1 + q_1) v_1 x_1(t) - d_2 x_2(t)$$
$$\frac{d x_3(t)}{dt} = d_2 x_2(t) - d_3 x_3(t)$$
For the improved model, the last equation represents the number of TDC dying and turning back into CSC minus the TDC that simply decompose. The first part denotes the increase in $x_2(t)$ due to the death of TDC, and the second part denotes the decrease in $x_3(t)$ due to decomposition of dead TDC. The constant $d_3$ represents the decomposition rate. Because the decomposition rate does not appear in Liu, et al. original model, it was estimated by fitting the cell numbers to the experimental data. Also, in the improved model, the first equation has been changed to add the number of TDC that form new CSC.
The preceding mathematical model accurately model’s growth in cell counts in the case in which no cancer therapy is utilized. To see the effects of a cancer therapy that actively kills cancer and healthy cells, a different mathematical model will be needed. In 2017, Bratus A, et al. [5] developed a differential equation model to represent treatment for skin cancer cells. The same model was used in this project to model the treatment of breast cancer cells.
$$\frac{dC(t)}{dt} = r_1 G(g(t))(\ln_a - \ln C(t))C(t) - \gamma_1 C(t) - k_1 f(h(t))C(t),$$
$$\frac{dN(t)}{dt} = r_1 G(g(t))(\ln_a - \ln N(t))N(t) - \gamma_2 N(t) - k_2 f(h(t))N(t) - \beta N(t)C(t),$$
$$\frac{dg(t)}{dt} = \alpha_g - \gamma_g g(t) - \left(\varepsilon_g C(t) + \varepsilon_g N(t)\right) h(t),$$
$$\frac{dh(t)}{dt} = g(t)u(t) - \gamma_b h(t) - \left(\varepsilon_b C(t) + \varepsilon_b N(t)\right) h(t),$$
$$0 \leq u(t) \leq M, t \geq 0,$$
$$C(0) = C_0 > 0, N(0) = N_0 > 0, g(0) = g_0 > 0, h(0) = h_0 \geq 0.$$
The model above is composed of 4 separate equations. The first equation represents the change in the number of cancer cells over a change in time. Specifically it is the number of cancer cells that grow, represented by the term $r_1 G(g(t))(\ln_a - \ln_c(t))C(t)$, minus the number of cancer cells that die of natural causes, $\gamma_1 C(t)$, minus the number of cancer cells that are killed by the therapeutic treatment, $k_1 f(h(t))C(t)$. Similarly, the following equation represents the change in the number of normal cells over a certain time. The third equation represents the nutrient concentration of the cells. The final equation represents the concentration of the therapeutic treatment. Of particular interest in this model are the parameters $r_p$, which represent the normal and cancer cell growth rates assuming no therapy, and $k_p$, which represent the killing rate implemented by the therapy.
MCF-7 breast cells are estrogen receptor positive (ER+), meaning the cells have a receptor protein that binds to the hormone estrogen. Estrogen is a hormone found in large quantities in female mammals and causes fertility [6]. Increased amounts of estrogen, both naturally occurring and estrogen therapy used for menopausal women, are increasingly tied to a higher risk of developing breast cancer. Estrogen binding to these intracellular receptors causes the cell to proliferate. MCF-7 cells are also progesterone receptor positive (PR+), meaning the hormone progesterone will bind to receptors within the cells. This is similar to the binding of estrogen to their respective receptor proteins. MCF-7 cells are also human epidermal growth factor receptor two negative (HER2-). HER2 is a protein that controls cell growth. Cancerous cells which are HER2- grow slower, and recurrence and metastasis are less likely to occur [7]. These characteristics will be targeted by the red clover and blue false indigo in order to treat the cells.
There are prescription drugs on the market that may be used to inhibit cancerous cell growth and stop the spread of breast cancer. A well-known medication is Nolvadex, generic Tamoxifen. It is a selective estrogen receptor modulator (SERM), which blocks the effects of estrogen in breast cells by binding to the estrogen receptors on the cells, therefore, competitively inhibiting them. Since the cancerous cells are unable to receive the estrogen, proliferation is reduced, and the cell may even die. However, this is only effective in hormone positive cell lines, like MCF-7 [8]. Although Tamoxifen has proven to be effective, there are more natural and holistic approaches to treating breast cancer. For example, red clover and blue indigo were chosen for this experiment due to their phytoestrogenic properties. Phytoestrogens are similar to mammalian estrogens and can therefore weakly bind to estrogen receptors, such as the ER+ receptors on MCF-7 cells. The word phytoestrogen comes from the Greek word “Phyto,” meaning plant, and “estrogen,” referring to the hormone. When they bind to the ER receptors, they may either promote or inhibit the cell’s growth [9].
Methods
Growing the Cells
Human carcinoma cell lines were acquired from the American Type Culture Collection (ATCC Manassas, VA, USA) and cultured according to standard mammalian tissue culture protocols and sterile technique. MCF-7 (ATCC no. HTB-22) cells were cultured in Dulbecco’s Modification of Eagle’s Medium (DMEM, 1x) with 4.5 g/L glucose without L-glutamine and sodium pyruvate. All media was supplemented with 10% FBS/10,000 IU/mL (Atlanta Biologicals, Flowery Branch, GA, and USA) and 1% Penicillin/10,000 µg/mL Streptomycin sterile filtered from the ATCC.
Non-tumorigenic epithelial cell lines were acquired from the American Type Culture Collection (ATCC Manassas, VA, USA) and cultured according to standard mammalian tissue culture protocols and sterile technique. MCF10A (ATTC no.CRL-10317) were cultured in base medium (MEBM) along with the additives obtained from Lonza/Clonetics Corporation as a kit: MEGM (Kit Catalog No. CC-3150). In order to make the complete growth medium, 100ng/mL cholera toxin was added to the medium, and the medium was not filtered.
Growth Curve
MCF-7 cells were incubated at 37°C, under 5% flowing carbon dioxide supplied incubator (Fisher Scientific; Waltham, MA, USA). All equipment was disinfected with 70% ethanol prior to being utilized for experimentation. Flasks (T-75) were used in order to allow cells to proliferate to 90% confluency. Cells were split into two sets of seven identical T-25 flasks at 80-90% confluency. Each T-25 flask in one set was labeled day one through day seven. Cells (1 x 10^5 cells/cm^2) were inoculated for testing in both sets of flasks. Hydrogen peroxide (1 mL of 0.3%) was added to each flask of one set of seven T-25 flasks. The cells were incubated at 37°C, 5% carbon dioxide supplied incubator in between days of testing. On each day, medium was removed from both flasks designated for that day with a Powerpette plus Pipette Controller (Jencons Scientific; Radnor, PA, USA). Sterile filtered phosphate buffered saline (PBS) (3 mL) (Atlanta Biological; Flowery Branch, GA, USA) was added to the flasks to rinse off dead cells and remove protective nutrients of the FBS from the cells. After removing the phosphate buffered saline, 2 mL of 0.25% trypsin-EDTA (Sigma-Aldrich; St. Louis, MO) were added to the flask. The flask was placed in the incubator for 5 minutes to dislodge the cells from the bottom of the flask. After the cells were removed from the incubator, 5 mL of complete growth medium were added to the flask. The medium and cells were relocated into a centrifuge tube (Falcon; Tewksbury, MA, USA). The tube was centrifuged at 1000 RPM for five minutes in a centrifuge (Thermo Scientific; Waltham, MA, USA) [10, 11, 12, 13, 14, 15].
After the growth medium and cells were centrifuged, the supernatant was removed from the centrifuge tube. The cells were resuspended in 5 mL of growth medium to prepare them for counting. On days two, four, and six the growth medium was removed from each flask and replaced with 5 mL of new growth medium. For the one set of seven T-25 flasks with hydrogen peroxide, the hydrogen peroxide was replaced in each flask along with growth medium on those previously specified days.
After the cells were aspirated in the centrifuge tube with the newly added growth medium, 50 µL of the medium and cells were removed with a p200 micropipette (Middleton, WI, USA). Medium and cells (50 µL) were then placed in a micro centrifuge tube. Fifty microliters of 0.2 µm filtered trypan blue solution (Thermo Scientific; Waltham, MA, USA) were added to the same micro centrifuge tube. The medium containing the suspended cells and the trypan blue were aspirated in the micro centrifuge tube. Ten microliters of the mixture were removed from the micro centrifuge tube and placed under a microscope cover glass (Thermo Scientific; Waltham, MA, USA) and placed on top of a hemocytometer counting chamber (Hausser Scientific Partnership; Horsham, PA, USA). Live/dead cell counts were verified under an AE2000 Inverted Phase Contrast Microscope (Motic; Carlsbad, CA, USA) and the results were recorded daily.
The adjusted sets of differential equations were entered into an advanced computing program, MATLAB (MathWorks; Natick, MA, USA). The various parameters were determined and installed. The unknown parameter, υ0 (the rate of CSC growth), was determined by maintaining d3 (the strength of the feedback loop) constant at 0. The rate of cell division, υ0 , was adjusted to different values between 0 and 1. Between each adjustment, the implanted code was run, estimating the total number of cells at day 6 (T=6). These numbers were compared to the data collected. When the number of cells at T=6 in the code matched the collected data, υ0 was determined to be 0.3577. The value of d3 can be adjusted to display how the strength of the feedback loop affects the number of total cells at any given time. MATLAB (MathWorks; Natick, MA, USA) was also able to produce a graphical representation of the growth curve at T=6 and T=20.
Death Curve
Two researchers simultaneously completed the following procedures, one working with MCF-7 cells, and the other MCF-12A cells. One 24-well plate of cells was removed from the incubator. The medium from one set of wells was then removed using an electric pipette and discarded. Then 1mL of phosphate buffered saline (PBS) was added to each well, and the plate was gently slid back and forth 80 times before removing the PBS. Followed by the addition of 0.5 mL of trypsin to each well, and the plate was once again gently slid back and forth 80 times before removing the trypsin. The plate was incubated for 10 minutes at 37µC. The plate was removed from the incubator and 1mL of fresh medium was added to each well of the column. Using the electric pipette, the wells were powerfully aspirated to remove the cells from the bottom of the well. Cells (50µL) were removed from each well and placed into separate micro centrifuge tubes. The plate was then returned to the incubator. Trypan blue dye (50µL) was added to each micro centrifuge tube and mixed via aspiration. Ten microliters of the cell/dye solution were removed and loaded into a hemocytometer chamber. Another 10µL were removed and inserted into the other hemocytometer chamber. Both live and dead cell counts were obtained and recorded for each of the micro centrifuge tubes. This process was then repeated for each cell line every, one hour for 19 hours.
Results
Growth Curve
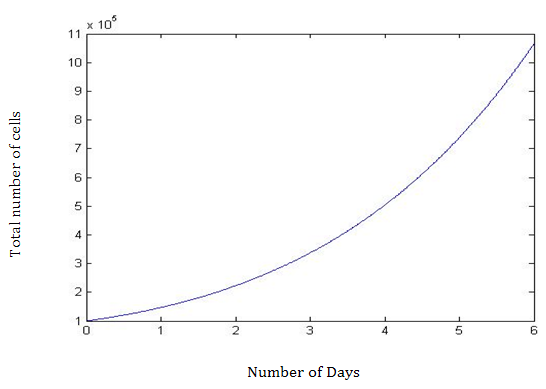
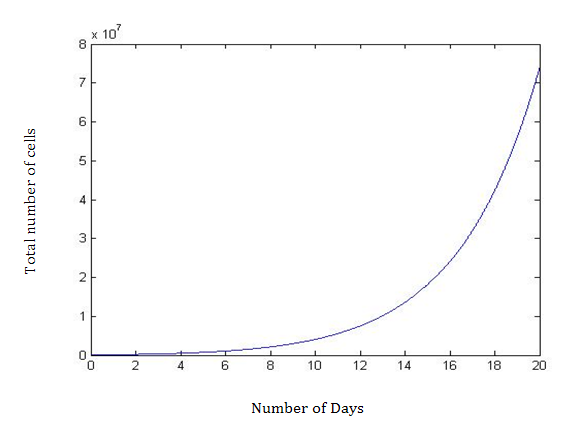
Using MATLAB, the advanced computing software, the differential equations with the feedback loop estimated the total number of cells at day 6 and the number of CSC, PC, and TDC. Results are depicted in (Tables 1-3). The novel parameter d3 represents the death rate of the TDC and therefore the strength of the feedback loop. As d3 increases, the number of cells also increases. This is demonstrated in Table 4, and estimates the total number of cells at 6, 10, 15, and 20 days. The effect of the feedback becomes more pronounced with more days. On Day 6 (T=6), there is an increase of 30,000 total cells when increasing d3 from 0 to 1 in 0.25 increments, an insignificant increase of only 2.5%. However, at T=20, the increase is nearly 41%, which is very significant. Therefore, adding the feedback loop produces the desired higher cell counts in the computer simulation (Figures 1 & 2).
| Flask Day 1 | Flask Day 2 | Flask Day 3 | Flask Day 4 | Flask Day 5 | Flask Day 6 | ||
|---|---|---|---|---|---|---|---|
| Trial 1 | 180000 | 348000 | 112000 | 780000 | 568000 | 752000 | |
| Trial 2 | 292000 | 340000 | 152000 | 600000 | 696000 | 896000 | |
| Trial 3 | 212000 | 316000 | 488000 | 136000 | 376000 | 1582000 | |
| Trial 4 | 292000 | 288000 | 268000 | 420000 | 668000 | 1128000 | |
| Trial 5 | 232000 | 156000 | 1028000 | 312000 | 476000 | 1040000 | |
| Trial 6 | 272000 | 112000 | 446000 | 480000 | 548000 | 1000000 | |
| Average | 246667 | 260000 | 415667 | 454667 | 555333 | 1066333 | |
| Std/Dev | 46072 | 100781 | 336049 | 223924 | 119289 | 283770 | |
| DEAD | Flask Day 1 | Flask Day 2 | Flask Day 3 | Flask Day 4 | Flask Day 5 | Flask Day 6 | |
| Trial 1 | 84000 | 136000 | 20000 | 20000 | 16000 | 16000 | |
| Trial 2 | 72000 | 32000 | 20000 | 28000 | 12000 | 24000 | |
| Trial 3 | 52000 | 100000 | 16000 | 44000 | 24000 | 28000 | |
| Trial 4 | 48000 | 32000 | 16000 | 28000 | 36000 | 32000 | |
| Trial 5 | 56000 | 64000 | 44000 | 32000 | 56000 | 40000 | |
| Trial 6 | 28000 | 96000 | 56000 | 40000 | 48000 | 24000 | |
| Average | 56667 | 76667 | 28667 | 32000 | 32000 | 27333 | |
| Std/Dev | 19500 | 41447 | 17049 | 8764 | 17709 | 8165 |
Table 1: Raw data of MCF-7 cells without hydrogen peroxide in medium. Units = Cells/mL.
| Flask Day 1 | Flask Day 2 | Flask Day 3 | Flask Day 4 | Flask Day 5 | Flask Day 6 | ||
|---|---|---|---|---|---|---|---|
| Trial 1 | 964000 | 816000 | 672000 | 256000 | 248000 | 136000 | |
| Trial 2 | 760000 | 832000 | 516000 | 320000 | 168000 | 112000 | |
| Trial 3 | 788000 | 1240000 | 612000 | 404000 | 124000 | 180000 | |
| Trial 4 | 720000 | 1144000 | 628000 | 188000 | 268000 | 880000 | |
| Trial 5 | 556000 | 1180000 | 572000 | 380000 | 100000 | 128000 | |
| Trial 6 | 544000 | 1112000 | 724000 | 292000 | 132000 | 100000 | |
| Average | 722000 | 1054000 | 620666 | 306666 | 173333 | 256000 | |
| Std/Dev | 157231 | 183229 | 73165 | 79867 | 69405 | 306923 | |
| DEAD | Flask Day 1 | Flask Day 2 | Flask Day 3 | Flask Day 4 | Flask Day 5 | Flask Day 6 | |
| Trial 1 | 124000 | 152000 | 268000 | 220000 | 232000 | 412000 | |
| Trial 2 | 164000 | 420000 | 220000 | 256000 | 212000 | 388000 | |
| Trial 3 | 152000 | 84000 | 284000 | 632000 | 300000 | 452000 | |
| Trial 4 | 108000 | 92000 | 216000 | 160000 | 356000 | 312000 | |
| Trial 5 | 124000 | 132000 | 248000 | 216000 | 224000 | 388000 | |
| Trial 6 | 156000 | 168000 | 332000 | 196000 | 384000 | 272000 | |
| Average | 138000 | 174666 | 261333 | 280000 | 284666 | 370666 | |
| Std/Dev | 22306 | 124596 | 43573 | 175289 | 73383 | 66485 |
Table 2: Raw data of MCF-7 cells with hydrogen peroxide in medium. Units = Cells/mL.
| Total | CSC | PC | TDC |
|---|---|---|---|
| 1,066,520 | 186,280 | 475,920 | 404,320 |
Table 3: Estimation of cell total numbers at day 6.
| d /Time 3 | T=6 | T=10 | T=15 | T=20 |
|---|---|---|---|---|
| 0 | 1,066,520 | 4,057,904 | 18,100,477 | 73,925,296 |
| 0.25 | 1,077,143 | 4,214,402 | 20,037,312 | 89,786,761 |
| 0.5 | 1,084,015 | 4,301,069 | 20,999,857 | 97,286,476 |
| 0.75 | 1,088,739 | 4,355,215 | 21,570,230 | 101,649,458 |
| 1.0 | 1,092,153 | 4,392,016 | 21,946,653 | 104,503,688 |
Table 4: Representation of cell death rate and feedback loop strength via unknown variable d3.
Death Curve
Estimates of the key Bratus model parameters for our cells were obtained using a two-step method. First, using the data collected from the growth curve, we implemented ordinary least squares regression analysis in R to estimate r1 and r2, the untreated growth rates for the cancer and normal cells respectively. Once these values were obtained, a MATLAB simulation of the Bratus model using the statistically estimated values of r1 and r2 and other parameters as given in Bratus was run to numerically estimate k1 and k2, the extract killing rates for the cancer and normal cells respectively (Table 5). The estimates obtained are as follows:
| Estimation Table | Bratus Estimation | Our Estimation |
|---|---|---|
| r 1 | 0.000986 | 0.21336 |
| r 2 | 0.0005205 | 0.17413 |
| k 1 | 0.0178 | 0.42697 |
| k 2 | 0.00411 | 0.057999 |
Table 5: Estimates using the Bratus model and our method.
In table 5 above, the value for k1 is much larger than k2 in our estimation. This is significant because it represents that the therapeutic treatment is killing the cancer cells more effectively than it is killing the normal cells. In other words, the treatment is killing the cancer cells while minimizing the harm done to the normal cells. Next, using our estimated parameters, we ran another MATLAB simulation and compared our results to those of Bratus (Figure 3).
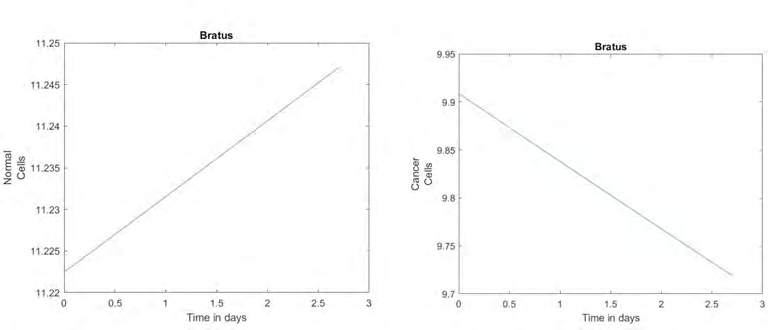
Above are the graphs that are generated by the simulation in MATLAB using the parameters in Bratus’ paper. The reason that cancer cells appear to be dying off at a linear rate is because the Bratus paper modeled an entire treatment regimen, which results in the number of cancer cells eventually being 0. However, the normal cells in this simulation are growing at a linear rate. This shows that the treatment used in Bratus affected the growth of the normal cells since their growth should be exponential.
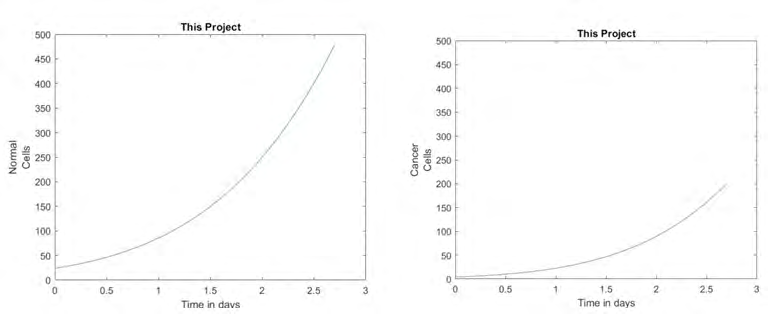
These next graphs are the graphs generated by the same simulation using the parameters that were estimated in this project. In the graph of the normal cells on the left, the growth is exponential. This means that the treatment used in this project had a minimal effect on the growth of the normal cells, which is an important part of finding an effective treatment option. Looking at the graph of the cancer cells, we see that the cells are still growing; however their exponential growth has been dramatically reduced by the treatment. The reason for the cancer cell growth is that we were only able to model for a single treatment. The simulation that was run in MATLAB shows that the treatment was effective in treating the cancer cells while minimizing the damage done to the normal cells (Figure 4).
Conclusion
Growth Curve
Given these results, our inferential data supported our hypothesis of a feedback loop causing greater cell proliferation. The first growth curve, which was the 6-day experiment conducted, was similar to Liu, et al. results. However, once we utilized the advanced computing software, MATLAB, and inserted the data’s numerical values into the equation we modified, the curve was steeper. Although the application of the modified equation gave the results desired, further proof will be pursued in the future with a 20-day experimentation of MCF-7 cells here at Anderson University in order to supply more concrete evidence.
Death Curve
After performing this experiment, there is conclusive evidence that the extracts were effective in treating the MCF- 7 breast cancer cells while minimizing the damage to the healthy MCF-12A cells. The growth of MCF-7 cells was indeed reduced by the treatment regimen. However, the evidence is inconclusive as to a minimum dosage amount that would treat the entirety of cancerous cells. It was determined that the cells could not be fully killed with one treatment, no matter how large the dose.
Acknowledgment
Funding: Dabo’s All In Team Foundation
References
-
Sharma GN, Dave R, Sanadya J, Sharma P, Sharma KK (2010) Various types and management of breast cancer: an overview. J Adv Pharm Technol Res 1(2): 109-126.
-
Liu X, Johnson S, Liu S, Kanojia D, Yue W, et al. (2013) Nonlinear growth kinetics of breast cancer stem cells: implications for cancer stem cell targeted therapy. Scientific Reports 3: 2473.
-
Korkaya H, Kim GI, Davis A, Malik F, Henry NL, et al. (2012) Activation of an IL6 inflammatory loop mediates trastuzumab resistance in HER2+breast cancer by expanding the cancer stem cell population. Mol Cell 47(4): 570-584.
-
Ham M, Moon A (2013) Inflammatory and microenvironmental factors involved in breast cancer progression. Archives of Pharmacal Research 36(12): 1419-1431.
-
Bratus A, Samokhin I, Yegorov I, Yurchenko D (2017) Maximization of viability time in a mathematical model of cancer therapy. Mathematical Biosciences 294: 110- 119.
-
Are Phytoestrogens Good or Bad for You? Know from Dr. Axe.
-
NCI Dictionary of Cancer Terms [Nci App Module Page].
-
Tamoxifen: Drug Information (2017).
-
Ziegler RG (2004) Phytoestrogens and breast cancer. The American Journal of Clinical Nutrition 79(2): 183-184.
-
Fritz H, Seely D, Flower G, Skidmore B, Fernandes R, et al. (2013) Soy, Red Clover, and Isoflavones and Breast Cancer: A Systematic Review. PLOS ONE 8(11): 1-18.
-
Mannella P, Tosi V, Russo E, Zullino S, Pancetti F, et al. (2012) Effects of red clover extracts on breast cancer cell migration and invasion. Gynecological Endocrinology 28(1): 29-33.
-
Patisaul HB, Jefferson W (2010) The pros and cons of phytoestrogens. Front Neuroendocrinol 31(4): 400-419.
-
Peterson TG, Ji GP, Kirk M, Coward L, Falany CN, et al. (1998) Metabolism of the isoflavones genistein and biochanin A in human breast cancer cell lines. Am J Clin Nutr 68(6): 1505-1511.
-
Wang YH, Li KJ, Mao L, Hu X, Zhao WJ, et al. (2013) Effects of exogenous zinc on cell cycle, apoptosis and viability of MDAMB231, HepG2 and 293 T cells. Biological Trace Element Research 154(3): 418-426.
-
Yazan LS, Rahman NA, Chan KW, Abd Ghani WNHW, Tor YS, et al. (2016) Phenolics-saponins rich fraction of defatted kenaf seed meal exhibits cytotoxicity towards cancer cell lines. Asian Pacific Journal of Tropical Biomedicine 6(5): 404-409.
- The Muculent Bleb-Mucinous Cystic Neoplasm-Hepatobiliary Region
- Insulin Sensitizers as Anti-Aging Agents: Unveiling Synergies with Albumin, GLP-1RA, Klotho Protein, and Metformin in the Quest to Combat Aging
- Reprogramming of GLP-1 Response at Prediabetes for the Prevention of Type 2 Diabetes: The Role of Albumin and GLP-1 Receptor Agonists
- The Mingled Allies-Combined Hepatocellular Carcinoma and Cholangiocarcinoma
- Compilation and Embodiment-Leydig Cell Tumour Testis
- Glucolipotoxicity: A Novel Different Perspective on the Causes of Cancer