A Novel Two-Stage Intutitonistic Fuzzy Approach Proposal Based on Anp and Mathematical Modelling for Risk Assessment
Risk assessment (RA) is an activity performed to determine the hazards that may exist in the work areas. RA deals with complex expressions including hesitancy as it contains linguistic data. This study proposes a novel two-stage intuitionistic fuzzy RA based on Intuitionistic Fuzzy Analytic Network Process (IF-ANP) and intuitionistic mathematical modeling. In the first stage, by considering the effects between each risk factor (RF) and relations between FMs, importance weights of RFs are computed and the rankings of FMs are obtained with IF-ANP. In the second stage, an intuitionistic mathematical model has been established reflecting the real constraints of the company as cost, safety level and the rankings’ weights of FMs obtained from IF-ANP to determine the FMs that must be prevent firstly. Goals of the mathematical model are minimizing the cost and the risk level of the assembly area. Environmental, administrative, cost and risk structure related factors are considered as main RFs to rank nine FMs.
Introduction
Risk assessment (RA) is an indispensable part of the occupational health and safety management system. There are many different RA approaches in the literature as Failure Modes and Effects Analysis (FMEA), Fine Kinney, Event Tree Analysis (ETA), Fault Three Analysis (FTA), L Matrix, X Matrix etc.. Among these approaches, FMEA is one of the most common used one for RA. Although FMEA is a prominent and powerful approach that determines potential failure modes (FMs), this method has many deficiencies that need to overcome. First of all, FMEA is utilized by a team including members who may come from different departments and may have different levels of knowledge’s, experiences. Because of this, their evaluations have subjectivity. This subjectivity cannot be aggregated accurately to obtain a collective solution. Some members of team may not have enough expertise to precisely evaluate FMs. Therefore, their evaluations usually have some vagueness, affirmation, negation, and hesitation. FMs are evaluated due to risk factors (RFs) considered in FMEA before they emerge. This evaluation is an estimation related to the future so; it is a hard work to assign direct and correct scores to RFs by a crisp manner. Three RFs in FMEA are accepted that they have same importance for all FMs. However these three RFs have relatively different importance for each FM in real-life RA situations. These different importance values cannot be considered and computed with traditional FMEA. Therefore in this study, Analytic Network Process (ANP) is used to determine the rankings of FMs to reflect the interrelations between RFs. Additionally, intuitionistic fuzzy mathematical model is established to consider the real constraints of the firm identifying the FMs that must be avoided primarily.
When the literature is reviewed in term of FMEA, it was seen that there too many studies which apply this technique. For this reason, a brief review was made in the study.
Chang, et al. [1] aggregated fuzzy logic with grey theory to advance FMEA. Chang, et al. (2001) implemented Grey theory in FMEA. Braglia [2] integrated Analytic Hierarchy Process (AHP) with FMEA. Shahin (2004) suggested FMEA and Kano Model integration to identify RPN by classifying severity with respect to perceptions of customers. Garcia and Schirru [3] applied Data Envelopment Analysis (DEA) to optimize the weights of RFs to measure the maximum risks of each FM. Tay and Lim (2006) proposed a generic method to simplify the fuzzy logic-based FMEA methodology by reducing the number of rules needed to compute Fuzzy Risk Priority Number (FRPN). Yang, et al. [4] recommended a fuzzy rule-based Bayesian reasoning approach to prioritize failures. Chin, et al. [5, 6] utilized DEA for computing the geometric means of weights giving the maximum and the minimum RPN for each FM. Liu, et al. [7] applied the fuzzy evidential reasoning along with the grey theory for prioritizing the FMs. Zammori and Gabbrielli [8] combined FMEA with Analytic Network Process (ANP). Mzrak Özfrat [9] integrated fuzzy prioritization approach with FMEA to obtain objective evaluation results. Liu, et al. (2015) implemented grey relational projection and D numbers to represent the uncertain information for ranking the FMs as a group-decision FMEA approach. Bozdağ, et al. [10] used interval type-2 fuzzy sets for FMEA. Liu, et al. [11] advanced FMEA with hesitant 2-tuple linguistic term sets and an extended QUALIFLEX integration to propose a new risk prioritization. Jiang, et al. (2016) combined Dempster-Shafer evidence theory and FMEA to reassign the basic believe assignment taking into consideration a reliability coefficient based on evidence distance. Zhao, et al. [12] developed a novel approach for FMEA based on interval-valued intuitionistic fuzzy sets (IVIFSs) and MULTIMOORA method to obtain a more accurate ranking of FMs. They utilized, interval-valued intuitionistic fuzzy (IVIF) continuous weighted entropy for RFs’ weightings and the IVIF-MULTIMOORA method to compute the risk priority of FMs. Huang, et al. [13] suggested linguistic distribution assessments to represent risk evaluations of FMEA team members and employed an improved TODIM (an acronym in Portuguese of interactive and multi criteria decision making) method to determine the risk priority of FMs by considering both subjective weights and objective weights of RFs. Li, et al. [14] proposed a new evidential FMEA using linguistic terms. They used linguistic terms to structure assessment distributions of experts. Certa, et al. (2017) recommended ELECTRE TRI-based approach to classify FMs in terms of predefined and ordered risk classes. Kolios, et al. [15] performed fuzzy TOPSIS to analyze and to determine the most critical FMs via developing a distinct ten-parameter criticality model to evaluate the risks associated with subsea control module failures in offshore oil and gas industry. Rezaee, et al. [16] integrated FMEA and DEA to determine failures in the stone industry using. The imposed costs related to any failure in the system were considered to order failures instead of the use of RPN. Delice and Can [17] carried out a new RA approach integrating FMEA and MABAC based on a stochastic evaluation process to rank FMs in an assembly line. Lo and Liou [18] advanced a novel model using Multi-criteria Decision Making (MCDM) in combination with grey theory for FMEA. The approach has several advantages, such as being able to add the expected cost into the original RPN to reflect the actual resource limitations, considering the different weights of severity, occurrence, detectability, and cost based on the best–worst method in RPN calculation, and using the grey interval linguistic variables to manage information’s uncertainty. Tooranloo, et al. [19] prioritized failures for evaluating FMs in knowledge management in Khuzestan Oil and Gas Company. The existing uncertainties in quantitative evaluations conducted by individuals, a group decision-making approach in an intuitionistic fuzzy environment was proposed in this study using the FMEA technique in addition to TOPSIS to assess various FMs more precisely.
As seen from the literature, FMEA approach was aggregated with different MCDM methodologies and its procedure was integrated with fuzzy sets, intuitionistic fuzzy sets, hesitant fuzzy sets. To the best of our knowledge, FMEA has not been combined with intuitionistic fuzzy goal programming (GP) to reflect the real constraints of the firms in the process of prioritizing FMs. Additionally, interactions between FMs has not been modeled in FMEA studies with ANP. However, in real life RA cases, a FM can cause to emerge another FM or FMs. So, this study provides a new view point for RA based on FMEA and it can help experts to decide the most important FMs to prevent primarily in a detailed manner.
The rest of the study is organized as follows. In the second section, Intuitionistic Fuzzy Programming (IFP) and the proposed approach are explained. In the third section, application of the proposed approach is given. In the fourth section, conclusions and future directions are shared.
**Method**
Intuitionistic Fuzzy Programming
IFP was first introduced by Angelov [20]. The model aims to maximize the difference between the smallest membership degree for objective, intuitionistic fuzzy constraints and the biggest non-membership degree for objective, intuitionistic fuzzy constraints.
$$\text{Max}(\alpha - \beta)$$
subject to
$$\alpha \leq \mu_o(x), a = 1, \dots, p + q$$ $$ \rho \geq v _ {a} (x), a = 1, \dots , p + q \tag {3} $$
$$ \alpha \geq \beta (4) $$
$$ \alpha + \beta \leq 1 $$
$$ \beta \geq 0 (5) $$
where; α is the smallest membership degree of objective and constraints. β is the biggest non-membership degree of objective and constraints.
The Proposed Approach
The proposed approach has two stages as ranking FMs via using ANP and utilizing intuitionistic fuzzy mathematical model to determine the most important FM/FMs considering real constraints of the firm. The steps of the proposed approach are given below.
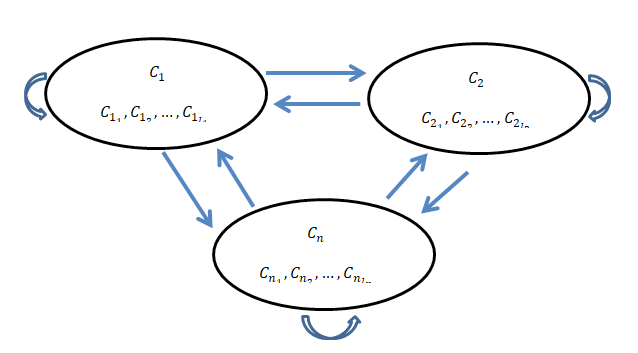
First Stage: Determining importance weights of alternatives • Step 1: Construct the model and structure the problem, form expert group Defined criteria and alternatives are expressed as a cluster and a relationship diagram is generated between them. This structure is built on a detailed analysis of the system. The problem should be stated clearly and decomposed into a rational system similar to a network. This structure can be obtained by experts through brainstorming or other appropriate methods.
The clusters are denoted as
$$ C _ {j} = \left\{C _ {1}, C _ {2}, \dots , C _ {n} \right\}, (j = 1, \dots , n) \mathrm {a n d} $$ the criteria are indicated as { } ( )( ) 1 2 1 1 1 , , , ; 1, , 1, , t l j n n C C C C j n t l = … = … = … . FMs are also represented as { } ( ) 1 2 , , , , 1, , s p FM FM FM FM s p = … = … and r experts $$ E _ {k}; k = 1, \dots , r $$
form the expert team. Figure 1 shows the network structure.
• Step 2: Assign the weight of each expert The weight of each expert is indicated as ( ) ( ) , , ; 1, , k k k k WE v k v µ π = = … . WEk is assigned considering working experience of each expert by using Table 1. Then, WEk is transformed into crisp values as k β providing 0 k β > l $$ \sum_ {k = 1} ^ {l} \beta_ {k} = 1 $$
by using Eq.(6).
and
1 1 k k β $$ k = \frac {\left(\mu_ {k} + \pi_ {k} \left(\frac {\mu_ {k}}{\mu_ {k} + v _ {k}}\right)\right)}{\sum_ {k = 1} ^ {l} \left(\mu_ {k} + \pi_ {k} \left(\frac {\mu_ {k}}{\mu_ {k} + v _ {k}}\right)\right)} $$ $$ \beta_ {k} = \frac {\left(\mu_ {k} + \pi_ {k}\right) \left(\frac {\mu_ {k}}{\mu_ {k} + v _ {k}}\right)}{\sum_ {k = 1} ^ {l} \left(\mu_ {k} + \pi_ {k}\right) \left(\frac {\mu_ {k}}{\mu_ {k} + v _ {k}}\right)} $$ ( k k k k k k l k k k k k k v (6) ( ) v
1
| Linguistic variable | WEK(μK, VK, ΠK) |
|---|---|
| Very experienced | (0.90, 0.05, 0.05) |
| Experienced | (0.70, 0.20, 0.05) |
| Moderately experienced | (0.50, 0.40, 0.10) |
| Inexperienced | (0.25, 0.60, 0.15) |
| Very inexperienced | (0.10, 0.80, 0.10) |
Table 1: Intuitionistic Fuzzy Scale for _WE__k_ values [21].
• Step 3: Structure the pairwise comparison matrices of criteria in terms of risk levels that they can create Pairwise comparison matrices of criteria in terms of risk levels are formed for each expert by using intuitionistic fuzzy risk level scale given in Table 2.
| Definition | Risk scale | IFN | Reciprocal IFN |
|---|---|---|---|
| It creates equal risk | 1 | (0.02, 0.18, 0.80) | (0.02, 0.18, 0.80) |
| Intermediate value | 2 | (0.06, 0.23, 0.70) | (0.06, 0.23, 0.70) |
| It creates a little more risk | 3 | (0.13, 0.27, 0.60) | (0.13, 0.27, 0.60) |
| Intermediate value | 4 | (0.22, 0.28, 0.50) | (0.22, 0.28, 0.50) |
| It creates more risk | 5 | (0.33, 0.27, 0.40) | (0.33, 0.27, 0.40) |
| Intermediate value | 6 | (0.47, 0.23, 0.30) | (0.47, 0.23, 0.30) |
| It creates too much risk | 7 | (0.62, 0.18, 0.20) | (0.62, 0.18, 0.20) |
| Intermediate value | 8 | (0.80, 0.10, 0.10) | (0.80, 0.10, 0.10) |
| It creates risks at an extreme level | 9 | (1.00, 0.00, 0.00) | (1.00, 0.00, 0.00) |
Table 2: Intuitionistic Fuzzy Risk Level Scale [22].
The intuitionistic fuzzy evaluation matrix for each cluster is as follows. Pairwise comparison matrix of each expert for cluster is demonstrated as k W is given in Eq.(7).
$$ \left[ W _ {i i} ^ {k} \right] = \left[ \begin{array}{c c c c} \square_ {w _ {1 1}} ^ {k} & \square_ {w _ {1 2}} ^ {k} & \dots & \square_ {w _ {1 l _ {n}}} ^ {k} \\ \square_ {w _ {2 1}} ^ {k} & \square_ {w _ {2 2}} ^ {k} & \dots & \square_ {w _ {2 l _ {n}}} ^ {k} \\ \vdots & \vdots & \vdots & \vdots \\ \square_ {w _ {l _ {n} 1}} ^ {k} & \square_ {w _ {l _ {n} 2}} ^ {k} & \dots & \square_ {w _ {l _ {n} l _ {n}}} ^ {k} \end{array} \right] $$ � � � k k k l w w w
11 12 1 n
k k k k l ii
w w w W
21 22 2 n
k k k l l l l w w w
1 2 n n n n (7)
where,
i refers to the number of criteria in relation.
• Step 4: Compute the consistency index of pairwise
comparison matrix of each expert
Consistency indexes (CIs) of
k W
are computed as in Eq.(8)
$$ \begin{array}{l} [ 2 3 ]. \\ C R = \frac {\left(\lambda_ {\max } - l _ {n}\right) / \left(l _ {n} - 1\right)}{R I} (8) \\ \end{array} $$ ( ) max nl λ − () is the average value of Π(x) in pairwise comparison matrix of each expert. 𝜆max is the biggest eigen value obtained via dividing weight vector by related relative importance value. RI defines the randomness index (RI) and it can take different values according to ln. Table 3 shows the RI for different ln values [22].
| l n | 1 | 2 | 3 | 4 | 5 | 6 | 7 | 8 | 9 | 10 | 11 | 12 | 13 | 14 | 15 |
|---|---|---|---|---|---|---|---|---|---|---|---|---|---|---|---|
| RI | 0 | 0 | 0.58 | 0.9 | 1.12 | 1.24 | 1.32 | 1.41 | 1.45 | 1.49 | 1.51 | 1.48 | 1.56 | 1.57 | 1.59 |
Table 3: RI values [23].
• Step 5: Form the aggregated pairwise comparison matrices k W matrices are aggregated with intuitionistic fuzzy weighted geometric average operator (IFWG) as in Eq.(9).
( ) 1 2 1 1 1 , , , ( ,1 (1 ) k k k k k k
$$ \tilde {p} _ {i} = \left(\tilde {p} _ {1}, \tilde {p} _ {2}, \dots , \tilde {p} _ {j}\right) = \prod_ {j = 1} ^ {k} p _ {j} ^ {\beta_ {k}} = \left(\prod_ {j = 1} ^ {k} \mu_ {j} ^ {\beta_ {k}}, 1 - \prod_ {j = 1} ^ {k} (1 - v\right) $$ j j j j j j j IFWG p p p p v β β β β µ (9) In this way, aggregated pairwise comparison matrix of k W is obtained as in Eq.(10). The element of k W is denoted as $$ \tilde {w} _ {l _ {n} l _ {n}} = \left(\mu_ {l _ {n} l _ {n}}, v _ {l _ {n} l _ {n}}, \pi_ {l _ {n} l _ {n}}\right) \cdot \tag {10} $$ • Step 6: Form the super matrix and determine limit super matrix Let the clusters of a decision system be CLi, i= 1,2,…., n and each cluster i has li elements. The local priority vectors obtained in Step 5 are grouped and located in an appropriate positions in a super matrix based on the flow of influence from a cluster to another cluster, or from a cluster to itself as in the loop. Each pairwise comparison matrix is denoted as W . S defined as super matrices consists of matrices W as in Eq.(11).
W W W $$ \left[ \tilde {S} \right] = \left[ \begin{array}{c c c c} W _ {1 1} & W _ {1 2} & \dots & W _ {1 n} \\ W _ {2 1} & W _ {2 2} & \dots & W _ {2 n} \\ \vdots & \vdots & \vdots & \vdots \\ W _ {n 1} & W _ {n 2} & \dots & W _ {n n} \end{array} \right] $$ (11)
11 12 1 n W W W S
21 22 2 n
W W W
1 2 n n nn • Step 7: Synthesize the results Raising a matrix to powers gives the long-term relative influences of the elements on each other. To achieve a convergence on the importance weights, the weighted super matrix is raised to the power of 2k-1, where k is an arbitrarily large number, and this new matrix is called the limit super matrix.
The limit super matrix has the same form as the weighted super matrix, but all the columns of the limit super matrix are the same. By normalizing each block of this super matrix, the final priorities of all the elements in the matrix can be obtained. If the super matrix formed in Step 6 covers the whole network, the priority weights of alternatives can be found in the column of alternatives in the normalized super matrix. On the other hand, if a super matrix is only composed of interrelated clusters, additional calculations must be made to obtain the overall priorities of the alternatives. The alternative with the highest overall priority should be the one selected.
Second Stage: Determine the FMs having the top priority considering real constraints In this study, the new model is advanced by adding crisp constraints into model. In this way, crisp and intuitionistic fuzzy constraints can be considered at the same time. Additionally, deviation from the goal of crisp constraints can be minimized. The developed model is given in between Eq.(12) and (19).
$$ M a x \left(\alpha - \rho - d _ {s p} ^ {-} + d _ {s p} ^ {+}\right) \tag {12} $$ subject to $$ C C _ {i} x - d _ {s p} ^ {+} + d _ {s p} ^ {-} = 1 \tag {13} $$ $$ \alpha \leq \mu_ {a} (x), a = 1, \dots , d + h \tag {14} $$ $$ \rho \geq v _ {a} (x), a = 1, \dots , d + h \tag {15} $$ $$ \alpha \geq \rho (1 6) $$ $$ \left| \alpha + \rho \leq 1 (1 7) \right| $$ $$ \rho \geq 0 (1 8) $$
0 x ≥ (19)In this context, different intuitionistic fuzzy goal programming (GP) models have been set up to prioritize FMs for the reason that real constraints are not known clearly and managers, experts have doubts about the information that they give. Since the cost and safety level constraints are the intuitionistic fuzzy values, these are defuzzified using Eq. (20) in the modeling.
For defuzzification of triangular IFN ( ) ( )( ) ' ' 1 2 3 1 2 3 , , , , R a a a a a a a = Eq. (20) is used [24].
( ) ( )( ) ( )( ) ( ) ' ' ' ' '2 '2 3 1 2 3 1 3 1 1 2 3 3 1
$$ (\tilde {a}) = \frac {1}{3} \left[ \frac {\left(a _ {3} ^ {\prime} - a _ {1} ^ {\prime}\right) \left(a _ {2} - 2 a _ {3} ^ {\prime} - 2 a _ {1} ^ {\prime}\right) + \left(a _ {3} - a _ {1}\right) \left(a _ {1} + a _ {2} + a _ {3}\right) + 3 \left(a _ {3} ^ {\prime 2} - a _ {1} ^ {\prime 2}\right)}{a _ {3} ^ {\prime} - a _ {1} ^ {\prime} + a _ {3} - a _ {1}} \right] $$
2 2 3 1 3 a a a a a a a a a a a a R a a a a a
' ' 3 1 3 1
(20) Where ( ) R ais the defuzzfy version of .
Application of the Proposed Approach
First Stage: Determining importance weights of alternatives • Step 1: Construct the model and structure the problem, form expert group The proposed approach was utilized for RA in an assembly line of a firm in electromechanical sector producing air insulated metal shielded cells. 9 FMs { } ( ) 1 2 9 , , , , 1, ,9 s FM FM FM FM s … … depicted in Table 4 are identified by 4 experts Ek; k= 1,2,3,4 in the assembly line.
| Nu | FMs (FM) s | Definition |
|---|---|---|
| 1 | FM 1 | Working in a narrow field |
| 2 | FM 2 | Irregular placement around the line |
| 3 | FM 3 | Manual handling heavy loads |
| 4 | FM 4 | The lack of appropriate job descriptions |
| 5 | FM 5 | Using worn hand tools |
| 6 | FM 6 | Noisy assembly area |
| 7 | FM 7 | Inadequate lighting in the assembly area |
| 8 | FM 8 | Vibration exposure |
| 9 | FM 9 | Undefined material transfer paths |
Table 4: FMs in assembly line.
First expert E1 has an A class work safety expert certificate and he has 10 years working experiences in the firm. Second expert (E2) works as an electric electronic engineer and he has 15 years experiences in electro mechanic sector. He is responsible for the assembly line. Third expert (E3) has B class work safety expert certificate and he has working in the firm for 5 years. Fourth expert (E5) has working for 10 years in the firm as a production manager who responsible for air insulated metal shielded cells manufacturing. 5 criteria and alternative clusters Cj={C1,C2,C3,C4,C5} are identified as environmental factors (C1), administrative factors (C2), risk structure related factors (C3), cost (C4) and failure modes (FMs) respectively. Environmental factors (C1) includes five sub-criteria
1 2 5 1 1 1 1 { , ,..., } t C C C C = ;(j=1) (t= 1,…,5) as awkward working postures
11 C , noise level
2 1 C , cleanliness and arrangement of workplace
31 ( ) C , lighting
4 1 ( ) C , usability
51 C . Administrative factors (C2) covers four sub-criteria of hand tools $$ C _ {2 _ {t}} = \left\{C _ {2 _ {1}}, C _ {2 _ {2}}, C _ {2 _ {3}}, C _ {2 _ {4}} \right\}; $$
;(j=2) (t=1,…,4) as
application of work health and safety procedure
1 2 C , planned maintenance and repair 2 2 C , using machine protectors
3 2 C , using personal protectors
4 2 C . Risk structure related factor (C3) comprises four criteria $$ C _ {3 _ {t}} = \left\{C _ {3 _ {1}}, C _ {3 _ {2}}, C _ {3 _ {3}}, C _ {3 _ {4}} \right\}; [ j = 2 ] $$
(t=1,…,4) as probability
13 C , severity
2 3 C , detection
3 3 C ,
4 3 C . Cost (C4) contains two criteria impact of FM on system reliability $$ C _ {4 _ {t}} = \left\{C _ {4 _ {1}}, C _ {4 _ {2}} \right\}; $$
;(j=4) (t=1,2) as cost of FM
1 4 C and prevention cost
2 4 C .
Figure 2 shows the model construction and problem structuring.
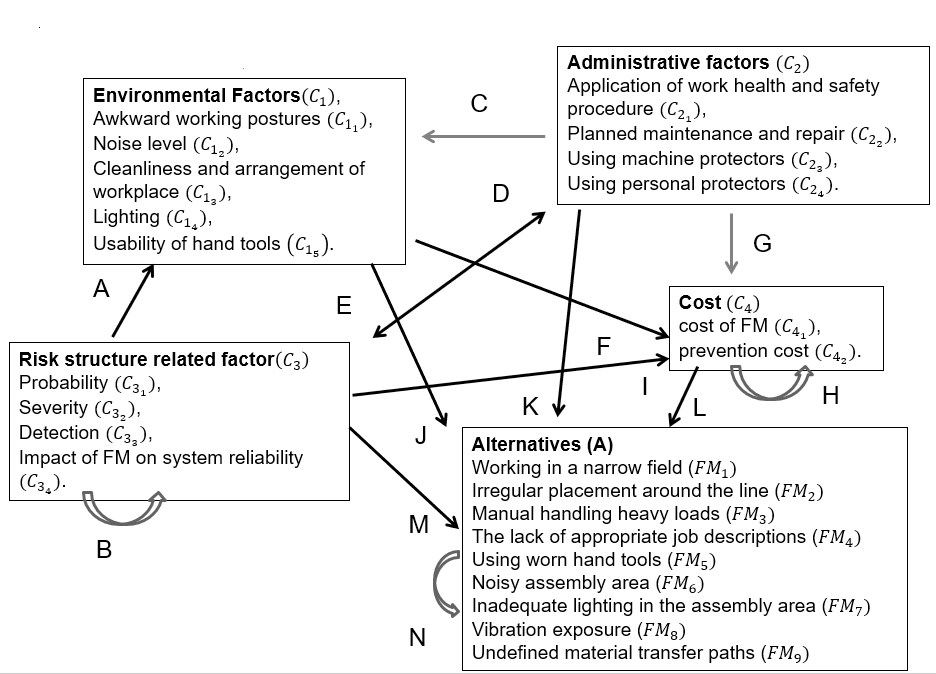
Relationship of criteria and alternatives defined as Table 5.
| Goal | EF | AF | RSF | C | ALT | |
|---|---|---|---|---|---|---|
| Goal | 0 | 0 | 0 | 0 | 0 | 0 |
| EF | 0 | 0 | C | A | 0 | 0 |
| AF | 0 | 0 | 0 | D | 0 | 0 |
| RSF | 0 | 0 | E | B | 0 | 0 |
| C | 0 | F | G | I | H | 0 |
| ALT | 0 | J | K | L | M | N |
Table 5: The general relationship matrix notation for super matrix.
Where each letter represents the relationship matrix. For example, the cost factor affects the environmental factor and it is shown by matrix. matrix indicates the importance level of cost factors according to environmental factors. The same interpretation can be made for the others.
• Step 2: Assign the weight of each expert The weight of the four experts Ek; (k=1,2,3,4)were assigned by using Table 1 and the crisp values of Ek were computed for all experts as β1= 0.25, β2=0.32, β3= 0.18 and β4= 0.25 as in Eq.(6).
• Step 3: Structure the pairwise comparison matrices of criteria in terms of risk levels that they can create k W given in Eq.(7) is formed for each expert. Table 6 shows pairwise comparison matrix 1 W of E1 for risk levels that can be created by criteria according to impact of FM on system reliability
4 3 ( ) C as an example. It represents the relation to . So that is
| C 11 | C 12 | C 13 | C 14 | C 15 | |||||||||||
|---|---|---|---|---|---|---|---|---|---|---|---|---|---|---|---|
| μ | ν | π | μ | ν | π | μ | ν | π | μ | ν | π | μ | ν | π | |
| C 11 | 0.02 | 0.18 | 0.80 | 0.10 | 0.80 | 0.10 | 0.28 | 0.22 | 0.50 | 0.27 | 0.33 | 0.40 | 0.28 | 0.22 | 0.50 |
| C 1 | 0,80 | 0,10 | 0,10 | 0,02 | 0,18 | 0,80 | 0,80 | 0,10 | 0.10 | 0.80 | 0.10 | 0.10 | 0.47 | 0.23 | 0.30 |
| 2 C 13 | 0.22 | 0.28 | 0.50 | 0.10 | 0.80 | 0.10 | 0.02 | 0.18 | 0.80 | 0.23 | 0.47 | 0.30 | 0.06 | 0.23 | 0.70 |
| C 14 | 0.33 | 0,27 | 0,40 | 0,10 | 0,80 | 0,10 | 0,47 | 0.23 | 0.30 | 0.02 | 0.18 | 0.80 | 0.33 | 0.27 | 0.40 |
| C 15 | 0.22 | 0.28 | 0.50 | 0.23 | 0.47 | 0.30 | 0.23 | 0.06 | 0.70 | 0.27 | 0.33 | 0.40 | 0.02 | 0.18 | 0.80 |
Table 6: Pairwise comparison matrix for E1.
• Step 4: Compute the consistency index of criteria’s pairwise comparison matrix of each expert CIs were computed for k W using Eq.(8). CI for
1
1 W is computed as 0.08 as an example.
2 • Step 5: Form the aggregated pairwise comparison matrices � [ ] ii W is formed using Eq.(9) and it is established for criteria in Table 7.
| C 11 | C 12 | C 13 | C 14 | C 15 | |||||||||||
|---|---|---|---|---|---|---|---|---|---|---|---|---|---|---|---|
| μ | ν | π | μ | ν | π | μ | ν | π | μ | ν | π | μ | ν | π | |
| C 11 | 0.02 | 0.18 | 0.80 | 0.17 | 0.33 | 0.50 | 0.26 | 0.20 | 0.54 | 0.25 | 0.22 | 0.54 | 0.20 | 0.37 | 0.43 |
| C 12 | 0.59 | 0.16 | 0.25 | 0.02 | 0.18 | 0.80 | 1.00 | 0.00 | 0.00 | 1.00 | 0.00 | 0.00 | 0.47 | 0.22 | 0.31 |
| C 13 | 0.22 | 0.25 | 0.54 | 0.12 | 0.74 | 0.14 | 0.02 | 0.18 | 0.80 | 0.23 | 0.32 | 0.45 | 0.22 | 0.33 | 0.46 |
| C 14 | 0.26 | 0.25 | 0.49 | 0.17 | 0.55 | 0.28 | 0.33 | 0.21 | 0.46 | 0.02 | 0.18 | 0.80 | 0.41 | 0.26 | 0.33 |
| C 15 | 0.43 | 0.19 | 0.38 | 0.24 | 0.37 | 0.40 | 0.42 | 0.20 | 0.39 | 0.31 | 0.25 | 0.44 | 0.02 | 0.18 | 0.80 |
Table 7: Aggregated pairwise comparison matrix for criteria.
Second Stage: Determine the FMs having the top priority considering real constraints In this stage, the most important FMs that should be prevented primarily are determined considering the priority ranking weights for 9 FMs obtained from the first and second stages and the real constraints of the firm as cost, safety level. Cost constraint defines the limit for the budget of the firm that can be used to prevent FMs. The firm where the application of the proposed approach is performed has a budget as nearly 30.000 TL. Safety level explains the level of the assembly area safety that may be occurred after preventing FMs in the assembly line. This level is estimated by experts. Four experts in the related firm want nearly % 80 safety levels after preventing FMs in the assembly area. The priority ranking weights are complementary constraints and the deviation from these weights is wanted to minimize.
In this context, different intuitionistic fuzzy GP models have been set up to prioritize FMs for the reason that real constraints are not known clearly and managers, experts have doubts about the information that they give. Since the cost and safety level constraints are the intuitionistic fuzzy values, these are defuzzified using Eq. (20) in the modeling. The targets of the mathematical model is identified as minimizing the budget and minimizing the risk level or maximizing the safety level. The objective function of the model consists of maximizing the membership degree. Decision variable is a zero-one integer decision variable defining the FM that should be prevented. These two intuitionistic fuzzy GP models consisting crisp and intuitionistic fuzzy constraints have objective functions including different units. To provide additivity of these different units, it is suggested to realize proportional normalization [25]. To perform proportional normalization, deviation variables are divided to target values of related constraint. With this new method developed, the following results have been obtained as in Table 8 [26, 27, 28].
| Weight | Rank | |
|---|---|---|
| FM1 | 0.1185 | 4 |
| FM2 | 0.1225 | 2 |
| FM3 | 0.0940 | 9 |
| FM4 | 0.1025 | 7 |
| FM5 | 0.1046 | 6 |
| FM6 | 0.0990 | 8 |
| FM7 | 0.1144 | 5 |
| FM8 | 0.1191 | 3 |
| FM9 | 0.1260 | 1 |
Table 8: Rankings of FMs.
When looking at the solution produced by the model, it is seen that x3, x5, x6 and x8 should be prevented firstly as FM3, FM5, FM6 and FM8. In other words, manual handling heavy loads (FM3), using worn hand tools (FM5), noisy assembly (FM6) area and vibration exposure (FM8) should be forestalled primarily.
Conclusion
The proposed approach provides more detailed analysis opportunity than the classical FMEA approach. Interrelations between RFs, clusters and FMs are considered to rank FMs by implementing ANP. In addition, an intuitionistic fuzzy mathematical model is integrated with ANP to provide solutions considered real constraints of the firm and all decision system’s relations.
For the future research, different real constraints may be consisted and different MCDM methods may be utilized for RA. Other RA approaches can be combined with mathematical modeling. The proposed approach can be implemented in different firms or manufacturing area and the obtained results can be compared for these different areas.
References
-
Chang CL, Wei CC, Lee YH (1999) Failure mode and effects analysis using fuzzy method and grey theory. Kybernetes 28(9): 1072-1080.
-
Braglia M (2000) MAFMA: Multi-attribute failure mode analysis. International Journal of Quality and Reliability Management 17(9): 1017-1033.
-
Garcia PA, Schirru R (2005) A fuzzy data envelopment analysis approach for FMEA. Progress in Nuclear Energy 46(3-4): 359-373.
-
Yang Z, Bonsall S, Wang J (2008) Fuzzy Rule-Based Bayesian Reasoning Approach for Prioritization of Failures in FMEA. IEEE Transactions on Reliability 57(3): 517-528.
-
Chin KS, Wang YM, Poon GKK, Yang JB (2009a) Failure mode and effects analysis by data envelopment analysis. Decision Support Systems 48(1): 246-256.
-
Chin KS, Wang YM, Poon GKK, Yang JB (2009b) Failure mode and effects analysis using a group-based evidential reasoning approach. Computers & Operations Research 36(6): 1768-1779.
-
Liu HC, Liu L, Bian QH, Lin QL, Dong N, et al. (2011) Failure mode and effects analysis using fuzzy evidential reasoning approach and grey theory. Expert Systems with Applications 38(4): 4403-4415.
-
Zammori F, Gabbrielli R (2011) ANP/RPN: A multi criteria evaluation of the risk priority number. Quality and Reliability Engineering International 28(1): 85-104.
-
Mızrak Özfırat P (2014) Bulanık önceliklendirme metodu ve hata türü ve etkileri analizini birleştiren yeni bir risk analizi yöntemi. Journal of the Faculty of Engineering and Architecture of Gazi University 29(4): 755-768.
-
Bozdağ E, Asan U, Soyer A, Serdarasan S (2015) Risk prioritization in failure mode and effects analysis using interval type-2 fuzzy sets. Expert Systems with Applications 42(8): 4000-4015.
-
Wang Li-E, Liu Hu-C, Quan Mei-Y (2016) Evaluating the risk of failure modes with a hybrid MCDM model under interval-valued intuitionistic fuzzy environments. Computers & Industrial Engineering 102: 175-185.
-
Zhao H, You JX, Liu HC (2017) Failure mode and effect analysis using MULTIMOORA method with continuous weighted entropy under interval-valued intuitionistic fuzzy environment. Soft Computing 21(18): 5355-5367.
-
Huang J, Li ZS, Liu HC (2017) New approach for failure mode and effect analysis using linguistic distribution assessments and TODIM method. Reliability Engineering & System Safety 167: 302-309.
-
Li Z, Xiao F, Fei L, Mahadevan S, Deng Y (2017) An evidential failure mode and effects analysis using linguistic terms. Quality and Reliability Engineering International 33(5): 993-1010.
-
Kolios AJ, Umofia A, Shafiee M (2017) Failure mode and effects analysis using a fuzzy-TOPSIS method: a case study of subsea control module. International Journal of Multicriteria Decision Making 7(1): 29-53.
-
Rezaee MJ, Salimi A, Yousefi S (2017) Identifying and managing failures in stone processing industry using cost-based FMEA. The International Journal of Advanced Manufacturing Technology 88(9-12): 3329-3342.
-
Delice EK, Can GF (2017) A stochastic approach for failure mode and effect analysis. RAIRO-Operations Research 51(4): 1077-1100.
-
Lo HW, Liou JJH (2018) A novel multiple-criteria decision- making-based FMEA model for risk assessment. Applied Soft Computing Journal 73: 684-696.
-
Tooranloo HS, Ayatollah AS, Alboghobish S (2018) Evaluating knowledge management failure factors using intuitionistic fuzzy FMEA approach. Knowledge and Information Systems 57: 183-205.
-
Angelov PP (1997) Optimization in an intuitionistic fuzzy environment. Fuzzy sets and Systems 86(3): 299- 306.
-
Boran FE, Genç S, Kurt M, Akay D (2009) A multi-criteria intuitionistic fuzzy group decision making for supplier selection with TOPSIS method. Expert Systems with Applications 36(8): 11363-11368.
-
Abdullah L, Najib L (2014) A new preference scale of intuitionistic fuzzy analytic hierarchy process in multi- criteria decision making problems. Journal of Intelligent & Fuzzy Systems 26(2): 1039-1049.
-
Saaty TL (1980) The Analytic Hierarchy Process. McGraw-Hill, New York.
-
Kumar PS, Hussain RJ (2015) Computationally simple approach for solving fully intuitionistic fuzzy real life transportation problems. International Journal of System Assurance Engineering and Management 7(S1): S90-S101.
-
Tamiz M, Jones DF (1997) Interactive frameworks for investigation of goal programming models: Theory and practice. Journal of Multi‐Criteria Decision Analysis 6(1): 52-60.
-
Liao H, Mi X, Xu Z, Xu J, Herrera F (2017) Intuitionistic Fuzzy Network Process. IEEE Transactions on Fuzzy Systems 26(5): 2578-2590.
-
Shahram S, Masoumeh A, Alieh S, Yazdani-Chamzini A, Tamošaitienė J, et al. (2017) Critical factors of the application of nanotechnology in construction industry by using ANP technique under fuzzy intuitionistic environment. Journal of Civil Engineering and Management 23(7): 914-925.
-
Zareinejad M, Javanmard H (2013) Evaluation and selection of a third-party reverse logistics provider using ANP and IFG-MCDM methodology. Life Science Journal 10(6s).
- The Expanding Landscape of Road Rage: A Systematic Review of Conflicts Involving Drivers, Pedestrians, and Micromobility
- Validating Cognitive Models of Royal Navy Performance on Control Systems
- Comparing Standard and State-of-the-art Firefighter Coats on Postural Balance and Gait in a Live Burn Environment
- Investigating the Integration of Telemedicine into Clinicians Workflow: A Review of Methods
- Risk Assessment of Ergonomic Factors in a Textile Firm by RULA, REBA and Fine Kinney Methods
- Impact of Self-Esteem Training on Individuals with Disabilities Aged 17-30