Isometric Muscular Strength of Agricultural Workers of Gujarat India
An agricultural worker must exert a push/pull force on the horizontal plane while using many agricultural tools and equipment. However, very little data are available on the push/pull force of farm workers. A study was therefore carried out to collect these data on male as well as female agricultural workers. Therefore, strength parameters of 105 agricultural workers (75 male and 30 female) were measured on “strength measurement setup†comprising load cell with digital indicator. The average push strength for male and female workers (with both hands in standing posture) was found to be 248.29 and 171.07 N respectively whereas the pull strength in standing posture was 232.40 and 141.75 N respectively. Average torque strength of both hands in standing posture for male and female workers are found to be 209.93 and 117.72 N-m respectively. The data were intended to be used to design and modification of hand tools and agricultural equipment in order to reduce drudgery and increase the level of efficiency, safety and comfort for users. Therefore, an attempt was made to illustrate the relevance of these data in the design of tractor controls.
Introduction
Anthropometric data are one of the essential factors in the design of machines and devices. More and more manual tools, implements and machines are being developed and used for various agricultural operations in Indian agriculture. Despite the rapid agricultural mechanization of the last century, but even though most of farmers still depend on a human force (muscular strength) which plays an important role in tasks that require hard work. Physical stress and fatigue due to a heavy workload can cause accidents and injuries.
The increasing awareness on the potential benefits of good ergonomic design has resulted in a steady improvement of the operator’s workplace [1, 2]. The use of female anthropometric data along with those of the male can help in the proper designing of the equipment for better efficiency, safety and human comfort [3].
Hand tools and equipment for agriculture are managed or controlled by agricultural workers; therefore, the muscle power is widely used. A person’s ability to perform a mechanical job is determined by his ability to exercise muscle strength. Traditionally, little attention has been paid to the skills and limitations of the operator in the design of hand tools and agricultural equipment in India [4].
According to Chaffin [5], there are two types of risks due to push and pull, which can cause the risk of health problems. On the one hand, when the force requirement for an activity exceeds the limit value of the force generation, the musculoskeletal system can become physically over- expressed. On the other hand, since the pushing and pulling activities are always accompanied by an increased risk of accidents due to slipping / sliding, these activities can cause injuries to the musculoskeletal system. Mehta, et al. [6] conducted a study to quantify human strength in the operation of tractor controls by Indian operators and concluded that the limits for the maximum actuating force of the brake and clutch pedals should be 330 and 280 N and they have carried out their study of the operation of the clutch pedal and the possible correlations between subjective evaluation and biomechanical parameters, such as the joint angle, the moment and the work for a better understanding of the discomfort.
The determination of the capabilities of human force is an important consideration in developing ergonomic guidelines for the pre-employment examination of workers who perform manual manipulation of materials [7]. When designing a push or pull activity, the knowledge of push / pull forces exerted by a worker is of immense importance and a designer must determine the maximum force required to perform the operation so that the forces of the hand must push. The pull does not exceed the safety limits the design must be such that a user within the resistance value of the 5th percentile can operate the machine, despite being able to withstand the forces exerted by the stronger user. Studies reported on push/pull forces [8, 9, 10, 11] are mostly Western populations and specialized workgroups other than agricultural workers.
Gite and Singh [12] noted that data on foreign workers cannot be used to design equipment for Indian workers. Because, there is a large variation in the strength data between Indian and Western workers. Therefore, the present study was conducted to generate and analyze the isometric muscle strength of male and female agricultural workers in the state of Gujarat. This information can be used in the design of agricultural hand tools and equipment.
Materials and Methods
Selection of Subjects
The study was conducted in Gujarat state. India. Data were collected from 105 subjects (75 males and 30 females) from different communities. The subjects were randomly selected among healthy farm workers in the 18-62 years age group. All subjects were free from physical abnormalities and musculoskeletal problems. Table 1 presents the anthropometric data relevant to the male and female subjects included in the study.
| Parameters | Male | Female | ||
|---|---|---|---|---|
| Mean | SD | Mean | SD | |
| Age (years) | 39 | 75 | 48 | 82 |
| Weight (kg) | 55.3 | 8.5 | 48.8 | 8.6 |
| Stature (mm) | 1632 | 69 | 1521 | 68 |
| Acromial height (mm) | 1378 | 61 | 1275 | 58 |
| Chest circumference (mm) | 827 | 43 | 808 | 72 |
| Thigh circumference (mm) | 432 | 37 | 411 | 45 |
Table 1: Anthropometric parameters of male (N = 75) and female (N = 30) agricultural workers participating in the study.
Strength Parameters
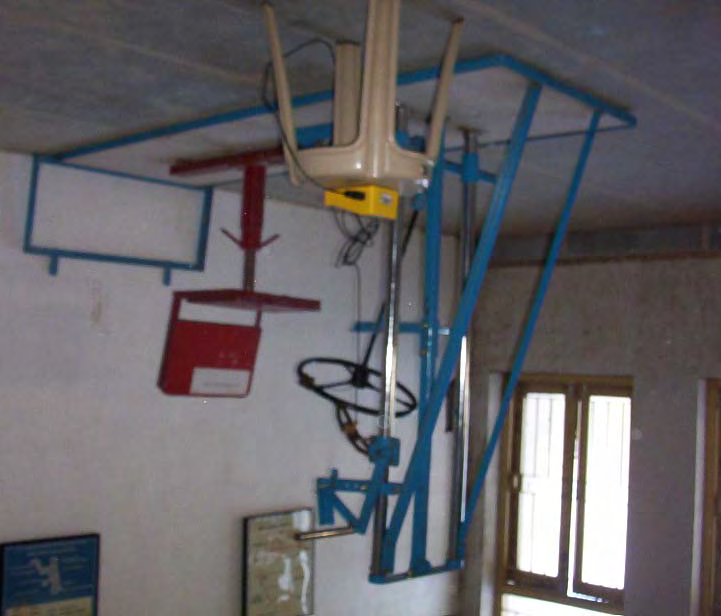
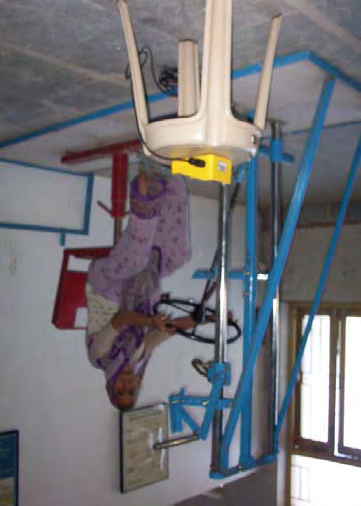
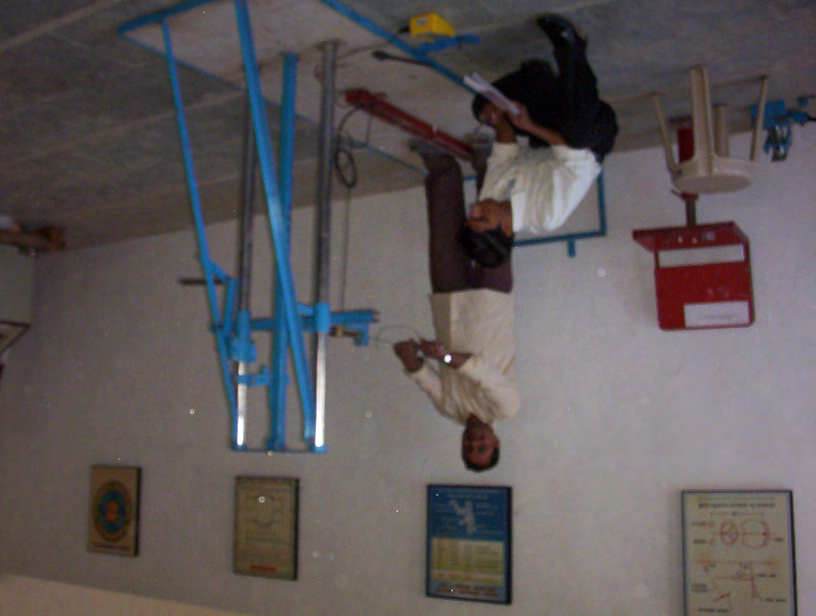
Sixteen strength parameters considered relevant for the design of agricultural hand tools and equipment were selected for the study. These parameters were also recommended by the All India Coordinated Research Project (AICRP) on Ergonomics and Safety in Agriculture (ESA), India [13, 14]. The different measured strength parameters are presented in Table 2 and postures adopted during measurements of strength are presented in Figures 1-3.
| No. | Strength Parameter |
|---|---|
| 1 | Push strength with both hands in standing posture, N |
| 2 | Pull strength with both hands in standing posture, N |
| 3 | Right hand pull strength in sitting posture, N |
| 4 | Left hand pull strength in sitting posture, N |
| 5 | Right hand push strength in sitting posture, N |
| 6 | Left hand push strength in sitting posture, N |
| 7 | Maximum left leg strength in sitting posture, N |
| 8 | Maximum right leg strength in sitting posture, N |
| 9 | Maximum left foot strength in sitting posture, N |
| 10 | Maximum right foot strength in sitting posture, N |
| 11 | Torque strength of preferred hand in standing posture, N-m |
| 12 | Torque strength of both hands in standing posture, N-m |
| 13 | Torque strength of preferred hand in sitting posture, N-m |
| 14 | Handgrip torque with preferred hand in sitting posture, N-m |
| 15 | Right handgrip strength, N |
| 16 | Left handgrip strength, N |
Table 2: Strength Parameters of Male and Female Farm Workers considered in the study.
Measurement Setup
Sixteen strength parameters of male and female agricultural workers in different positions were measured in “force measurement setup” (Figure 1). A 2500 N load cell with digital load indicator (NovaTech, United Kingdom) was used to measure these push / pull parameters. The complete configuration of the measurement of human strength along with an anthropometer and other accessories was taken at each survey site for the survey work.
Procedure
A group of researchers composed of four qualified employees (two men and two women) with experience in measuring anthropometric dimensions and human strength parameters, collected the complete data from 105 subjects. Before obtaining the data, the male and female observer received enough practice to measure all the dimensions in a good posture and accurately. The subjects were acclimatized with the experimental protocol for proper and correct measurement. According to the strength data collection protocol, subjects had to reach their maximum strength within the first 2 seconds and then maintain maximum strength for the next 3 s [15, 16]. The readings were taken during the last 3 s of force application and the value of the mode of these readings was taken as the strength value for that particular test. During a preliminary test, it was observed that a certain stimulus in the form of light / sound is needed to guide the subjects in the application of the push / pull force for the desired period of time. Therefore, during the application of the force a 5 s timer was used with a red light signal and beeping sound. Subjects were asked to gently release the force applied to the handle when the red light went off and the beep signal stopped after 5 seconds. Three tests were performed with each subject. Subjects were given a 2 min resting period between two consecutive trials.
Analysis of the Data
From the raw data of the selected subjects, the minimum, maximum, mean and standard deviation (SD) values of 16 force parameters were calculated using Microsoft Excel software. For calculation of 5th percentile and 95th percentile values, the following standard equations given in the Anthropometric Source Book [17] were used:
5th percentile value
$$ e = \mathrm {m e a n} - 1. 6 4 5 \times \mathrm {S D} $$
95th percentile value
$$ e = \mathrm {m e a n} + 1. 6 4 5 \times \mathrm {S D} $$
Results and Discussion
Anthropometric Parameters of Agricultural Workers
Table 1 presents the mean and standard deviation for relevant anthropometric parameters of male and female agricultural workers. The mean age, stature and weight of male subjects were 39±75years, 1632±69 mm and 55.3±8.5 kg, respectively while the corresponding parameters for female subjects were 48±82years, 1521±68 mm and 48.8±8.6 kg. In general the male subjects were heavier and taller than female subjects.
Magnitude of Isometric Muscular Strength
Tables 3 and 4 presents the mean, standard deviation and 5th and 95th percentile values of push and pull strength of male and female agricultural workers. The forces exerted in push as well as pull mode by male subjects were expressively higher than by female subjects.
| S. No. | Strength Parameters | Mean | SD | 5th percentile | 95th percentile |
|---|---|---|---|---|---|
| 1 | Push strength with both hands in standing posture, N | 248.29 | 46.4 | 171.96 | 324.62 |
| 2 | Pull strength with both hands in standing posture, N | 232.4 | 46.21 | 156.38 | 308.42 |
| 3 | Right hand pull strength in sitting posture, N | 96.53 | 16.87 | 68.78 | 124.28 |
| 4 | Left hand pull strength in sitting posture, N | 95.26 | 16.87 | 67.51 | 123.01 |
| 5 | Right hand push strength in sitting posture, N | 77.79 | 20.01 | 44.87 | 110.71 |
| 6 | Left hand push strength in sitting posture, N | 75.64 | 17.76 | 46.42 | 104.86 |
| 7 | Maximum left leg strength in sitting posture, N | 347.08 | 58.47 | 250.9 | 443.26 |
| 8 | Maximum right leg strength in sitting posture, N | 374.35 | 74.16 | 252.36 | 496.34 |
| 9 | Maximum left foot strength in sitting posture, N | 254.86 | 41.99 | 185.79 | 323.93 |
| 10 | Maximum right foot strength in sitting posture, N | 285.18 | 50.72 | 201.75 | 368.61 |
| 11 | Torque strength of preferred hand in standing posture, N-m | 183.45 | 29.14 | 135.51 | 231.39 |
| 12 | Torque strength of both hands in standing posture, N-m | 209.93 | 26.39 | 166.52 | 253.34 |
| 13 | Torque strength of preferred hand in sitting posture, N-m | 284.69 | 46.7 | 207.87 | 361.51 |
| 14 | Handgrip torque, N-m | 4.91 | 1.42 | 2.58 | 7.23 |
| 15 | Right handgrip strength, N | 396.18 | 96.12 | 238.06 | 554.3 |
| 16 | Left handgrip strength, N | 373.72 | 83.53 | 236.31 | 511.13 |
| S No. | Strength Parameters | Mean | SD | 5th percentile | 95th percentile |
| 1 | Push strength with both hands in standing posture, N | 171.1 | 13.4 | 148.98 | 193.2 |
| 2 | Pull strength with both hands in standing posture, N | 141.8 | 12 | 122.06 | 161.44 |
| 3 | Right hand pull strength in sitting posture, N | 65.73 | 6.87 | 54.43 | 77.03 |
| 4 | Left hand pull strength in sitting posture, N | 57.88 | 6.47 | 47.24 | 68.52 |
| 5 | Right hand push strength in sitting posture, N | 49.74 | 5.89 | 40.05 | 59.43 |
| 6 | Left hand push strength in sitting posture, N | 44.64 | 7.06 | 33.03 | 56.25 |
| 7 | Maximum left leg strength in sitting posture, N | 235.6 | 19 | 204.34 | 266.94 |
| 8 | Maximum right leg strength in sitting posture, N | 280.7 | 24.9 | 239.67 | 321.65 |
| 9 | Maximum left foot strength in sitting posture, N | 209.4 | 14.1 | 186.2 | 232.68 |
| 10 | Maximum right foot strength in sitting posture, N | 250 | 41.4 | 181.86 | 318.06 |
| 11 | Torque strength of preferred hand in standing posture, N-m | 90.84 | 7.95 | 77.76 | 103.92 |
| 12 | Torque strength of both hands in standing posture, N-m | 117.7 | 9.03 | 102.87 | 132.57 |
| 13 | Torque strength of preferred hand in sitting posture, N-m | 188 | 13.1 | 166.49 | 209.43 |
| 14 | Handgrip torque, N-m | 3.1 | 0.52 | 2.25 | 3.96 |
| 15 | Right handgrip strength, N | 245.1 | 76.3 | 119.56 | 370.68 |
| 16 | Left handgrip strength, N | 233 | 82.7 | 96.97 | 369.11 |
Table 3: Strength Parameters of Male Agricultural Workers (N= 75).
Hand strength: It is desirable to design the hand operated equipment considering ergonomical aspects like handle height, length of handle, handle inclination, so that maximum force can be exerted to operate with less effort, comfort and higher work output. The average value of push strength with both hands in standing posture for male and female workers is found to be 248.29 and 171.09 N respectively whereas pull strength in standing posture values are 232.40 and 141.75 N respectively which can be used in design of wheel hoe, lawn mower and manually operated push and pull equipment. For the design of joystick, gear shift lever and handle lever, the right hand push and pull strength data of male and female agricultural workers can be utilized which are found within the range of 49.74 to 96.53 N. The maximum value of 5th and 95th percentile of pull strength right hand in sitting posture are 68.78 and 124.28 N for male workers and 54.43 and 77.03 N for female workers and these are considered while designing of joystick, gearshift lever, handle lever, workplace design, etc. Leg and foot strength: Leg and foot operated equipment are also used in the agriculture like foot operated sprayer and foot operated tractor controls. The average value of right leg strength in sitting posture for male and female workers is 374.35 N and 280.66 N respectively and it can be used for the design purpose. The maximum foot strength of male and female agricultural workers is 285.18 and 249.96 N respectively, which is useful in the design of accelerator pedal and other foot-operated controls.
Torque strength: The mean value of torque strength of both hands in standing posture for male and female workers are found to be 209.93 and 117.72 N respectively which can be used in the design of manually operated equipment like chaff cutter and sugarcane crusher. Torque strength for both hand in standing and both hand in sitting are used in the design of manually operated equipment like chaff cutter, sugarcane crusher and design of control viz. steering. The 5th and 95th percentile values of torque strength of preferred hand in standing posture are 135.51& 231.39 N for male and 77.76& 103.92 N for female workers respectively and similarly in sitting posture are 207.87& 361.51 N for male and 166.49& 209.43 N for female workers respectively that should be considered in design of tractor or other vehicles steering. Design of knob control, sprayer lids and opening cover of service point, the mean value of hand grip torque for male is 48.17 N and for female 30.41 N respectively. These overall parameters can be used in the design / modification of hand controls and foot controls like clutch / brake within different workplaces of machines.
Conclusion
The study indicated that the magnitude of isometric muscle strengths of male agricultural workers is greater than that of female workers. The mean values for isometric push and pull strengths in a standing posture with both hands in the horizontal plane are 248.29±46.40 N and 232.40±46.21
N, respectively, for male subjects and 171.09±13.44 N and 141.75±11.97 N, respectively, for female subjects. The weights of the subjects indicate a positive relationship with isometric muscular strength. The 5th percentiles push and pull strength values are 171.96 N and 156.38 N, respectively, for male workers and 148.98 N and 122.06 N, respectively, for female workers. Repetitive farming activities should be designed in such a way that the force requirement does not exceed 30% of the 5th percentile strength value, although it can be raised to 50% provided the effort does not last longer than 5 minutes. Agricultural activities that require continuous force application must be designed so that the strength requirement is less than 30% of the 5th percentile strength value to have a static load margin of the muscles.
References
-
Yadav R (1995) Some ergonomic investigations on tractor workplace design. Unpublished Ph. D. Thesis, Department of Agricultural & Food Engineering, Indian Institute of Technology, Kharagpur, India.
-
Yadav R, Tewari VK, Prasad N (1997) Anthropometric data of Indian farm workers-a module analysis. Applied Ergonomics 28(1): 69-71.
-
Yadav R, Gite LP, Kaur N, Randhawa J (2000) An anthropometry of Indian female agricultural workers, Agricultural Mechanization in Asia, Africa and Latin America 31(3): 56-60.
-
Yadav R, Jakasania RG, Mohnot P (2018) Ergonomically women friendly weeder: A review. Ergonomics International Journal 2(6): 1-4.
-
Chaffin DB (1987) Manual materials handling and the biomechanical basis for prevention of low back pain in industry – an overview. American Industrial Hygiene Association Journal 43(12): 989-996.
-
Mehta CR, Tiwari PS, Rokade S, Pandey MM, Pharade SC, et al. (2007) Leg strength of Indian operators in the operation of tractor pedals. International Journal of Industrial Ergonomics 37(4): 283-289.
-
NIOSH (1981) Work practices guide for manual load lifting. National Institute for Occupational Safety and Health, Cincinnati, OH, USA.
-
Chaffin DB, Andres RO, Garg A (1983) Volitional postures during maximal push/pull exertions in the sagittal plane. Human Factors 25(5): 541–550.
-
Kumar S (1995) Upper body push–pull strength of normal adults in sagittal plane at three heights. International Journal of Industrial Ergonomics 15(6): 427-436.
-
van der Beek AJ, Kluver BD, Frings-Dresen MH, Hoozemans MJ (2000) Gender differences in exerted forces and physiological load during pushing and pulling of wheeled cages by postal workers. Ergonomics 43(2): 269-281.
-
Gite LP, Singh G (1997) Ergonomics in Agriculture and Allied Activities in India. Technical Bulletin No. CIAE/97F/70, Bhopal, India.
-
Yadav R, Pund S, Patel NC, Gite LP (2010) Analytical study of strength parameters of Indian farm workers and its implication in equipment design. Agricultural Engineering International: the CIGR Ejournal. Manuscript MES 12(2): 49-54.
-
Gite LP, Chatterjee D (1999) All India anthropometric survey of agricultural workers-proposed action plan. All India Coordinated Research Project on Human Engineering and Safety in Agriculture. Central Institute of Agricultural Engineering, Bhopal.
-
Yadav R, Jakasania RG, Vadher AL (2018) Segmental proportions based on anthropometry of female agricultural workers, India. Ergonomics International Journal 2(7): 1-9.
-
Kumar S, Narayan Y, Bacchus C (1995) Symmetric and asymmetric two-handed pull-push strength of young adults. Human Factors 37(4): 854-865.
-
Yadav R, Savani JB (2004) ICAR Adhoc Research Scheme on “Anthropometric survey and ergonomical studies on agricultural workers of Gujarat for efficient and safe design of agricultural equipments”.
-
NASA (1978) Anthropometric Source Book Vol-I. Reference publication 1024, Scientific and Technical Office, Washington DC, USA.
- The Expanding Landscape of Road Rage: A Systematic Review of Conflicts Involving Drivers, Pedestrians, and Micromobility
- Validating Cognitive Models of Royal Navy Performance on Control Systems
- Comparing Standard and State-of-the-art Firefighter Coats on Postural Balance and Gait in a Live Burn Environment
- Investigating the Integration of Telemedicine into Clinicians Workflow: A Review of Methods
- Risk Assessment of Ergonomic Factors in a Textile Firm by RULA, REBA and Fine Kinney Methods
- Impact of Self-Esteem Training on Individuals with Disabilities Aged 17-30