A Study on the Acceptability of the Elderly Driver according to the Assistant Method
According to traffic accident reports, many of the accidents that occur at intersections are caused by elderly drivers, and development of an assistant system that can prevent non-stopping accidents (i.e., accidents that occur by not stopping when required) is currently a pressing need. To develop an anti-stopping alert, it has been assumed that an alarm that informs the driver about the impending approach of an intersection is effective. However, a uniform alarm system cannot be expected to influence the individual differences among elderly drivers. Then, audio-visual assistance systems that consist of a nudge that informs drivers about the existence of an intersection and of an approach alarm that follows the nudge, as well as of a display and a warning with sound and voice, were designed based on the timing when braking occurs and on a given elderly driver's braking behavior when approaching an intersection. In this research, considering an elderly driver's cognition, judgment capability, and individual driving abilities, and while investigating individual elderly drivers’ vision capabilities and judgment functions, a questionnaire survey on the posture and concerns about driving was conducted in advance. Subsequently, using the driving simulator of a city road, the driving behavior of an elderly driver from braking behavior to stopping performance was observed; furthermore, driving behavioral changes following the proposed driving assistance alarm were analyzed. The result of our analysis demonstrated that elderly drivers differed in their response to the assistance alarm according to their cognition and judgment capabilities, their experience, and driving style. The proposed system’s effectiveness was apparent when the alarm was adapted to each individual’s capabilities.
Introduction
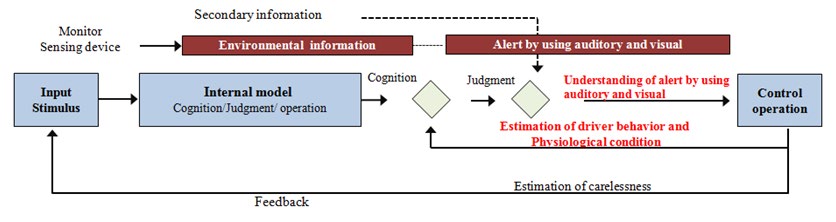
According to the latest traffic accident reports [1], accidents frequently occur at city road intersections because of elderly drivers. For the prevention of non-stopping accidents caused by elderly drivers (i.e., accidents caused by a failure of elderly drivers to stop at intersections), an anti- stopping alert is required to guide the appropriate braking operation when approaching an intersection. In a previous study, an audio-visual alarm was constructed [2, 3, 4, 5, 6] that consists of a nudge and approaching alarm, a display, and a warning sound and voice. As shown in Figure 1, if the driving behavior is assumed to be a series of flows that consist of recognition, judgment, and operation within the driving environment, it can be assumed that the driving operation is performed according to an internal model based on the experience and custom of every individual. Within this flow, the driving assistance system is equipped with a primary nudge that provides environmental information, and that is followed by a secondary alert when approaching an intersection.
In this paper, changes to the driving behavior are investigated when the supporting system provides audiovisual stimulus; such changes were investigated using the driving simulator of a city road. Moreover, it was noted that the individual differences in the capability of cognitive judgment and driving ability were remarkable; therefore, a questionnaire survey of driving attitudes and interest was conducted in addition to the visual and judgment function test for each elderly individual in advance of the experiment.
The results of our study reveal that changes in the driving behavior caused by the assistance system were different among elderly drivers, and that the changes were related to cognition and judgment capabilities, experience, and attitude. Therefore, it is concluded that warning alarms should be adapted to every individual.
Experimental Methods
Experimental Participants
In order to clarify the individual differences of elderly drivers and to judge the participants’ conformity in the execution of driving tasks, an initial test was performed for 45 elderly drivers. For this initial test, a useful field of view (UFOV) test and a mini mental state examination (MMSE) were performed to determine recognition and judgment capabilities. Moreover, in order to classify individual driving abilities and driving styles according to the driver’s experience and operation, a driving style questionnaire (DSQ) survey [7] and a test as a listening survey of personal information were performed. Cognitive judgment capabilities, driving styles, and other characteristics of the elderly experiment participants were classified from the results of these tests. Moreover, eight elderly drivers from the participating 45 elderly drivers were selected and their driving behavior was observed. On the other hand, ten young drivers conducted driving behavior measurements similar to the elderly drivers for comparison. In this research, we obtained informed consent in advance from the experiment participants.
Outline of Driving Assistant System
The driving assistance system detects the external intersection environment and composes the appropriate driving behavior from a series of individual cognition, judgment, and control (operation). Subsequently, the system induces the appropriate driving behavior from the driver that is approaching an intersection. Here, the alarm stage is divided into four steps considering a series of driving behavior processes such as cognition, judgment, braking operation, and stopping at the intersection. Step 1 helps to recognize the intersection, Step 2 induces the braking operation, Step 3 hastens the braking operation and results in a stop, and Step 4 guides the right-and-left verification after stopping at the intersection. Moreover, five conditions are set up with a combination of alarms through audiovisual methods. The Estimated Time-to-Collision [8] (TTC_est) is used as the current time. Moreover, the Time-to-Cross line (TTCr) calculated by the velocity and the distance to the stop line ahead of the intersection shows the expected arrival time to the stop line. As listed in Table 1, the five alarms are the information condition (Info), the low-frequency beep condition (Low-f. beep), the high-frequency beep condition (High-f. beep), the display condition (Display), and the voice condition (Voice).
- Information condition (Info): after presenting a pong sound (sound) + (display) in order to support the perception (discovery) of the intersection, a female voice informs the driver that there is an intersection.
- Low-frequency beep sound condition (Low-f. beep): after presenting the Info, a beep sound in the low frequency of 1.0 kHz sounds at intervals of 0.38 s (low stable pulse beep sound) in order to induce the braking operation.
- High-frequency beep sound condition (High-f. beep): after presenting the Info, a beep sound in the high frequency of 3.7 kHz sounds at intervals of 0.2 s (highly urgent pulse beep sound) for the same reason as the Low-f. beep.
- Display condition (Display): after presenting the Info, images of the braking operation are displayed on a 7-in LCD display installed in the center of the dashboard.
- Voice: after presenting the Info, a female voice instructs the driver to brake smoothly in order to induce the braking operation and to stop completely in order to promote compulsory stopping.
| Step 1 | Step 2 | Step 3 | Step 4 | |
|---|---|---|---|---|
| Condition Name Timing | TTCr ≤ TTC_est + 3 | TTC r ≤ TTC_est | TTCr ≤ 2 s or Ahead of 5 m | Stop line |
| Info | “pong” (sound) & There is a stop intersection. (voice) & STOP (Display) | - | - | |
| Low-f. beep | “pong” (sound) & There is a stop intersection. (voice) & STOP (Display) | “beep beep” (1.0 kHz, 0.38 s continuous sound) | - | “left, right” |
| High-f. beep | “pong” (sound) & There is a stop intersection. (voice) & STOP (Display) | “beep beep” (3.7k Hz, 0.2 s continuous sound) | - | “left, right” |
| Display | “pong” (sound) & There is a stop intersection. (voice) & STOP (Display) | |||
| Voice | “pong” (sound) & There is a stop intersection. (voice) & STOP (Display) | “brake smoothly” | “stop completely” | ‘left, right’ |
Table 1: Alert conditions and sequence.
Experimental Device and Scenario
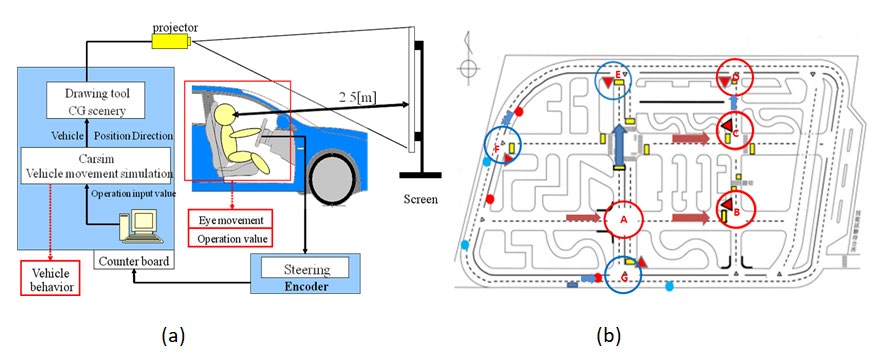
In order to verify the validity of the driving assistance system, the sequential alarm system was designed with a feature of the elderly drivers’ driving behavior, and the alarms’ effect was investigated to determine changes in the driving behavior. In addition, individual differences in cognition and driving style, as well as the influence of the alarm system on braking behavior, were considered.A driving simulator (DS-2000, Mitsubishi Precision Co. Ltd.) was used. The driving course was projected on a three- side screen, as shown in Figures 2(a) and 2(b). The driving task was set up to go through intersections after driving through a straight road. In the DS, the 7-inch LCD monitor used to display the images was installed in the center of the dashboard; the warning beep sounds and the information provided by the female voice were presented via a speaker placed behind the driver’s seat. The experiment consisted, in order, of practice driving for 5 min, real driving tasks for all the alarms, and responses to questionnaires. The order of the alarm conditions was counterbalanced for the participants.
Results & Discussion
Behavioral Changes in Operation after Assistance from Recognition and Judgment Ability Viewpoints
Classification of elderly individuals by differences in cognition and judgment abilities: The K-Means Cluster Analysis was performed and it was classified into four groups according to the results of the MMSE questionnaire and the UFOV desk experiment of the preliminary survey of 45 elderly drivers. The results were based on the correct answer rates of UFOV (central dual task) and the percentages of MMSE (score). The values were calculated by percentrank function with Excel. The capability distribution of the 45 elderly drivers is shown in Figure 3. The borders were defined by K-mean cluster analysis.
As the result, the groups were effected more by MMSE rather than UFOV. The elderly drivers are represented by the numbers 1to45. The participants for the driving experiment were selected after an interview and for the convenience of the participant’s intention to drive in the simulator; the selected participants are shown with a red number in Figure 3. Specifically, the driving data of eight elderly drivers, participants 10, 13, 22, 23, 32 and 35 from group O_A, and participants 28 and 31 from group O_C, were obtained.
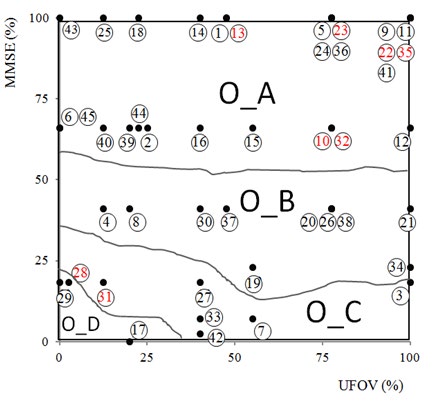
Figure 3: Group classification of UFOV and MMSE results. (The higher percentile is the high score, and the circled numbers represent the order in which the subjects joined the pretest.) UFOV is the visual area over which information can be extracted at a brief glance without eye or head movements. MMSE test is a brief 30-point questionnaire test that is used to screen for cognitive impairment. It is commonly used in medicine to screen for dementia.
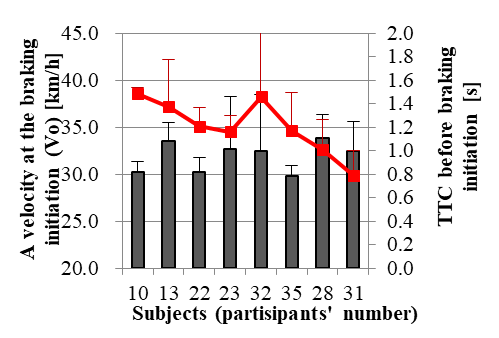
Deceleration behavior caused by differences in cognition and judgment abilities: Figure 4 shows average (two times * six conditions) of velocity Vo at the initial deceleration time for every participant and a Time-to-Collision (TTCo). Six participants from the O_A group are shown on the left of the figure, and two participants from the O_C groups are shown on the right. As shown in Figure 4. Vo varies among individuals, but the group difference is not clear; however, it is clear that the TTCo of group O_C is shorter than that of group O_A.
Next, we compare the decelerating and stopping behaviors close to the intersection shown in Figures 5(a) to 5(f) for young drivers (Y-all) and elderly drivers (O-A and O_C).
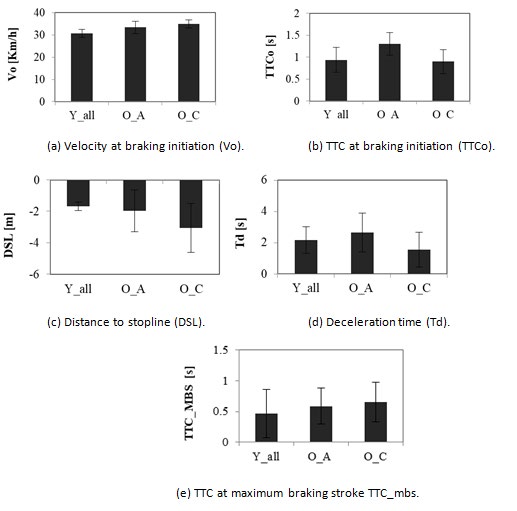
Figures 5(a) and 5(b) show velocity at braking initiation (Vo) and TTC at braking initiation (TTCo) at the deceleration initiation. These figures show that Vo is higher for the O_C group than for the Y_all group. Next, the TTCo of the O_A group is higher than the O_C group and then the Y_all group. With regard to the distance to stop line (DSL) shown in Figure 5(c), distance to stopline (DSL) of the O_C group is longer than both the O_A group and the Y_all group. With regard to the results of the deceleration time (Td) shown in Figure 5(d), the Td of the O_A group is significantly longer than that of the O_C group. In addition, Figure 5(e) shows that the maximum braking accerelation (Max_BS) of the O_C group is significantly greater than the Y_all and O_A groups. Then, when comparing the TTC at the maximum braking stroke (TTC_mbs), the O_C group’s TTC at maximum braking stroke (TTC_mbs) is longer than the O_A and Y_all groups. From these results, and when comparing the deceleration behavior of young drivers with that of elderly drivers, the typical difference between elderly drivers and younger drivers is obvious; furthermore, the results reveal that the deceleration initiation rate of the O_C group is lower, which represents the abrupt deceleration operations of elderly drivers who have declined cognition and judgment abilities.
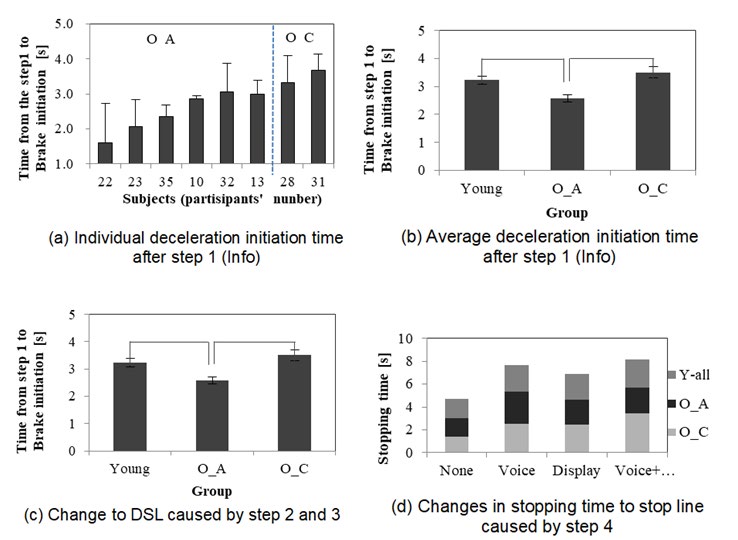
Behavioral changes corresponding to driving support: Figure 6(a) to 6(d) show changes in the deceleration and stopping actions after the step-by-step instructions of the support system. In Figure 6(a) and 6(b), the deceleration initiation time after the first alarm (Info) is compared between the participants as they approach intersections. Figure 6(a) shows individual differences, and Figure 6(b) shows differences between the groups. Figure 6(c) is the comparison of changes in the DSL caused by step 2 and 3 at Table 1. For instance, none was assigned result for Info condition only, and Sound was assigned for Low and High-f. beep. Next, Figure 6(d) shows changes in the stopping time to the stop line caused by step 4 at Table 1. For instance, None was assigned result for Info condition only, and Voice + Display was assigned for both audio-visual alarm.
Next, we compare the decelerating and stopping behaviors close to the intersection shown in Figures 5(a) to 5(f) for young drivers (Y-all) and elderly drivers (O-A and O_C). Figures 5(a) and 5(b) show velocity at braking initiation (Vo) and TTC at braking initiation (TTCo) at the deceleration initiation. These figures show that Vo is higher for the O_C group than for the Y_all group. Next, the TTCo of the O_A group is higher than the O_C group and then the Y_all group. With regard to the distance to stop line (DSL) shown in Figure 5(c), distance to stopline (DSL) of the O_C group is longer than both the O_A group and the Y_all group. With regard to the results of the deceleration time (Td) shown in Figure 5(d), the Td of the O_A group is significantly longer than that of the O_C group. In addition, Figure 5(e) shows that the maximum braking accerelation (Max_BS) of the O_C group is significantly greater than the Y_all and O_A groups. Then, when comparing the TTC at the maximum braking stroke (TTC_mbs) as shown in Figure 5(f), the O_C group’s TTC at maximum braking stroke (TTC_mbs) is longer than the O_A and Y_all groups. From these results, and when comparing the deceleration behavior of young drivers with that of elderly drivers, the typical difference between elderly drivers and younger drivers is obvious; furthermore, the results reveal that the deceleration initiation rate of the O_C group is lower, which represents the abrupt deceleration operations of elderly drivers who have declined cognition and judgment abilities.
Behavioral Change of Operation after Assist from the Point of View in Driving Style
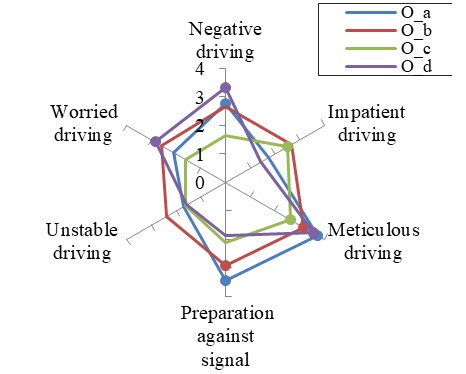
Classification of elderly drivers by driving style: To sort the driving propensity of each elderly driver, not only cognition and judgment abilities were used, but also the driving style. The following six items determined to be associated with the deceleration and stopping action items of the DSQ5) questions related to driving style were selected: 1) negative (attitude toward) driving, 2) impatient driving, 3) meticulous driving, 4) preparation against (traffic) signals, 5) unstable driving, and 6) worried (apprehensive) driving. Then, a classification of elderly drivers according to their driving style was performed through the K-Means Cluster Analysis, and expressed as O_a, O_b, O_c, and O_d. Using the participant numbers that were classified through the distribution of cognition and judgment abilities shown in Figure 3, we can indicate that participant numbers 13, 23, 32 and 35 belong in the O_a group; participant numbers 22 and 28 belong in the O_b group; participant number 10 belongs in the O_c group; and finally, participant number 31 belongs in the O_d group.
In order to investigate the styles evaluated significantly greater in a group based on the DSQ results, a multivariate analysis evaluation was conducted for each group. The results we obtained indicate that the three styles of negative, meticulous, and preparation against signals in the O_a group were evaluated higher than the other styles. In the O_b group. The two styles of meticulous and preparation against signals, similar to the O_a group, were evaluated higher than the other styles. Next, in the O_c group, the styles of impatient and meticulous driving were evaluated higher than the other styles. Finally, in the O_d group the styles of negative, meticulous, and apprehensive driving were evaluated higher than the other styles.
The result listed in Table 2 indicate basic information of the experiment’s participants, the groups classified according to the cognition and judgment abilities obtained from UFOV and MMSE, and the groups classified according to the driving style. Further, Figure 7 shows average values of the driving style of each group.
| ID No. | Age (Gender) | UFOV % (Correct answer rate) | MMSE % (Score) | Group by Cognitive Ability | Group by Driving Style | |||
|---|---|---|---|---|---|---|---|---|
| Central Task Peripheral Task Single Dual Single Dual 100 77.5 100 40 | ||||||||
| 10 | 69 (M) | 96.7 (29) | O_A | O_c | ||||
| 13 | 72 (M) | 100 | 47.5 | 47.5 | 47.5 | 100 (30) | O_A | O_a |
| 22 | 68 (M) | 100 | 100 | 100 | 77.5 | 100 | O_A | O_b |
| 23 | 69 (M) | 100 | 77.5 | 55 | 77.5 | 100 | O_A | O_a |
| 28 | 72 (M) | 100 | 2.5 | 100 | 15 | 86.6 (26) | O_C | O_b |
| 31 | 70 (F) | 55 | 12.5 | 55 | 55 | 86.6 (26) | O_C | O_d |
| 32 | 69 (M) | 100 | 47.5 | 55 | 100 | 96.7 (29) | O_A | O_a |
| 35 | 65 (M) | 100 | 100 | 100 | 12.5 | 100 (30) | O_A | O_a |
Table 2: Participant results after preliminary tests.
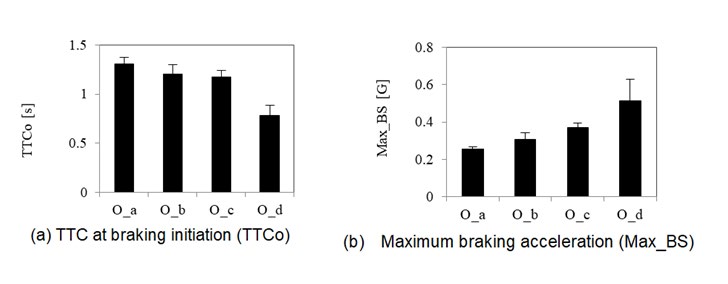
Deceleration behaviors caused by differences in driving style: Driving style and propensity were divided into the four groups O_a, O_b, O_c, and O_d. Deceleration behaviors caused by differences in driving style are shown in comparison with the Max_BS and TTCo results in Figures 8(a) and 8(b). The figures confirm that the TTCo results from the O_a to O_d groups became low; in contrast, the Max_BS results became high for the O_a to O_d groups.
From these results, it can be stated that elderly drivers have a tendency for large deceleration and sharp braking in increasing order from the O_a to O_d groups (i.e., O_a, O_b, O_c, and O_d, in this order); in other words, the emergent operation with large deceleration and sharp braking is depended on the driving style of “preparation against signal”.
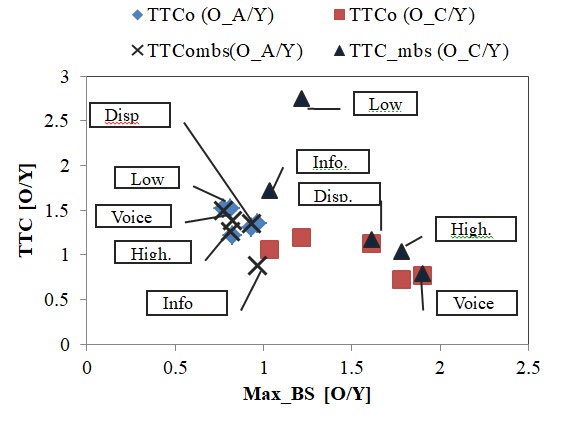
Behavioral changes corresponding to driving support: After considering driving style and propensity as well as cognitive and judgment abilities, the driving behavioral effective change caused by the driving assistant system was examined. Figure 9 shows the effect of the five driving assistant conditions from the stopping behavior of elderly drivers evaluated from the ratio of an elderly driver group to the young driver group with regard to Max_BS and TTC. Here, an appropriate driving behavior like young drivers was invited by the ratio of an elderly driver group to the young driver group. In Figure 9, the ratio of the O_A group to the Y_all group is plotted around the 1.0 point. The plot indicates that the TTCo of the O_A group increases approximately 1.5 times for the Low-f. beep conditions, as well as for the High-f. beep and Voice conditions. On the other hand, the TTCo of the O_C group increases approximately 2.7 times for the Low-f. beep conditions; for the Voice conditions, the deceleration is large for this group, indicating that the Voice condition is effective.
From these results, it can be concluded that the effect of driving support at intersections is beneficial for elderly drivers with more advanced aging. With the warning sound system, support of a low-pitched sound is effective to help with early braking; furthermore, it became clear that support through voice warning is effective for the dangerous moment when the brakes must be applied.
Conclusion
In this research, in order to understand clearly how driving behaviors change with the help of driving assistant systems, a sequential support alarm with the feature of elderly drivers’ behavior was designed, and the influence of such a support was investigated for behavioral change. Here, driving behavior changes caused by driving support was examined for elderly drivers using a driving simulator that imitates city roads.
The following points became clear as a result of a series of experiments.
1. As a result of observing changes after a nudge alarm is triggered at the time of approaching a city intersection, the decelerating action caused by the alarm and the warning that followed it, and the actions that confirmed safe conditions, it became clear that warning with beeping sounds and voice instructions to apply the brakes early and fully, is effective as driving support to prevent accidents caused by not stopping.
2. When the effect of a driving support alarm, in addition to cognitive and judgment abilities, is compared for a young driver and an elderly driver, it was found that an elderly driver’s ability is typically hindered due to age related health issues in comparison to a young driver. It became clear that the advantage of such driver support alarms is higher for elderly drivers.
3. It is thought that the driving support to an elderly driver is effective for the strong group of the unstable operation tendency of the fall of cognitive judgment capability and an operation disposition.
4. The above findings indicate recommendations for future driving support systems. That is, through a nudge alarm it becomes possible to alert drivers to promptly and safely navigate and brake using a beep sound or voice warning.
As future work, a more accurate identification method, which considers individual differences of different elderly drivers, is necessitated for the process of classification and detailed stratification. In addition, support for multi- modals except audio-visual, such as a support method that implements slight olfactory or tactile stimulations, needs to be investigated.
References
-
ITARDA (2010) Being safe a senior driver-Check your driving habits again.
-
Akamatsu M (2008) Assessment of driving assistance system using measurement of driver’s behavior, Proceeding of Transactions of the Society of Automotive Engineers of Japan (JSEA), No. 20094543, pp: 1-6.
-
Akita T, Shirahige H, Hong SH, Hayashi J, Suzuki K, et al. (2014) Research of Stop Assistance considering Visibility of Intersection. Second International Symposium on Future Active Safety Technology toward zero-traffic-accident (FAST-zero ‘14), Nagoya, Japan.
-
Asao T, Wada T, Doi S, Tsukamoto K (2007) Analysis of Driving Behavior with Additional Workloads Caused by Reaching Task. Transactions of the Society of Automotive Engineers of Japan (JSEA) 38(6): 271-276.
-
Homma R, Ishida T (2008) Effects of a Driving Assistance System at Full-Stop Intersections. Proceeding of Transactions of the Society of Automotive Engineers of Japan (JSEA) Fall Conference 145(8): 5-10.
-
Suzuki K, Tanaka H, Miichi Y, Aga M (2011) Driving Behavior due to the difference of control algorithm of collision-prevention support braking (first report). Proceeding of Transactions of the Japan Society of Mechanical Engineers (JSME), pp: 9-14.
-
Ishibashi M, Okuwa M, Akamatsu M (2002) Development of Metrics for Driver’s Individual Characteristics. Transactions of the Society of Automotive Engineers of Japan 55(2): 9-12.
-
Kurahashi T, Okuwa M, Sakaguchi Y, Nagiri S, Seguchi H, et al. (2006) Analysis of Usual Drivers’Decelerating Behavior on Public Roads. Transactions of Society of Automotive Engneers of Japan 39(2): 363-368.
- The Expanding Landscape of Road Rage: A Systematic Review of Conflicts Involving Drivers, Pedestrians, and Micromobility
- Validating Cognitive Models of Royal Navy Performance on Control Systems
- Comparing Standard and State-of-the-art Firefighter Coats on Postural Balance and Gait in a Live Burn Environment
- Investigating the Integration of Telemedicine into Clinicians Workflow: A Review of Methods
- Risk Assessment of Ergonomic Factors in a Textile Firm by RULA, REBA and Fine Kinney Methods
- Impact of Self-Esteem Training on Individuals with Disabilities Aged 17-30