An Empirical Study of the Effects of Pure Real-World Conditions on the Reliability of Forensic Phonetic Features
Forensic phonetic features have been being the most commonly used features in forensic voice comparison technology, and few dispute that they are dramatically affected by real-world conditions, which leads to within-speaker variations and consequently reduces the reliability of forensic voice comparison results as evidence. In this study two experiments are designed and the conversations recorded in pure real-world conditions are adopted as experiment materials to respectively demonstrate the effects of real-world conditions on quantitative phonetic feature of formant trajectory and qualitative phonetic feature of formants pattern that have been tested valid in researches or practice. The results of experiments vividly display that pure real-world conditions do reduce both the amount and quality of available quantitative and qualitative phonetic features, which consequently makes forensic voice comparison impossible or forensic voice comparison results less valid and reliable
Introduction
In legal practice forensic voice comparison (FVC) technology is employed to compare voices to provide evidence whether or not the audio recordings of an unknown speaker involved in a legal case was produced by a known suspect. So far, phonetic features have been being the most commonly used features to compare voices in practice. However, it is also agreed that phonetic features are dramatically affected by real-world conditions, which leads to within-speaker variations and consequently reduces the reliability of FVC results as evidence.
The effects of real-world conditions on phonetic features are examined in this study to demonstrate how the reliability of forensic phonetic features may be affected in forensically realistic conditions.
Methodology
The experiment materials adopted in this study are the conversations that have been recorded in pure real- world conditions. To demonstrate the effects of real-world conditions on forensic phonetic features, both typical quantitative and qualitative phonetic features that have been tested to be valid and reliable in research are examined.
Data
The database for this study contains all together 118 conversations from 74 female speakers, which have been contributed and authorized for research use by the speakers themselves.
Taking the real-world conditions into account in which the questioned voice sample is recorded in FVC practice, and for the sake of convenient data sampling, conversations are categorized in terms of medium and relationship between interlocutors. In terms of medium, conversations are classified into two categories: face-to-face and mediated conversations that occurred on cellphone. In terms of the social relation between interlocutors along the scale of familiarity and power, conversations are put into five groups of speech situations: a. familiar and equal, b. familiar and unequal, c. strange and equal, d. strange and unequal, e. intimate friends or families.
The conversations were recorded with cellphone’s build- in recording software automatically by the contributors themselves or with digital voice recorders and other recording tools, like Mp3 players, etc., by the contributor’s friends who were not the addressees. The contributors have affirmed that they and their addressees were in the condition of unawareness while the contributed conversations were being recorded. Hence, all conversations occurred in pure real-world conditions and were likely to be unplanned and were recorded with no manual control in pure real-world conditions in which they were occurring.
The 74 female speakers contributing the conversations in this study are from the same university. The youngest speakers are at the age of 19, the oldest speakers are at the age of 27 and their average age is 22.43. According to the research by Hughes, et al. [1], the 74 female speakers are sociolinguistically homogeneous speakers in terms of phonetic features_,_ which qualifies the 118 conversations for the FVC research data.
Among the 74 speakers, 44 speakers have contributed two conversations, and another 30 speakers have contributed only one conversation. The detailed information of the speakers and their conversations is displayed in Table 1.
| Speaker | Age | Conversation | Duration (m:s) | Medium | Speech Situation | Time |
|---|---|---|---|---|---|---|
| S01 | 23 | S01.1 | 01:17 | M | c | 12/01/2013 |
| S01.2 | 01:20 | M | d | 01/14/2014 | ||
| S02 | 23 | S02.1 | 01:08 | F | d | 11/20/2013 |
| S02.2 | 00:50 | M | e | 01/02/2014 | ||
| S03 | 25 | S03.1 | 01:02 | F | a | 11/29/2013 |
| S03.2 | 01:27 | M | d | 01/15/2014 | ||
| S04 | 23 | S04.1 | 00:24 | F | b | 12/07/2013 |
| S04.2 | 00:47 | M | e | 01/13/2014 | ||
| S05 | 23 | S05.1 | 00:49 | F | a | 11/16/2013 |
| S05.2 | 01:08 | F | e | 01/08/2014 | ||
| S06 | 23 | S06.1 | 01:00 | M | a | 12/04/2013 |
| S06.2 | 01:00 | M | b | 12/14/2013 | ||
| S07 | 23 | S07.1 | 00:42 | F | d | 11/24/2013 |
| S07.2 | 00:53 | M | b | 01/12/2014 | ||
| S08 | 23 | S08.1 | 01:33 | M | e | 12/07/2013 |
| S08.2 | 00:46 | M | e | 12/30/2013 | ||
| S09 | 23 | S09.1 | 01:28 | M | e | 12/01/2013 |
| S09.2 | 00:56 | M | d | 12/13/2013 | ||
| S10 | 21 | S10.1 | 00:55 | M | a | 11/28/2013 |
| S10.2 | 00:37 | M | e | 01/24/2014 | ||
| S11 | 23 | S11.1 | 02:50 | M | b | 11/16/2013 |
| S11.2 | 01:35 | M | c | 01/12/2014 | ||
| S12 | 25 | S12.1 | 01:06 | F | a | 11/15/2013 |
| S12.2 | 00:51 | F | b | 01/13/2014 | ||
| S13 | 21 | S13.1 | 01:10 | F | a | 11/15/2013 |
| S13.2 | 00:29 | M | b | 01/14/2014 | ||
| S14 | 23 | S14.1 | 01:04 | F | c | 12/08/2013 |
| S14.2 | 00:42 | M | a | 12/29/2013 | ||
| S15 | 23 | S15.1 | 00:36 | F | d | 11/07/2013 |
| S15.2 | 00:32 | M | c | 12/30/2013 | ||
| S16 | 23 | S16.1 | 00:49 | F | a | 12/04/2013 |
| S16.2 | 00:40 | M | e | 01/14/2014 | ||
| S17 | 22 | S17.1 | 00:45 | M | d | 12/04/2013 |
| S17.2 | 00:23 | M | b | 01/25/2014 | ||
| S18 | 22 | S18.1 | 00:51 | F | a | 12/07/2013 |
| S18.2 | 00:40 | F | e | 01/20/2014 | ||
| S19 | 22 | S19.1 | 00:48 | F | d | 12/03/2013 |
| S19.2 | 00:42 | F | a | 01/15/2014 | ||
| S20 | 23 | S20.1 | 01:39 | M | e | 12/01/2013 |
| S20.2 | 01:17 | M | a | 01/25/2014 | ||
| S21 | 23 | S21.1 | 00:49 | F | a | 12/04/2013 |
| S21.2 | 01:07 | F | a | 01/14/2014 | ||
| S22 | 23 | S22.1 | 01:23 | F | d | 10/20/2013 |
| S22.2 | 00:46 | F | a | 01/26/2014 | ||
| S23 | 24 | S23.1 | 00:52 | M | a | 01/13/2014 |
| S24 | 22 | S24.1 | 00:51 | F | a | 01/09/2014 |
| S25 | 23 | S25.1 | 00:38 | F | a | 03/03/2014 |
| S26 | 22 | S26.1 | 00:38 | F | a | 03/03/2014 |
| S27 | 23 | S27.1 | 00:27 | F | a | 03/03/2014 |
| S28 | 23 | S28.1 | 00:38 | M | e | 03/03/2014 |
| S29 | 23 | S29.1 | 00:55 | F | a | 03/01/2014 |
| S30 | 23 | S30.1 | 00:53 | F | a | 03/01/2014 |
| S31 | 23 | S31.1 | 00:36 | F | a | 03/04/2014 |
| S32 | 23 | S32.1 | 00:32 | F | a | 03/04/2014 |
| S33 | 24 | S33.1 | 00:53 | F | e | 03/04/2014 |
| S34 | 23 | S34.1 | 01:15 | F | a | 03/04/2014 |
| S35 | 23 | S35.1 | 00:53 | F | a | 03/05/2014 |
| S36 | 23 | S36.1 | 00:54 | F | a | 03/05/2014 |
| S37 | 23 | S37.1 | 00:53 | M | a | 01/08/2014 |
| S37.2 | 00:45 | M | a | 03/05/2014 | ||
| S38 | 24 | S38.1 | 00:35 | M | a | 01/05/2014 |
| S38.2 | 00:51 | F | a | 03/05/2014 | ||
| S39 | 23 | S39.1 | 00:51 | F | a | 01/06/2014 |
| S39.2 | 00:56 | F | a | 03/05/2014 | ||
| S40 | 23 | S40.1 | 00:47 | F | a | 01/06/2014 |
| S41 | 23 | S41.1 | 00:35 | F | a | 01/08/2014 |
| S42 | 23 | S42.1 | 01:11 | F | a | 03/05/2014 |
| S43 | 23 | S43.1 | 00:50 | F | a | 03/05/2014 |
| S44 | 23 | S44.1 | 00:58 | F | e | 03/02/2014 |
| S45 | 23 | S45.1 | 00:40 | F | e | 03/02/2014 |
| S46 | 23 | S46.1 | 01:24 | F | a | 03/02/2014 |
| S47 | 23 | S47.1 | 01:24 | F | a | 03/02/2014 |
| S48 | 23 | S48.1 | 01:23 | F | a | 01/07/2014 |
| S49 | 23 | S49.1 | 01:26 | F | a | 01/07/2014 |
| S50 | 23 | S50.1 | 01:13 | F | a | 03/02/2014 |
| S51 | 23 | S51.1 | 01:20 | F | a | 03/02/2014 |
| S52 | 24 | S52.1 | 00:48 | F | a | 03/02/2014 |
| S53 | 23 | S53.1 | 00:58 | F | a | 03/02/2014 |
| S54 | 23 | S54.1 | 00:49 | F | a | 01/08/2014 |
| S55 | 23 | S55.1 | 01:15 | F | a | 03/05/2014 |
| S56 | 20 | S56.1 | 00:47 | M | a | 05/13/2014 |
| S56.2 | 00:38 | M | a | 05/30/2014 | ||
| S57 | 22 | S57.1 | 01:56 | M | a | 05/10/2014 |
| S57.2 | 01:14 | M | e | 05/25/2014 | ||
| S58 | 20 | S58.1 | 01:05 | M | a | 05/20/2014 |
| S58.2 | 00:50 | M | a | 06/03/2014 | ||
| S59 | 20 | S59.1 | 01:30 | F | a | 06/03/2014 |
| S59.2 | 01:07 | F | a | 06/12/2014 | ||
| S60 | 19 | S60.1 | 00:26 | M | a | 06/03/2014 |
| S60.2 | 00:40 | F | e | 06/12/2014 | ||
| S61 | 20 | S61.1 | 00:57 | F | a | 06/03/2014 |
| S61.2 | 00:35 | F | e | 06/15/2014 | ||
| S62 | 20 | S62.1 | 00:58 | F | e | 06/03/2014 |
| S62.2 | 00:40 | F | a | 06/12/2014 | ||
| S63 | 20 | S63.1 | 00:40 | F | a | 05/30/2014 |
| S63.2 | 00:35 | M | a | 06/10/2014 | ||
| S64 | 19 | S64.1 | 00:46 | M | a | 05/03/2014 |
| S64.2 | 00:43 | M | a | 05/30/2014 | ||
| S65 | 19 | S65.1 | 00:55 | F | e | 05/30/2014 |
| S65.2 | 01:15 | F | e | 06/12/2014 | ||
| S66 | 20 | S66.1 | 01:34 | F | e | 05/03/2014 |
| S66.2 | 00:50 | F | e | 06/12/2014 | ||
| S67 | 20 | S67.1 | 00:54 | M | a | 06/03/2014 |
| S67.2 | 00:32 | F | a | 06/11/2014 | ||
| S68 | 20 | S68.1 | 00:30 | F | a | 06/03/2014 |
| S68.2 | 00:50 | M | a | 06/15/2014 | ||
| S69 | 20 | S69.1 | 00:50 | F | a | 05/31/2014 |
| S69.2 | 01:36 | M | e | 06/12/2014 | ||
| S70 | 21 | S70.1 | 00:50 | M | e | 06/03/2014 |
| S70.2 | 01:10 | F | a | 06/12/2014 | ||
| S71 | 21 | S71.1 | 01:23 | F | a | 06/12/2014 |
| S71.2 | 00:24 | F | e | 06/23/2014 | ||
| S72 | 21 | S72.1 | 01:00 | F | a | 06/04/2014 |
| S72.2 | 00:45 | F | a | 06/16/2014 | ||
| S73 | 27 | S73.1 | 00:26 | F | a | 05/07/2014 |
| S73.2 | 01:00 | F | a | 06/12/2014 | ||
| S74 | 27 | S74.1 | 00:46 | F | a | 09/11/2013 |
| S74.2 | 01:53 | M | a | 04/25/2014 |
Table 1: Details of Data.
In Table 1, the speakers are serially numbered from S01 to S74 in the first column, and each speaker’s age given in the second column is the age of the speaker at which her earliest contributed conversation was occurring. The conversation for each speaker is labeled according to its speaker as showed in the third column, where S01.1 denotes the first conversation from the speaker S01, and S01.2 the second conversation from the speaker S01. The duration of each conversation listed in the fourth column denotes the total length when each conversation lasts, which includes the contributions from both interlocutors involved in a conversation as well as pause and silence. In the column of Medium, M is the label for the mediated conversations on cellphone, and F for face-to-face conversations. The sixth column denotes the speech situation of each conversation in terms of the social relation between interlocutors along the scale of familiarity and power. There is no overlap of interlocutors among the 118 conversations in this study. The time in the last column denotes the exact date when the conversation occurred, which shows that the time interval between the same speaker’s conversations is from 8 days to more than seven months.
Quantitative Phonetic Features and Measurement
The formant trajectory of a diphthong or a triphthong is the quantitative phonetic feature to be examined in this study whose efficacy has been tested by Zhang & Su [2]. They adopted lab-recorded audio materials to test the efficacy of the diphthong [ai55] and the triphthong [iao55], and have drawn a conclusion that as FVC features both of them work better than a monophthong.
Zhang & Su [2] applied the formant trajectory tracking technique to the measurement of the formant trajectory, which uses Praat, a voice analysis software, to measure the starting point, middle point and end point of the first three formants of a diphthong or a triphthong .
In this study, a cross-validation procedure is designed to test the efficacy of identified quantitative formant trajectory. Aitken & Lucy’s [3] MVKD (Multivariate Kernel Density) procedure is employed to calculate the likelihood ratios generated from a cross-validation procedure, which is implemented with the Matlab programme software by Morrison [4] in Matlab2012a. Based on generated likelihood ratios, a Tippett plot is drawn to evaluate the general performance of the feature, and the log-likelihood-ratio cost (Cllr) is calculated to evaluate the validity of the feature.
Qualitative Phonetic Features and Measurement
In China a spectrum analysis procedure is in common use in legal practice, which examines spectrums of clear sentences, phrases, syllables and phonemes that are identical in tone and voice quality and available in both questioned and known voice samples in order to identify the similarities and differences between their characteristics [5]. Usually, four steps are involved in the spectrum analysis, which in turn are determining the comparable segments, producing the spectrograms of the segments to be compared, comparing the spectrograms of the determined comparable segments, and evaluating the results of comparisons (ibid.).
This study examines pattern characteristics of formants and available adjunctive formants in that the conversations recorded in real-world conditions are not of as good quality as those that are recorded in speech laboratories (ibid.) [6].
Different phonological contexts of comparable segments have great effects on the formant pattern of post-juncture of a vowel, and usually it is very difficult to find a comparable segment in the exactly same phonological contexts, especially, in conversations recorded in real-world conditions. In this context, instead of the formant pattern of post-juncture of a vowel the focuses of investigation in this study are the global pattern of vowel formants, features of every available vowel formant, the duration ratio between initial consonant and its following vowel and the region of intensity of the initial consonant.
CSL4500 is used to present and evaluate the results of a spectrum analysis procedure, which is a hardware and software system by KayPENTAX that can record and display acoustic parameters of speech and voice signals.
Experiment Design
Two experiments are designed to examine the effects of real-world conditions on quantitative and qualitative phonetic features respectively. This part first identifies the data for each experiment, and then describes the experiment procedure of each experiment.
Data and Experiment Procedure for Experiment I
To begin with, all 118 conversations have been examined to identify a diphthong or a triphthong that presents in as many conversations as possible. As a result, [ɑu214] has been the winner that presents in 9 pairs of conversations from 9 speakers and 20 other conversations from 20 other speakers. Hence, the test dataset of a cross-validation procedure is composed of the identified 9 pairs of conversations and the background dataset the identified 20 conversations. Next, two Chinese characters containing [ɑu214] have been located in every conversation to ensure the size of the test dataset and background dataset, as well as the number of tokens for the feature, which makes an LR approach possible in that more than two Chinese character containing [ɑu 214] will be at the cost of reducing the size of both test dataset and background dataset, which will have a bad effect on the results of an LR approach.
Then, the first three formants (F1, F2, and F3) of the two [ɑu214] in every conversation were manually measured using Praat at their starting points, middle points, and end points to extract the quantitative phonetic feature of formant trajectory. The nine formant frequencies at these three points from F1, F2, and F3 compose one token of the feature. There are totally two tokens that have been extracted from every conversation. To screen outliers from the datasets, first, all frequencies that have been extracted from the 38 conversations are converted to z-scores, and then, outliers are identified and removed based on an outlying SD with z > ±3.29 (p < 0.01) [7].
At last, the screened data is input into MVKD procedure to generate likelihood ratios in Matlab2012a, and Tippett plot is drawn and Cllr is calculated with the generated likelihood ratios.
Data and Experiment Procedure for Experiment II
The data for Experiment II is the 9 pairs of conversations from the 9 speakers in the test dataset that is used to in Experiment I.
To do the spectrum analysis, firstly, the comparable segments that are acoustically identical and in similar phonological contexts have been identified in each pair of conversations from the same speaker, which are listed in Table 2.
In Table 2 the 9 speakers are listed with their serial number in the first row and the comparable segments identified from the pair of conversations produced by each speaker are described in the second row, which shows that the identified comparable segments are either single Chinese characters or phrases. The comparable segments, as well as the syllables composing these comparable segments, are counted in the last row, in which the number of comparable segments identified from the pair of conversations by each speaker is given before a slash, and the number of syllables composing those comparable segments comes after the slash. The table shows that in the 9 pairs of conversations being compared, at least 4 comparable segments are available and at most 7 comparable segments are available. The comparable syllables range from 6 to 14.
| Speaker | S01 | S10 | S11 | S13 | S15 | S16 | S17 | S20 | S73 |
|---|---|---|---|---|---|---|---|---|---|
| Comparable Segments | [wo214] [kʻɤ55] [ma] [ʨiu51ȿʻi51] [wən51ji55 ɕia51] | [wo214] [ʨiu51] [bu51] [ɕiɑƞ214] [kən55] [ʨia55] [ʦai51] | [ta51kai51] [ʨiu51ȿʻi51] [na51kɤ51] [ȿʻən35mɤtɤ] [wo214 ɕiɑƞ214 wən51ji55ɕia51] | [xai35] [wan35] [na51kɤ51] [ɀan35xou51] | [ʦuo51] [na51kɤ51] [li214mian51] [ji35jiɑƞ51] | [wo214] [jɑu51] [na51] [ni214kʻan51] [ji35ɕia51] [ʨi214kɤ51] | [tɑu51] [ʨiu51ȿʻi51] [na51kɤ51] [mei35jou214] | [xai35] [man35] [na51kɤ51] [kʻɤ214ji214] [ʨiu51ȿʻi51] [tɑƞ55tʻiæn55] [jiƞ55kai55] | [wo214] [xən214] [tʻiƞ214] [ni21mən] [kʻai55ȿʻi214] [ʨiu51ȿʻi51] [ȿʻi35ʨiæn55] |
| Total | 5/8 | 7/7 | 5/14 | 4/6 | 4/7 | 6/9 | 4/7 | 7/12 | 7/11 |
Table 2: Comparable Segments Identified and Examined in Experiment II.
Next, these syllables identified to be comparable segments are input into CSL4500 to produce the spectrograms. Then the spectrograms of each comparable segment are compared generally in terms of vowel formant pattern and features of vowel formants, as well as the relation between the initial consonant and its following vowel. Finally, the performance of the spectrum analysis is evaluated on the basis of the results of comparison analyses.
Results of Experiments and Discussion
In this part, the results of Experiments I and II are presented, base on which the effects of pure real-world conditions on forensic phonetic features are discussed.
Results of Experiment I and Discussion
In a cross-validation procedure only two same-speaker comparison pairs by the speakers S17 and S73 have been correctly recognized to be of the same origin in terms of the formant trajectory of [ɑu214]. The Tippett for the formant- trajectory of [ɑu214] in Figure 1 shows that the lines below the intersection point are further apart than those above the intersection point, which implies worse performance of this feature. As far as validity is concerned, the Cllr for the formant-trajectory of [ɑu214] is 3.145 and much bigger than one, the usual value of a valid FVC feature.
![Figure 1: The Tippett for the Formant-Trajectory of [ɑu214].](/fulltextimages/8984/fig_1.png)
What’s more, the maximum log-ten-LR value generated by the same-speaker comparisons is 0.9, which is a little lower and can provide only limited evidence to support the prosecution hypothesis that the questioned sample is produced by the known suspect; the minimum log-ten-LR value generated by the different-speaker comparisons is -6.8, which is too large and can provide very strong evidence to support the defense hypothesis that the questioned sample is not produced by the known suspect The above results from this experiment illustrate that the formant trajectory of [ɑu214] is not as powerful as Zhang and Su [2] have predicted based on their research that the formant trajectory of a diphthong or a triphthong is a valid FVC feature and works better than a monophthong. On the contrary, its performance is too poor to be a forensic feature. The only reasonable explanation for its poor performance can only be due to the adoption of pure real-world conversations as the experiment materials in this study.
Firstly, the diphthong Zhang and Su use is [ai55] from the same Chinese character that means “grief”. In their experiment, speakers are asked to read 20 phrases including the examined Chinese character. But, the experiment materials used in this study are conversations recorded in real-world conditions. In this experiment, the choice of [ai55] as the diphthong to be investigated cannot ensure the size of test dataset, and especially the size of background dataset. In this experiment, [ɑu214] is used because only this diphthong has been identified to be the most available among all Chinese diphthongs and triphthongs in the database of 118 conversations for this study. It’s worth noting that such availability is ensured in the case that the tokens of [ɑu214] are not extracted from the same Chinese character as Zhang and Su did. Furthermore, in Zhang and Su’s experiment, twenty tokens are used, but, in this experiment, at most two tokens are ensured so that these tokens can be guaranteed in the similar phonological contexts.
Most importantly, Zhang and Su use lab-recorded experiment materials to test the performance of formant trajectory. Their sampled speakers are asked to read designated phrases containing [ai55] in laboratory to guarantee the examined diphthong in the similar phonological contexts. Those speakers are recorded with the same recording software and hardware, and the sampling rate has been set to be the same. Opposite to the ideal lab condition, the conversations used in this study are interactive naturally-occurring conversations that have been recorded with different brands of mobile phones or digital voice recorders in pure real-world conditions while they were occurring.
Although [ɑu214] is not the diphthong that has been tested to be the powerful phonetic FSR parameter, [іɑu55] has been tested to be more powerful than [ai55] by Zhang and Su. Therefore, [ɑu214] could not have performed that worse as it did in this study if designated lab-recorded experiment materials had been used.
In short, this experiment provides the strong evidence that adoption of naturally-occurring conversations is the most important and immediate factor that results in the worse performance of the formant trajectory of [ɑu214], and the results of this experiment illustrate that pure real-world conditions do affect the availability of formant trajectory and consequently lead to its worse performance than expected of.
Results of Experiment II and Discussion
In Figures 2 through 10 the spectrograms of comparable segments identified in each pair of conversations from the same speaker are arranged in two rows with the Chinese and international phonetic transcription at the bottom.
Generally speaking, these figures demonstrate that the spectrograms of the identified comparable segments from the pairs of conversations by the same speaker differ to various degrees in terms of vowel formant pattern, region of intensity of the initial consonant and the duration ratio between the initial consonant and its following vowel.
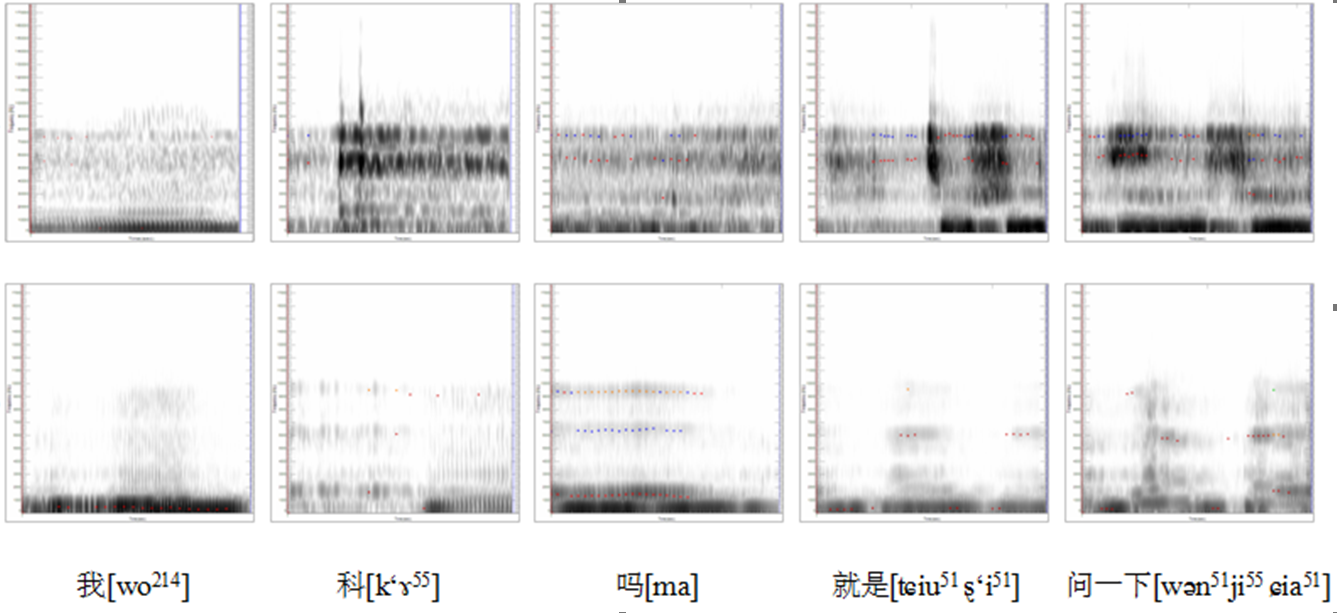
Figure 2 displays that the five comparable segments identified in the pair of conversations by S01 are Chinese characters 我, 科, 吗, and phrases 就是 and 问一下. The spectrograms of the segments from S01’s second conversation in the bottom row display clearer outlines of vowel formant than those from S01’s first conversation in the top row. For instance, the outlines of vowel formants in the syllables [kʻɤ55] and [ma] in the top row are too fuzzy to be actually detected. But, the region of intensity of the initial consonant in each syllable from S01’s second conversation in the bottom row is not as clear as that from S01’s first conversation in the top row.
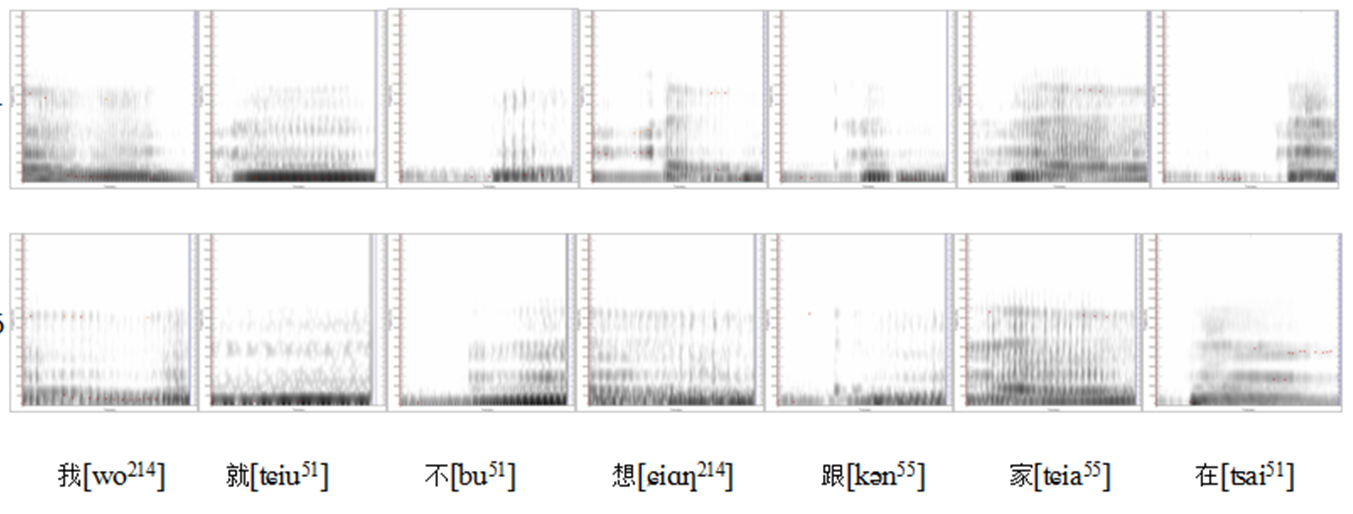
Figure 3 displays the spectrograms of the seven comparable segments identified in the pair of conversations by S10. As for the first comparable segment [wo214], the vowel formants of this syllable from S10’s second conversation in the bottom row have very fuzzy outlines so that it is difficult to make a comparison with those from S10’s first conversation in the top row; the duration ratio between the initial consonant and its following vowel differs between the syllables from S10’s two conversations, which is around 1/2 in the top row, and is around 1 in the bottom row.
The vowel formants of the syllable [ʨiu51] from S10’s first conversation in the top row are fuzzy, and those from S10’s second conversation in the bottom row are nearly absent except for the fundamental frequency F0. That means that the comparable segment [ʨiu51] plays no role in comparing speakers.
Likewise, the vowel formants of the syllable [bu51] from S10’s first conversation in the top row, and those of the syllable [ɕiɑƞ214] from S10’s second conversation in the bottom row are too fuzzy to be identified. The duration ratio between the initial consonant and the following vowel in the syllable [bu51] from S10’s first conversation in the top row is obviously bigger than one, while the duration ratio between the initial consonant and the following vowel in the syllable [bu51] from S10’s second conversation in the bottom row is obviously smaller than one.
The duration ratio between the initial consonant and the following vowel in the syllable [kən55] from S10’s two conversations is very close. Also the region of intensity of the initial consonant in the syllable [kən55] from S10’s two conversations is located below 1000Hz. But, the outline of the second vowel formant of [kən55] from S10’s second conversation in the bottom row is fuzzy, and the trends of the first formants of [kən55] from S10’s two conversations are different.
As for the comparable segment [ʨia55], the rear section of the second vowel formant from S10’s second conversation in the bottom row is fuzzy, but the central frequencies of the first, the second, and the third formants of the vowel from S10’s two conversations are very close. The duration ratio between the initial consonant and the following vowel from S10’s first conversation in the top row is twice as that from S10’s second conversation in the bottom row.
As for the last comparable segment [ʦai51], the duration ratio between the initial consonant and the following vowel from S10’s first conversation in the top row is twice as that from S10’s second conversation in the bottom row, and the region of intensity of the initial consonant from S10’s first conversation in the top row does not come out. In addition, the central frequencies of the second and the third vowel formants from S10’s first conversation in the top row are a little higher than those from S10’s second conversation in the bottom row. In short, no conclusion of match can be reached based on the above analyses.
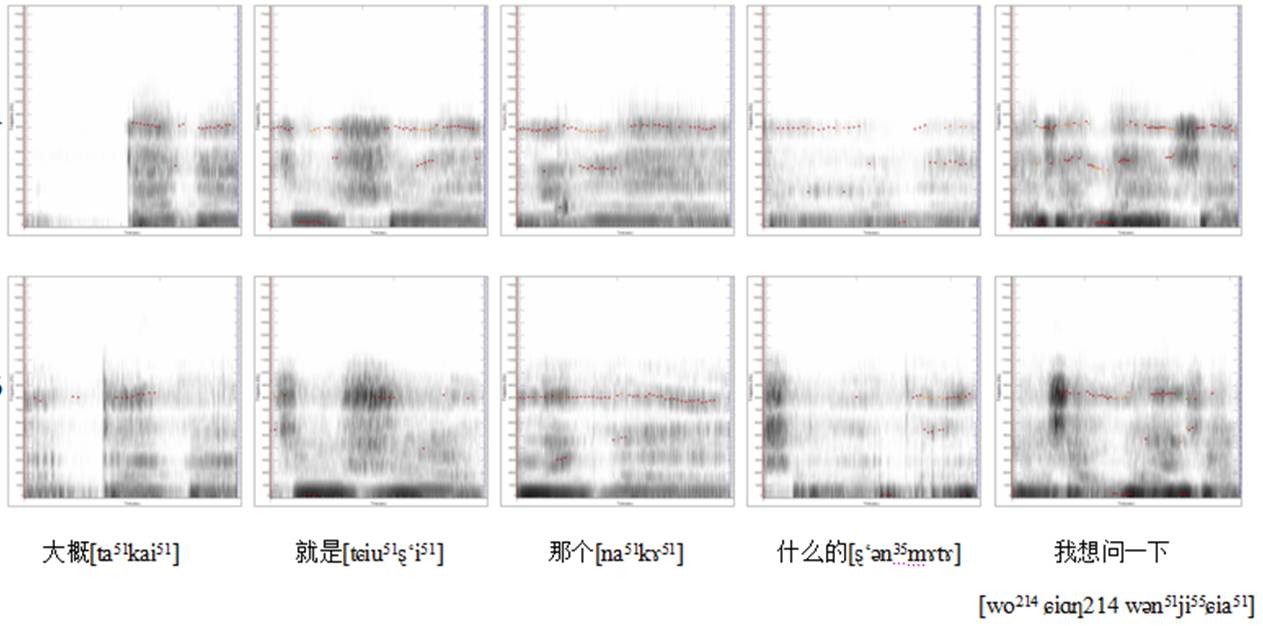
Figure 4 displays the five comparable segments identified from the same-speaker comparison pair by S11, which contain fourteen syllables. As for the first comparable segment [ta51kai51] containing two syllables, the vowel trend of the first syllable [ta51] from S11’s first conversation in the top row is different from that from S11’s second conversation in the bottom row. Likewise, the pair of conversations differ in the vowel trends of [ȿʻi51] in the comparable segment of [ʨiu51ȿʻi51], and of [ɕiɑƞ214] in the comparable segment of [wo214 ɕiɑƞ214 wən51ji55ɕia51].
In addition, the duration ration between the initial consonant and the following vowel [a] in the first syllable of the comparable segment of [ta51kai51] from S11’s first conversation in the top row is as about 1.5 times as that from S11’s second conversation in the bottom row. Again, the region of intensity of the initial consonant [t] in the first syllable of the comparable segment of [ta51kai51] from S11’s
first conversation in the top row is below 1000Hz, while the region of intensity of [t] from S11’s second conversation in the bottom row is much broader. Similarly, the region of intensity of [ȿʻ] in the first syllable of the comparable segment of [ȿʻən35mɤtɤ] from S11’s first conversation in the top row is below 1000Hz, while in the bottom row it is above 2000Hz.
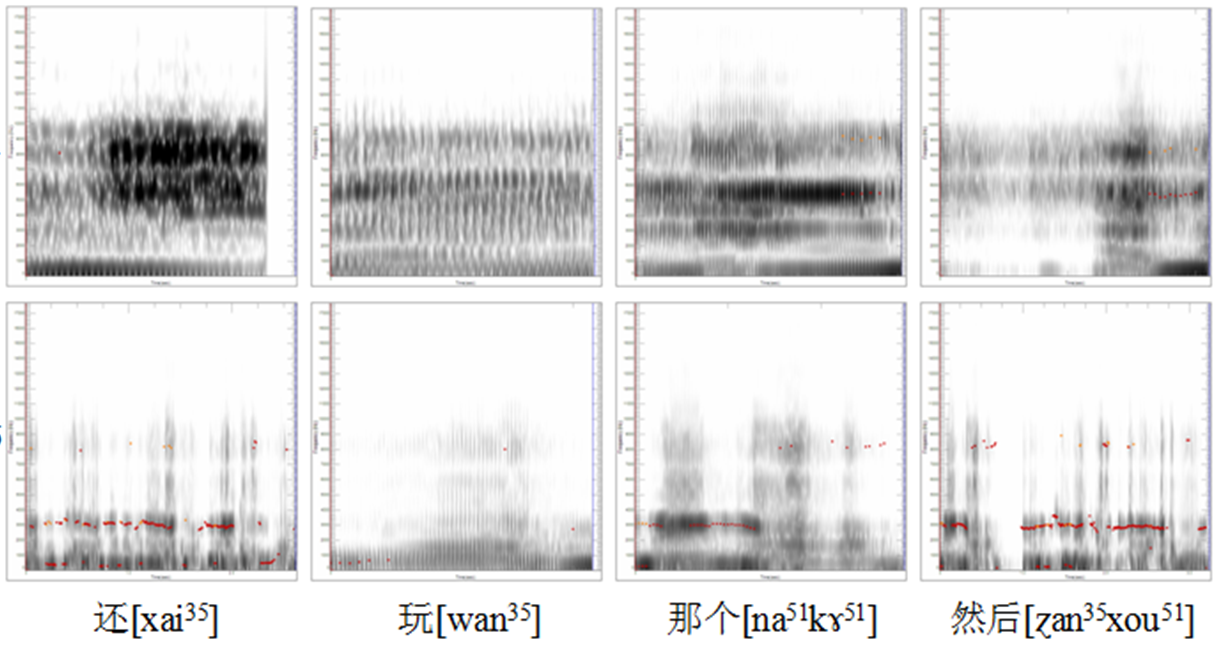
Figure 5 displays the four comparable segments identified from the pair of conversations by S13, which contain six syllables. The vowel formants of [xai35], [wan35] and [ɀan35], the first syllable of the comparable segment of [ɀan35xou51], from S13’s first conversation in the top row are fuzzy, which makes the comparison of formant pattern difficult.
In addition, the comparable segment of [na51kɤ51] in the pair of the conversations differs in the whole formant pattern. So is the syllable of [xou51] in the comparable segment of [ɀan35xou51].
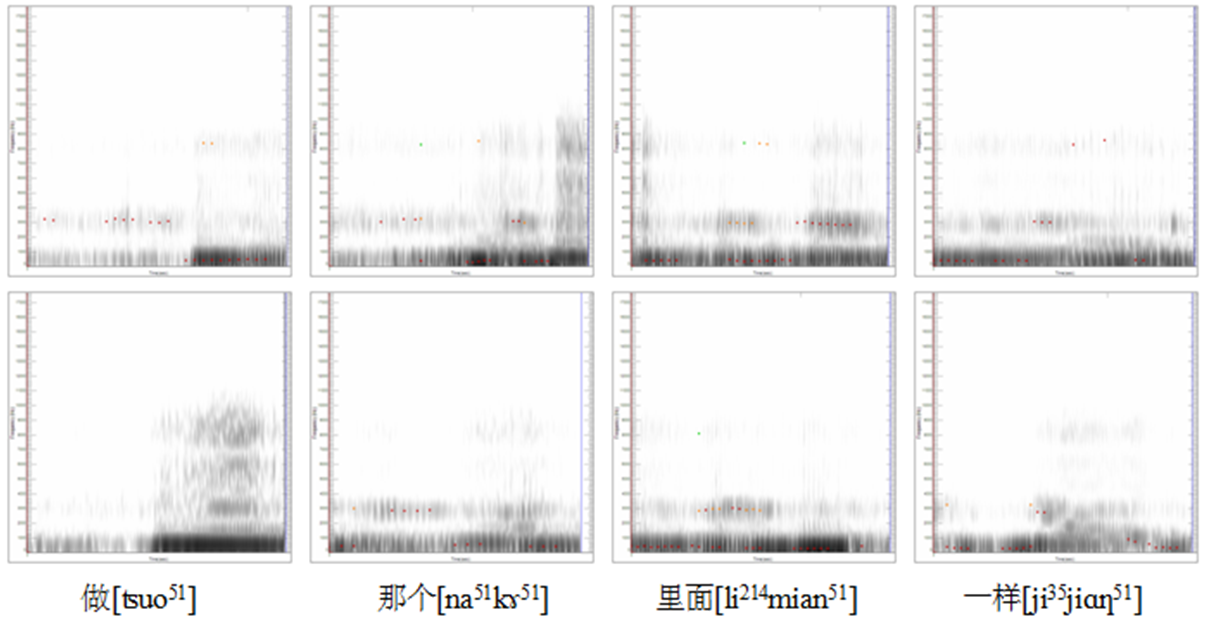
Figure 6 displays the four comparable segments identified from the pair of conversations by S15, which contain seven syllables. Firstly, the outlines of the first and the third vowel formants in the syllable [ʦuo51] from S15’s first conversation in the top row are not very clear, and the second vowel formant is absent. As a result, few features relating to this comparable segment [ʦuo51] can be used as parameters to compare this pair of conversations. The second and the third vowel formants in the syllable [na51] in the comparable segment [na51kɤ51] are absent in S15’s first conversation in the top row; the first vowel formants present in both rows, but their trends are different. In the second syllable in [na51kɤ51], the second and the third vowel formants are very fuzzy, and their first vowel formants also differ in trend. In addition, additional formant presents between the fundamental formant and the first formant in S15’s second conversation in the bottom row, but is absent in S15’s first conversation in the top row.
As for the comparable segment [li214mian51], the second vowel formants are absent in its first syllable [li214] in both S15’s conversations, and the second and the third vowel formants are absent in its second syllable [mian51] in S15’s second conversation in the bottom row. Further, the third vowel formants in its first syllable available in both rows, as well as the second and the third vowel formants in its second syllable available in the top row, have fuzzy outlines. Besides, the first vowel formants in the syllable [li214] display different trends in S15’s two conversations.
As for the last comparable segment [ji35jiɑƞ51], except for the first vowel formant in the syllable [[ji35], all other vowel formants in S15’s both conversations are either absent or too fuzzy to be identified.
The analyses of these four comparable segments illustrate that there lack enough parameters to reach a conclusion that this pair of conversations are of the same origin or of different origins.
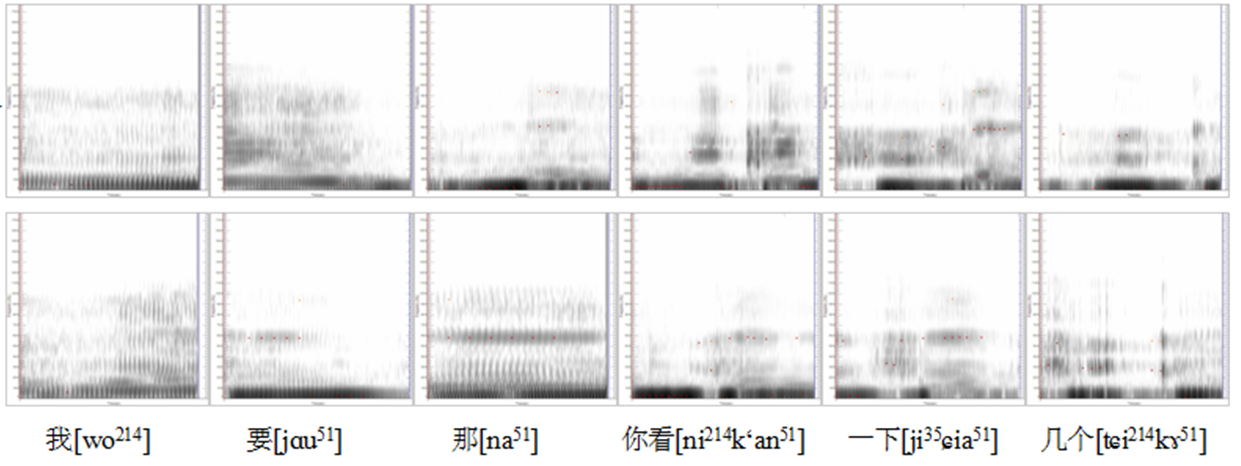
Figure 7 displays the six comparable segments identified from the pair of conversations by S16, which contain nine syllables. Firstly, vowel formants of the comparable segments [wo214] and [jɑu51] in the top row, [na51] in the bottom row are fuzzy, which makes it difficult to compare these comparable segments in terms of vowel formant pattern.
Next, the pair of conversations by S16 differ in the trend of vowel formants of [ni214] in the comparable segment of [ni214kʻan51], and [ʨi214] in the comparable segment of [ʨi214kɤ51]. Furthermore, three syllables in the pair of conversations differ in the duration ratio between the initial consonant and its following vowel. The three syllables are [kʻan51] in the comparable segment of [ni214kʻan51], [ɕia51] in the comparable segment of [ji35ɕia51], and [ʨi214] in the comparable segment of [ʨi214kɤ51].
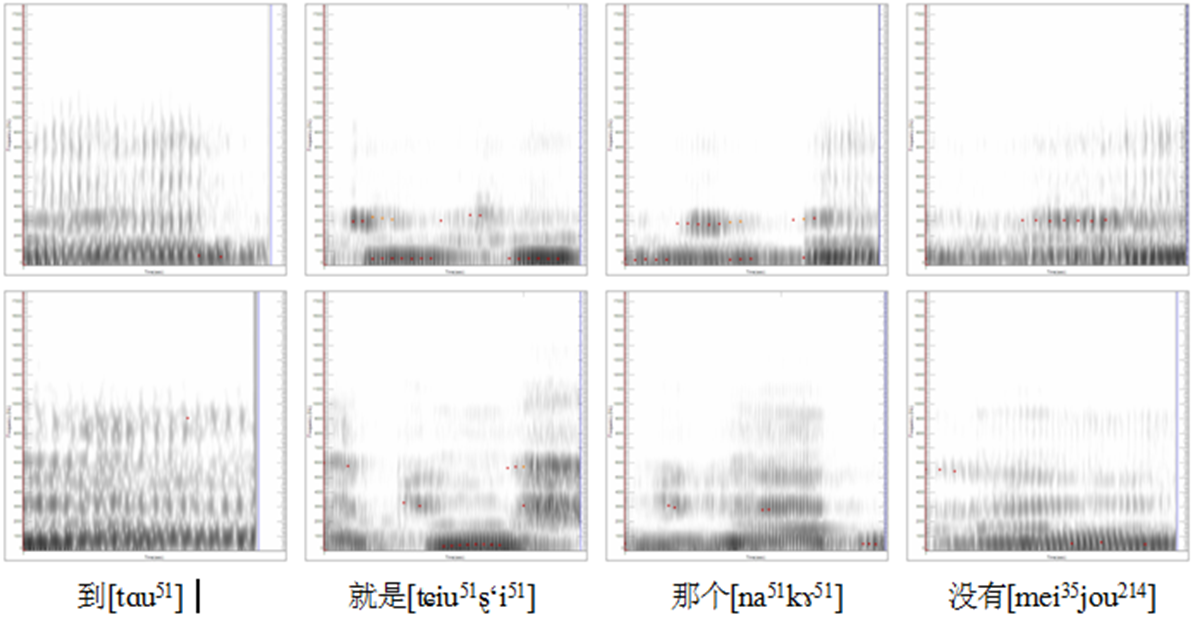
Figure 8 displays the four comparable segments identified from the pair of conversations by S17, which contain seven syllables. Among the seven syllables, five syllables in the top row and one syllable in the bottom row have fuzzy vowel formants. The five syllables in the top row are [tɑu51], [ʨiu51ȿʻi51], [kɤ51] and [jou214]. The one syllable in the bottom row is [tɑu51].
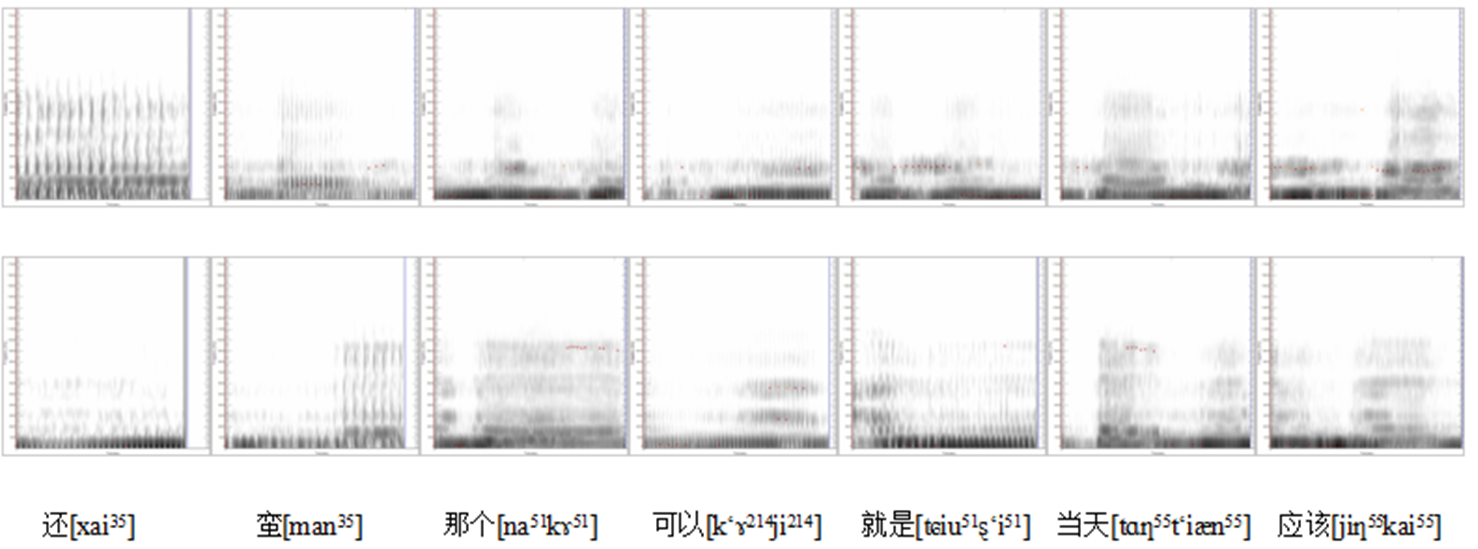
Figure 9 displays the seven comparable segments identified from the pair of conversations by S20, which contain twelve syllables. Firstly, three syllables in the top row and seven syllables in the bottom row have fuzzy vowel formants. They are [xai35] and [tɑƞ55tʻiæn55] in the top row, and [xai35], [man35], [na51kɤ51], [kʻɤ21] and [ʨiu51ȿʻi51] in the bottom row.
In addition, the pair of conversations differ in the vowel formant pattern of the comparable segment of [jiƞ55kai55]. Also, they differ in the trend of vowel formants of [ji214] and [tɑƞ55].
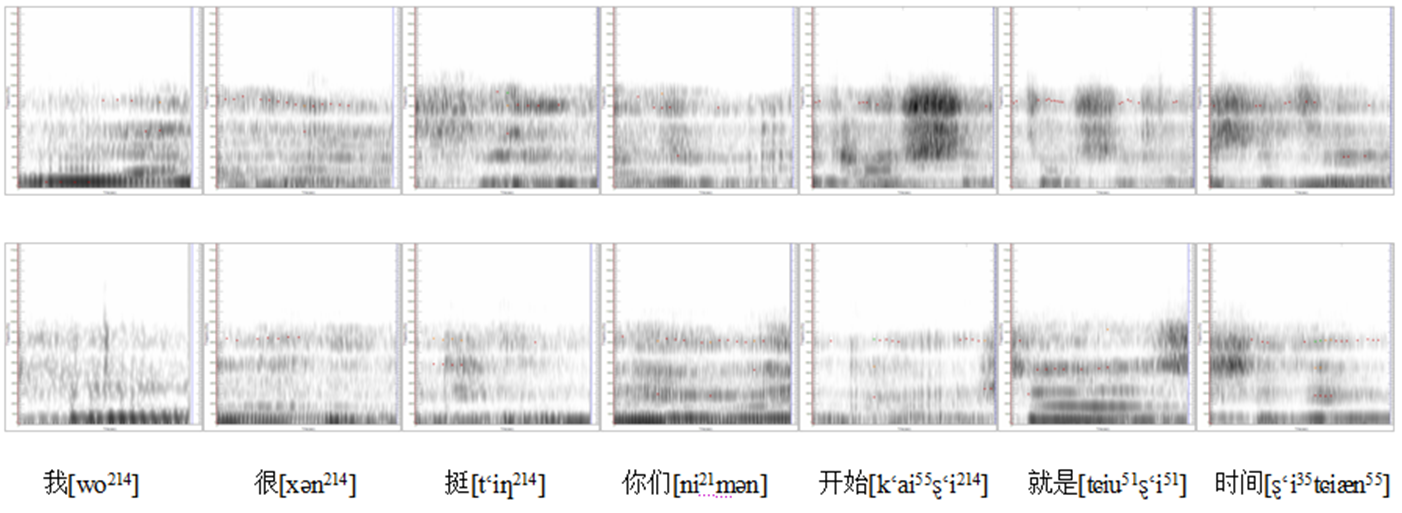
Figure 10 displays the seven comparable segments identified from the pair of conversations by S73, which contain eleven syllables. Firstly, five syllables from four comparable segments have fuzzy vowel formants. They are [mən] and [ʨiu51ȿʻi51] in the top row, and [wo214] and [xən214] in the bottom row. Next, the vowel formant pattern of the syllable [kʻai55] in the top row is different from that in the bottom row. Furthermore, the syllables of [tʻiƞ214], and [ȿʻi35] have different trend of vowel formants in the pair of conversations.
The duration ratio between the initial consonant and its following vowel in the syllable of [ni21] in the top row is about twice than that in the bottom row. The regions of intensity of the initial consonant of the three syllables [kʻai55ȿʻi214] and [ʨiæn55] in the top row are darker than those in the bottom row.
Except for the pair of conversations by S13, all other eight pairs of conversations have syllables that have fuzzy vowel formants in their spectrograms. In addition, all pairs of conversations have syllables in whose spectrograms the intensity region of an initial consonant is absent. The fuzzy outlines of vowel formants and absence of intensity region of the initial consonant may be due to different recording machines or the uncontrolled environments in which the samples were being recorded. One consequence of such influences is that not as many features as needed can be detected precisely and then be used as parameters in every syllable even if enough comparable segments are available.
To sum up, the spectrum analysis is adopted to analyze the 9 pairs of same-speaker comparisons. The results illustrate that some comparable segments played a small role during the process of comparing speakers due to fuzzy vowel formants or even the absence of vowel formants. As a result, it was difficult to reach a conclusion of match or non-match in the spectrum analysis procedure for there lacked enough qualitative phonetic parameters to perform the comparison task. The main possible factors to reduce the number of parameters or result in the absence of some phonetic parameters must be the effects of different recording machines and the real-world conditions under which natural conversations occurred and were being recorded. These results vividly exemplify the great effects that real-world conditions cast on the phonetic FVC parameters [8, 9].
Conclusion
This study examines the effects of real-world conditions on FVC phonetic features by adopting natural conversations that occurred and were recorded in pure real-world conditions. Two experiments are designed to demonstrate the effects of pure real-world conditions on quantitative and qualitative FVC phonetic features respectively.
The results of Experiment I demonstrate that the availability of formant trajectory of a diphthong or a triphthong cannot be assured when the experiment materials are natural conversations instead of designated lab materials, and consequently, the available formant trajectory may perform too worse to be qualified as an FVC phonetic feature.
The results of Experiment II first demonstrate that in a speaker’s natural conversations there are nearly no comparable segments in exactly identical phonological contexts and only limited amount of comparable segments in similar phonological contexts; secondly prove that diversified recording machines and real-world conditions reduce the number of qualitative phonetic features that play roles in comparing speakers, and consequently, a conclusion of match or non-match from a spectrum analysis procedure is difficult to reach.
To sum up, this study provides sound evidences that pure real-world conditions reduce both the amount and quality of available quantitative and qualitative phonetic features, which consequently makes FVC impossible or FVC results less valid and reliable.
References
-
Hughes V, Brereton A, Gold E (2013) Reference Sample Size and the Computation of Numerical Likelihood Ratios Using Articulation Rate. York Papers in Linguistics 13: 22-46.
-
Zhang C, Su B (2012) Application of Dynamic Characteristics of Formants to Forensic Speaker Identification. Journal of China Criminal Police University 2: 48-52.
-
Aitken CGG, Lucy D (2004) Evaluation of trace evidence in the form of multivariate data. Applied Statistics 53(1): 109-122.
-
Morrison GS (2007) Matlab implementation of Aitken & Lucy’s (2004) forensic likelihood-ratio software using multivariate-kernel-density estimation.
-
Wang Y (2013) Voiceprint Identification Technology. Beijing: Masses Publishing House.
-
Wang Y, Jin Y (2001) Adjunctive formants phenomenon and its application to voiceprint identification. In: Cai L, Zhou T, et al. (Eds.), The Proceeding of 5th national conference on modern phonetics. Beijing: TSINGHUA University Press, pp: 383-386.
-
Tabachnick BG, Fidell LS (2007) Using Multivariate Statistics. 5th (Edn.), Pearson Education, Inc.
-
Zhang C, Morrison GS, Thiruvaran T (2011) Forensic voice comparison using Chinese /iau/. Proceedings of the17th International Congress of Phonetic Sciences, Hong Kong.
-
Zhang C, Morrison GS, Ochoa F, Enzinger E (2012) Reliability of human-supervised formant-trajectory measurement for forensic voice comparison. The Journal of the Acoustical Society of America 133(1): EL54-EL60.
- Forensic Implications of Adverse Drug Reactions in Schizophrenia A Case Series
- Narcotics and Digital Forensics: Bridging Crimes in the Digital Age
- Ethics in Forensic Psychiatry: Principles, Dilemmas, and Human Rights
- Impact of Acute Stress on Attentional Orienting to Social Cues
- Head Injury and Intracranial Hemorrhage in Western Region of Libya
- A Forensic Study on Handedness: Examination of Handwriting Features in Right and Left Handed Writers