Unexpected Historical Trends in Elemental and Stable Isotope of Carbon and Nitrogen Composition of Brazilian Banknotes: A Potential Tool for Money Counterfeiting Analysis
In this paper, we did a broad prospective survey on the use of elemental concentration and carbon and nitrogen isotope ratios of Brazilian banknotes as a forensic tool to help elucidate cases of money counterfeiting. We analyzed C and N concentrations, and carbon (expressed as 13C) and nitrogen (expressed as 15N) isotopic ratios of 177 banknotes issued from 1944 to 2013 of different banknote denominations and with several replicates of the same denomination. As money paper is composed of vegetal C3 plant constituents, such as cotton, wood, or linen, we compared our results to known Brazilian C3 plant elemental and isotopic composition. We found a lower coefficient of variability (CV) among same year banknotes, compared to plants. The CVs were nearly constant with the banknote age for the parameters analyzed. As in nature, the lowest CVs were observed for carbon concentration and 13C values (1%), followed by nitrogen concentration and C:N ratio (14%), and 15N values (24%). We found historical trends in banknotes’ N concentration, C:N ratio and 13C values. The historic trends found here open the opportunity to use such changes as a forensic tool in money counterfeiting analysis. However, more studies are needed to establish a solid basis for this purpose, such as the analysis of counterfeit banknotes, banknotes from different countries, and fiber analysis.
Introduction
Historically, paper money began in the Middle Ages, when paper receipts from gold deposits circulated with exchange value. These letters of credit developed later to paper money bills, when banks were forced to develop a money system, which had value and credibility.
Until 1896, Brazilian banknotes could be issued by different institutions, either public or private [1]. Only after that year, the emission was centralized by the National Treasury, and from 1964 onwards by the Central Bank of Brazil (BCB). Since its independency, Brazil has already had seven different currencies (Réis, Cruzeiro, Cruzeiro Novo, Cruzado, Cruzado Novo, Cruzeiro Real and Real), one of them, the Cruzeiro, being used in three different periods: 1942-1967, 1970-1986 and 1990-1993.
Since their origins, banknotes have stirred the interest of forgers. In Brazil, the first reports of forgery date back to 1835 [1]. Money forgery is a main concern of all countries, and central banks constantly monitor the amount of forged money seized every year. Besides financial losses, forgery may also damage the image of a country and its capacity to keep their banknotes safe. In extreme cases, a high percentage of forgery may even lead to a total replacement of a specific denomination. This happened, for instance, in 2017, when the Royal Mint admitted that one in every 30 coins of one pound in circulation were fake [2], or in 2004, when the Canadian CA$ 20.00 reached the impressive mark of 350 thousand seized banknotes. After redesign, in two years, the number of counterfeit banknotes dropped by one half [3]. In Brazil, statistics about seized banknotes began to be released only in 2013 [4], and since then, approximately 0.5 million forged banknotes are seized each year.
Paper quality is one of the main tools used to hinder forgery. Cotton is known to be the main raw material used to produce banknotes and different countries use it in different proportions with other fibers. While the Euro is composed of 100% cotton [5], American dollars are composed of 75% cotton and 25% linen [6]. In Brazil, the Central Bank does not declare the exact composition of banknotes [7]. Regardless of this, paper has an extremely important role in identifying fake banknotes. In a survey carried out in 2018 by the Central Bank of Brazil, with two focus groups, 33% of consumers and 48% of merchants pointed out the texture and thickness of the paper as a factor that led them to identify a forgery, and 59% of consumers and 48% of merchants said that paper is one of the verification points for banknotes, following just watermark (with 72%) [8].
To curb forgery, it is important to track the origin of the raw materials used to make counterfeit money bills. In 2009, the US Congress reported the existence of high-quality dollar banknotes, called supernotes or superdollars, claiming they were produced by the North Korean government [9]. By then, it was estimated that US$ 45 million of these supernotes were in circulation. Another famous case of forgery sponsored by a nation occurred during the Second World War, when Operation Bernhard, conducted by Germany, counterfeited more than £ 134 million in order to weaken the British economy [10, 11] . When such quality and quantity is applied in forgery, additional tools may be needed to supplement those commonly used by forensic examiners.
This matter is so important that there are many techniques in forensic science used to detect money counterfeiting. Lehmann, et al. [12] recently published a comprehensive review of elemental and molecular analysis techniques employed in forensic chemistry. Several of these techniques are direct and straightforward, not requiring sample preparation. However, it is surprising to see that there have been only a few studies using isotopic tools to address this subject [13]. Because principal elements of paper are C, N, H, and O, this material is well suited for stable isotope studies. Cerling, et al. [13] used the global cotton isoscape from West, et al. [14] as a tool for tracking sources of US counterfeit money. They compared δD and δ18O values of cotton from genuine bank notes to the counterfeit ones confiscated by law enforcement agencies.
Until now, no attempt to use carbon and nitrogen stable isotope analysis has been done, even though δ13C already proved to be useful for office paper analysis [15, 16, 17, 18]. After all, most banknotes are made of plant material, mainly cotton or cotton-linen mixtures, like the US dollar. Stable isotopes can provide important information on geographic provenance of the raw materials used, since carbon and nitrogen isotopes, as well as oxygen and deuterium stable isotopes, are linked to climatic conditions of the crop growing area [19]. For instance, there are several examples of using stable isotopes to track the origin of plant-based drugs, like cocaine [20, 21], heroin [22] and marijuana [23, 24, 25, 26] .
Here we present the first prospective data on carbon and nitrogen stable isotopes of Brazilian currency in order to investigate the potential use of this technique in forensic science. We took a historic perspective by analyzing 177 banknotes of Brazilian currencies issued from 1944 to 2013. In this period, different printers were responsible for producing Brazilian banknotes: the American Banknote Company (ABNC, USA), Thomas de la Rue (TLR, UK), Waterlow & Sons (UK), Giesecke & Devrient (Germany), Oberthur (France), Crane (Sweden) and mostly by the Casa da Moeda do Brasil (CMB, Brazil). This diversity of printers may represent a variety of raw material provenance, which may be used for forensic purposes. Here, we analyzed banknotes from three of these printers: ABNC, TLR and CMB.
Materials and Methods
We obtained the banknotes from several sources. Some of them were acquired through specialized sellers, while others came from private collections. Several banknotes were replicates, which allowed us to investigate the isotopic variability in banknotes issued in the same period. Banknotes were simply cleaned with a soft brush and any visible residues incrusted on their surface were removed. A thin strip from the edge of each banknote was then cut, taking care to cause minimal damage, and avoiding the security threads and synthetic fibers, including UV-reactive invisible fibers (whenever they were present). The analysis was conducted on 2.5 to 2.8 mg of each sample, weighed in tin capsules for solids.
For each banknote, the carbon and nitrogen elemental composition (expressed as percentage in this study), as well as the carbon and nitrogen isotopic ratios were determined using an Elemental Analyzer (model 1110, Carla Erba, Milan, Italy), coupled to a ConFlow IV interface and a Delta V Plus mass spectrometer (Finnigan MAT, San Jose, California, USA, now Thermo Scientific). Carbon and nitrogen isotopic ratios were reported as a deviation of a standard using the classical “δ” notation proposed by Craig [27].
δX = (Rsample/Rstandard – 1)·1000 Where, X denotes carbon or nitrogen, and R denotes the isotopic ratios of carbon (13C:12C) and nitrogen (15N:14N), the sample and standard, respectively. The international standard for carbon is a Cretaceous fossil marine animal (Belemnitella americana) found in the Pee Dee formation, located in South Carolina (USA), known as PDB, and the standard for nitrogen is atmospheric air. The samples were anchored to international scales by the use of international reference materials: NBS-19 and NBS-22 for carbon, and IAEA-N1 and IAEA-N2 for nitrogen. Precision of the analytic method was based on replicas of an internal standard (sugarcane leaves) every twelve samples in each batch, and was estimated in 0.09 ‰ for carbon and nitrogen.
We present the historical variability of the elemental and isotopic composition of some Brazilian currencies, by correlating these variables with the year a banknote was issued, here called “year of issuance”. The information about the banknote issuance year was obtained from Amato, et al. [28].
The coefficient of variation (CV) for each banknote collection, grouped per year of issuance, was compared with a collection of tree leaves that follow the C3 photosynthetic pathway from most of the Brazilian vegetation types, that hereafter will be referred to as “Brazilian C3 leaves”.
We tested also whether the correlation between the independent and dependent variables were significant by simple regression using the package lme4 of the R statistical platform. The dataset used in this study can be found in Table 1.
Results and Discussion
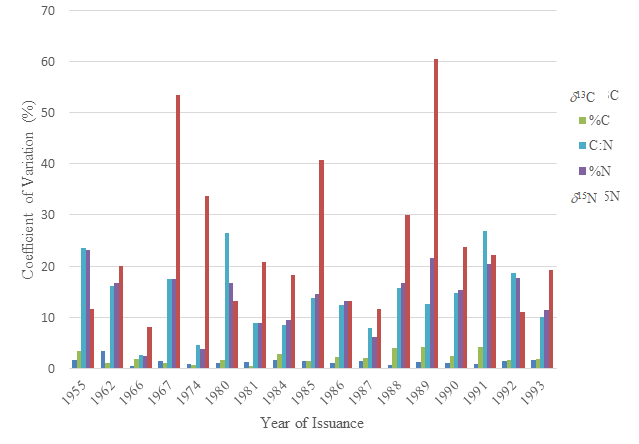
In forensic science, it is a major concern to know information about the variability of chemical and isotopic parameters of the target material, in our case a year banknote collection. We tested here the inter-sample variability of banknotes issued in the same year, when a specific year had enough samples, by determining the coefficient of variation (CV) of each population (Figure 1).
The CVs of carbon and nitrogen elemental and isotopic compositions were nearly constant among different collections, which means that the CVs did not vary in time (Figure 1). Among the parameters studied, the lowest CVs were found for δ13C and %C, followed by C:N ratio, %N and δ15N values (Figure 1). This trend among CVs for different parameters followed the same trend observed in foliar tissues collected in nature from Brazilian C3 trees leaves from several biomes of Brazil. However, Brazilian C3 tree CVs were higher. For instance, for δ13C and %C, the CVs were near 10%, in contrast to the 1% to 2% found here (Figure 1). For %N and C:N ratio, the CVs were near 50% in Brazilian C3 trees, as opposed to 14% found in this study. Finally, δ15N values showed the highest CVs, more than 100% for Brazilian C3 trees leaves and around 24% in this case (Figure 1).
The higher CVs for nitrogen and δ15N are expected as nitrogen is a limiting element in nature, and plants use several strategies to acquire this nutrient from different sources, mainly from the atmosphere and soil [29]. In addition, plants may take in nitrogen in different inorganic forms, like ammonium and nitrate. Some plants are even capable of absorbing small organic molecules such as amino acids. δ15N integrates the N stable isotopic signature of N sources and isotope fractionations against the heavier isotope 15N during N transformation reactions, mainly those mediated by microorganisms such as nitrification and denitrification [30]. As for the leaf samples, they integrate N dynamics over the leaf lifespan and depend on the rates of N mineralization in the soil [31], which is integrated over decades of organic matter decomposition. Commercial crops like cotton, used to produce banknotes, may also have an extra source of nitrogen, such as N-fertilizers, made from N from atmospheric air, which is the standard for δ15N; therefore, most N-fertilizers have a δ15N near 0‰.
On the contrary, carbon is rarely limiting to plants, and most plants take carbon from the atmosphere as CO2 in order to produce photosynthesis, which in turn has a fairly constant carbon isotopic ratio (δ13C = -8.4‰). Most of the variability in plant carbon isotopic ratios is caused by the photosynthetic metabolism and water availability. Plants follow three main photosynthetic metabolisms: C3, C4, and CAM, which discriminate differently against the heaviest isotope (13C), generating quite distinct δ13C values among these plants [32].
However, banknotes are generally made with cotton and cotton follows the C3 metabolism, as do most trees around the world. Accordingly, the variability found among Brazilian banknotes cannot be explained using plants that follow distinct photosynthetic metabolism, since all species used for making banknote paper are C3 plants. The δ13C values of C3 plants in nature varies from -38‰ to -22‰, and most of this variation can be explained primarily by water availability, which can affect δ13C of C3 plants living side-by-side but with a distinct water supply [32]. The δ13C values of C3 plants are inversely proportional to the increase of water availability, which means that plants with plenty of water available will have more negative δ13C values than plants with less water available. This fact results in important differences among regions of a country like Brazil, which has continental dimensions with marked climatic variability. Therefore, a plant growing in the Amazon region would have more negative δ13C values than the same plant species growing in the Caatinga of the Northeastern part of the country or in the Cerrado area of Central Brazil. The same trend can be observed in commercial crops such as cotton which, in field trials, showed substantial differences in δ13C among plants receiving different levels of water supply [33], since it is well known that irrigation is the main factor affecting δ13C in plant leaves of commercial crops.
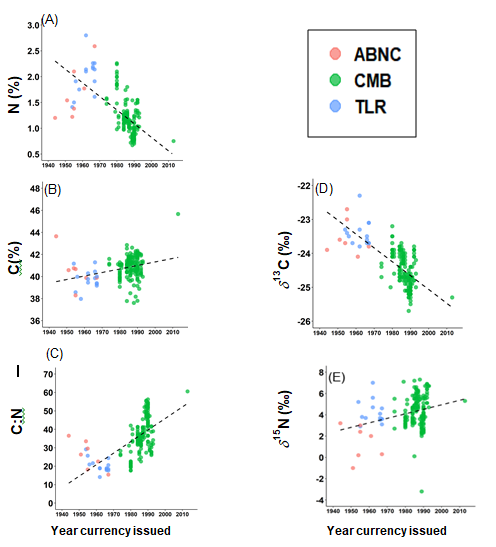
We found historic trends in the elemental and isotopic composition of different Brazilian banknotes (Figure 2). The nitrogen concentration of banknotes (%N) decreases with the year of issuance (r2 adj = 0.38, P < 0.01), which in turn is followed by a sharp increase in the C:N ratio over the years (r2 adj = 0.35, P < 0.01) (Figure 2). The δ13C became more negative with the increasing of the year of issuance (r2 adj = 0.45, P < 0.01) and, although the carbon concentration of banknotes (%C) and δ15N had a direct significant correlation with year of issuance (P < 0.01), both r2 adj values were very low, 0.06 and 0.07, respectively.
We also found strong positive correlations between δ13C and %N (r2 adj = 0.57, P < 0.01) and δ13C and C:N ratios (r2 adj = 0.60, P < 0.01) of banknotes. Older banknotes had higher δ13C and %N, and lower C:N ratios than younger banknotes (Figure 3).
It is paramount to understand the causes of historic changes in Brazilian banknotes in order to use stable isotopes and elemental concentrations of carbon and nitrogen as a forensic tool in money counterfeiting analysis. It is relatively easy to explain the difference between banknotes made in the US or England with those made in Brazil, especially regarding the δ13C values, since on a broad regional scale, water availability is higher in most areas of Brazil than in these countries; therefore, higher δ13C values are expected in plants from England and US than from Brazil. There are several global meta-analyses that illustrate well such a trend [34, 35]. However, it is more complicated to explain the historic trends observed in banknotes made in the same country.
Banknotes are generally made with cotton. Exceptions to this rule are countries that use polymers to print banknotes, such as Canada and Australia, and countries that use different plant species, for example, Edgeworthia papyrifera and Musa textilis in Japan [36], or the US dollar banknote that is made of a mixture of cotton and linen. Brazil is one of the top five cotton producers in the world, and a main exporter of this commodity. Just as recently in the mid-1990s Brazilian cotton production was not enough to supply the national industry and the country had to import it, mainly from the US. Since the mid-1990s, the central region of Brazil has been responsible for 70% of cotton production in the country, but before then the Southeast and the Northeast regions played an important role in cotton production. In the last two decades, cotton has vanished from the Southeast of the country, but it is still important in the Northeastern region, responsible for one-quarter of Brazilian production (www. ibge.gov.br/sidra).
The sharp historic differences in %N, and especially in C:N ratios, suggest that geographic changes alone in areas of cotton production would not be enough to cause the historic changes observed here (Figure 2). To explain the increase in C:N ratio over time, without invoking a change in the raw material used to make banknotes, we infer that there was a gradual modification in paper production technology causing a modification over time. The same is true for %N, which decreased over time (Figure 2). The high correlations observed in Figure 3, suggest very synchronized variations between stable isotopes (δ13C), and elemental composition (%N and C:N ratio), which is not possible to explain with the information that we have available so far. The next step in the investigation of Brazilian banknotes, obviously, would be to analyze pure cotton paper in order to provide a detailed characterization of its elemental and isotopic composition. This study is currently being undertaken in our laboratory.
Even without completely understanding the historic changes observed here, such trends (Figure 2) and the synchronized changes observed in elemental and stable isotope parameters (Figure 3), can be readily used in money counterfeiting analysis, since a common practice is to use the paper of old banknotes (not legal tender anymore) to produce counterfeit ones.
![Figure 3: Bi-plots of: (A) δ13C vs. %N and (B) δ13C vs. C:N ratio of Brazilian banknotes. The color legend refers to the year the currency was issued [28].](/fulltextimages/9557/fig_3.png)
Issuance Year Denomination δ13Χ δ15Ν C N C:N Printer
1944 1 -23.9 3.2 43.64 1.2 36.49 ABNC
1951 1 -23.6 -1 40.57 1.54 26.28 ABNC
1954 10 -23.3 5.2 41.17 1.41 29.1 TLR
1954 2 -23.7 0.2 40.75 1.22 33.51 ABNC
1955 1 -23 2.4 40.67 1.38 29.55 ABNC
1955 2 -23.4 2.9 38.57 1.5 25.66 TLR
1955 1 -22.7 3 38.29 2.1 18.2 ABNC
1956 5 -23.5 3.8 39.97 1.91 20.93 TLR
1958 10 -23.7 3.7 37.97 1.75 21.64 TLR
1961 20 -24.1 2 39.88 1.77 22.54 ABNC
1962 20 -23.8 4.7 40.28 2.14 18.82 TLR
1962 5 -23.3 5.6 39.76 2.1 18.93 TLR
1962 20 -22.3 7 39.45 2.8 14.08 TLR
1966 100 -23.6 3.5 41.28 2.19 18.83 TLR
1966 50 -23.5 4.1 40.45 2.26 17.86 TLR
| 1966 | 100 | -23.7 | 3.7 | 39.85 | 2.16 | 18.42 | TLR |
|---|---|---|---|---|---|---|---|
| 1967 | 500 | -23.8 | 0.3 | 39.89 | 2.59 | 15.42 | ABNC |
| 1967 | 10 | -23.7 | 3.1 | 39.39 | 2.14 | 18.42 | TLR |
| 1967 | 10 | -23.7 | 3.6 | 39.32 | 1.91 | 20.56 | TLR |
| 1967 | 10 | -23.1 | 4.6 | 39.17 | 1.61 | 24.37 | TLR |
| 1967 | 10 | -23.1 | 3.6 | 40.01 | 2.26 | 17.67 | TLR |
| 1974 | 10 | -24.4 | 2.7 | 41.07 | 1.58 | 25.96 | CMB |
| 1974 | 100 | -24.3 | 4.3 | 41.59 | 1.47 | 28.29 | CMB |
| 1974 | 5 | -24.7 | 5.5 | 41.15 | 1.56 | 26.42 | CMB |
| 1979 | 5 | -25 | 7.1 | 41.11 | 1.32 | 31.13 | CMB |
| 1980 | 1 | -24.1 | 3.2 | 41 | 0.98 | 42.01 | CMB |
| 1980 | 1 | -23.5 | 3 | 40.4 | 1.86 | 21.72 | CMB |
| 1980 | 1 | -23.2 | 3.2 | 41.28 | 1.83 | 22.6 | CMB |
| 1980 | 1 | -23.5 | 2.8 | 40.26 | 1.86 | 21.66 | CMB |
| 1980 | 1 | -23.9 | 4.4 | 39.92 | 1.99 | 20.05 | CMB |
| 1980 | 1 | -23.9 | 3.7 | 40.51 | 2.1 | 19.33 | CMB |
| 1980 | 1 | -23.9 | 2.9 | 39.9 | 2.24 | 17.8 | CMB |
| 1980 | 1 | -24.1 | 3.5 | 39.82 | 2.26 | 17.62 | CMB |
| 1980 | 1 | -24 | 3.4 | 40.05 | 2.06 | 19.47 | CMB |
| 1980 | 1 | -24.1 | 3.1 | 40.19 | 2 | 20.12 | CMB |
| 1980 | 1 | -24.1 | 3.4 | 39.64 | 1.92 | 20.67 | CMB |
| 1980 | 10 | -23.9 | 3.8 | 39.47 | 1.83 | 21.61 | CMB |
| 1980 | 10 | -24 | 3.7 | 39.7 | 1.77 | 22.45 | CMB |
| 1980 | 10 | -23.7 | 4.1 | 41.07 | 1.48 | 27.79 | CMB |
| 1980 | 10 | -23.9 | 3.8 | 39.06 | 1.85 | 21.16 | CMB |
| 1981 | 100 | -24.6 | 5 | 40.77 | 1.21 | 33.76 | CMB |
| 1981 | 200 | -23.9 | 5.4 | 41.12 | 1.24 | 33.2 | CMB |
| 1981 | 1,000 | -24.1 | 3.8 | 41.12 | 1.1 | 37.24 | CMB |
| 1981 | 500 | -24 | 3.5 | 40.99 | 1.02 | 40.09 | CMB |
| 1984 | 10,000 | -24.7 | 5.8 | 42.85 | 1.04 | 41.21 | CMB |
| 1984 | 100 | -23.9 | 4.7 | 42.03 | 1.33 | 31.56 | CMB |
| 1984 | 100 | -23.9 | 3.8 | 37.77 | 0.98 | 38.63 | CMB |
| 1984 | 100 | -23.8 | 3.6 | 41.12 | 1.16 | 35.37 | CMB |
| 1984 | 100 | -23.8 | 4.1 | 41.11 | 1.15 | 35.72 | CMB |
| 1984 | 100 | -23.9 | 4.1 | 40.39 | 1.01 | 39.99 | CMB |
| 1984 | 200 | -24 | 3.3 | 39.94 | 0.97 | 41.34 | CMB |
| 1984 | 200 | -24.4 | 3.4 | 40.83 | 1.08 | 37.77 | CMB |
| 1984 | 200 | -24.4 | 3.2 | 40.74 | 1.1 | 36.92 | CMB |
| 1984 | 200 | -24.5 | 3 | 40.44 | 1.1 | 36.84 | CMB |
| 1984 | 5,000 | -24.6 | 4.6 | 41.3 | 1.24 | 33.19 | CMB |
| 1984 | 5,000 | -24.7 | 3.7 | 41.07 | 1.26 | 32.68 | CMB |
| 1984 | 5,000 | -24.8 | 3.3 | 41.44 | 1.2 | 34.49 | CMB |
| 1984 | 5,000 | -24.8 | 3.5 | 40.37 | 1.19 | 33.94 | CMB |
| 1984 | 10,000 | -24.1 | 4.5 | 41.04 | 1.18 | 34.81 | CMB |
| 1984 | 10,000 | -24.6 | 4.3 | 40.87 | 1.27 | 32.06 | CMB |
| 1984 | 10,000 | -24.5 | 4.7 | 42.54 | 1.25 | 33.97 | CMB |
| 1985 | 1,000 | -24.7 | 5.5 | 41.48 | 1.21 | 34.21 | CMB |
| 1985 | 1,00,000 | -24.3 | 5.8 | 41.39 | 1.15 | 35.86 | CMB |
| 1985 | 500 | -23.8 | 0.1 | 39.73 | 1.45 | 27.34 | CMB |
| 1985 | 1,00,000 | -23.9 | 4.9 | 41.42 | 1.21 | 34.14 | CMB |
| 1985 | 500 | -24.7 | 3.2 | 41.48 | 1.25 | 33.07 | CMB |
| 1985 | 500 | -24.2 | 3.6 | 41.56 | 1.3 | 32.02 | CMB |
| 1985 | 500 | -24.5 | 3.3 | 41.28 | 1.27 | 32.43 | CMB |
| 1985 | 1 | -24.1 | 4.7 | 41.82 | 1.15 | 36.24 | CMB |
| 1985 | 1,000 | -24.3 | 4.9 | 41.77 | 1.12 | 37.16 | CMB |
| 1985 | 50,000 | -23.7 | 7.2 | 41.14 | 1.74 | 23.7 | CMB |
| 1985 | 50,000 | -23.9 | 6.6 | 41 | 1.55 | 26.44 | CMB |
| 1985 | 100 | -24 | 5.5 | 41.67 | 1.49 | 27.97 | CMB |
| 1986 | 50,000 | -24.6 | 4.3 | 41.21 | 1.29 | 32.04 | CMB |
| 1986 | 50 | -24.1 | 5.1 | 42.11 | 1.18 | 35.56 | CMB |
| 1986 | 1,000 | -24.3 | 5.5 | 41.83 | 1.15 | 36.24 | CMB |
| 1986 | 1,000 | -24.7 | 5.1 | 41.73 | 1.16 | 35.96 | CMB |
| 1986 | 10,000 | -24.8 | 5.1 | 41.7 | 1.24 | 33.63 | CMB |
| 1986 | 10,000 | -24.3 | 4.4 | 41.45 | 1.13 | 36.63 | CMB |
| 1986 | 50,000 | -23.9 | 6.6 | 40.65 | 1.8 | 22.53 | CMB |
| 1986 | 1,00,000 | -24.2 | 6.1 | 38.48 | 1.56 | 24.73 | CMB |
| 1986 | 1,00,000 | -24.3 | 4.6 | 39.6 | 1.34 | 29.46 | CMB |
| 1986 | 1,00,000 | -24.1 | 6.4 | 40.14 | 1.28 | 31.24 | CMB |
| 1986 | 1,00,000 | -24 | 5.9 | 40.5 | 1.26 | 32.19 | CMB |
| 1986 | 10 | -24 | 5.6 | 40.49 | 1.21 | 33.47 | CMB |
| 1986 | 10 | -24.2 | 6.4 | 40.86 | 1.31 | 31.08 | CMB |
| 1986 | 10 | -24.2 | 5.6 | 41.09 | 1.21 | 33.83 | CMB |
| 1986 | 10 | -24.2 | 4.9 | 40.3 | 1.29 | 31.16 | CMB |
| 1986 | 10 | -24.2 | 5.2 | 40.07 | 1.25 | 32.07 | CMB |
| 1986 | 50 | -24.1 | 4.6 | 41.69 | 1.14 | 36.43 | CMB |
| 1986 | 50 | -24.3 | 6 | 41.39 | 1.1 | 37.54 | CMB |
| 1987 | 1,00,000 | -24.7 | 6.3 | 40.57 | 1.09 | 37.25 | CMB |
| 1987 | 1,000 | -24.8 | 4.7 | 42.61 | 0.94 | 45.45 | CMB |
| 1987 | 50 | -24.1 | 4.8 | 40.34 | 1.17 | 34.37 | CMB |
| 1987 | 100 | -24.7 | 6.2 | 41.24 | 1.14 | 36.28 | CMB |
| 1987 | 50 | -24 | 5 | 39.68 | 1.11 | 35.81 | CMB |
| 1987 | 50 | -24.2 | 4.6 | 41.15 | 1.13 | 36.54 | CMB |
| 1987 | 100 | -24.6 | 5.9 | 41.15 | 1.04 | 39.43 | CMB |
| 1987 | 100 | -24.4 | 6.1 | 40.71 | 1.06 | 38.24 | CMB |
| 1987 | 100 | -24.3 | 5.3 | 41.76 | 1.09 | 38.25 | CMB |
| 1987 | 100 | -24.6 | 6.2 | 41.75 | 1.01 | 41.2 | CMB |
| 1987 | 500 | -25.1 | 5.3 | 41.52 | 1.02 | 40.7 | CMB |
| 1987 | 500 | -24.9 | 5.7 | 41.98 | 1.03 | 40.8 | CMB |
| 1988 | 500 | -25.1 | 5.7 | 40.6 | 1.14 | 35.55 | CMB |
| 1988 | 500 | -24.9 | 5.4 | 41.72 | 1.01 | 41.11 | CMB |
| 1988 | 1,000 | -24.7 | 7.3 | 41.41 | 1.1 | 37.8 | CMB |
| 1988 | 500 | -25.1 | 5.5 | 39.19 | 0.99 | 39.42 | CMB |
| 1988 | 1,000 | -24.8 | 3.1 | 41.26 | 0.83 | 49.47 | CMB |
| 1988 | 1,000 | -24.7 | 3.6 | 37.6 | 0.72 | 52.06 | CMB |
| 1989 | 200 | -25.2 | 3.7 | 41.73 | 0.8 | 52.24 | CMB |
| 1989 | 1,000 | -24.8 | 2.4 | 41 | 0.78 | 52.42 | CMB |
| 1989 | 5,000 | -24.6 | -3.2 | 42.12 | 1.54 | 27.29 | CMB |
| 1989 | 10,000 | -24.8 | 2 | 41.88 | 0.86 | 48.79 | CMB |
| 1989 | 50 | -24.6 | 3.9 | 41.32 | 0.9 | 45.71 | CMB |
| 1989 | 1,000 | -24.5 | 3.8 | 42 | 0.76 | 55.23 | CMB |
| 1989 | 1 | -25 | 2.3 | 42.29 | 0.86 | 49.28 | CMB |
| 1989 | 1 | -24.7 | 3.2 | 40.78 | 0.73 | 55.6 | CMB |
| 1989 | 5,000 | -25.1 | 2.2 | 38.17 | 0.78 | 49.07 | CMB |
| 1989 | 5,000 | -25.3 | 2.7 | 40.53 | 0.8 | 50.63 | CMB |
| 1989 | 5,000 | -25.3 | 2.5 | 41.03 | 0.82 | 49.79 | CMB |
| 1989 | 1,00,000 | -25.7 | 3.4 | 40.5 | 0.83 | 48.64 | CMB |
| 1989 | 1,00,000 | -25.2 | 2.3 | 40.98 | 0.78 | 52.35 | CMB |
| 1989 | 1,00,000 | -25.1 | 3.1 | 34.85 | 0.67 | 52.35 | CMB |
| 1989 | 1,00,000 | -25.2 | 2.9 | 40.97 | 0.76 | 53.59 | CMB |
| 1989 | 1,00,000 | -25.2 | 2.7 | 40.2 | 0.84 | 47.94 | CMB |
| 1989 | 1,00,000 | -25.1 | 2.8 | 40.88 | 0.88 | 46.68 | CMB |
| 1989 | 100 | -25 | 3.3 | 40.46 | 0.86 | 47.06 | CMB |
| 1990 | 100 | -25.5 | 4.8 | 40.89 | 0.73 | 56.25 | CMB |
| 1990 | 500 | -24.7 | 2.8 | 40.51 | 0.93 | 43.6 | CMB |
| 1990 | 1,000 | -25.1 | 4.2 | 42.13 | 0.96 | 43.76 | CMB |
| 1990 | 5,000 | -25.1 | 4 | 41.28 | 0.8 | 51.84 | CMB |
| 1990 | 5,000 | -25.2 | 3.7 | 42.33 | 1.01 | 41.79 | CMB |
| 1990 | 50 | -24.9 | 4 | 41.73 | 0.78 | 53.57 | CMB |
| 1990 | 500 | -25.2 | 3.6 | 42.17 | 0.95 | 44.55 | CMB |
| 1990 | 200 | -24.8 | 2.3 | 41.66 | 0.78 | 53.71 | CMB |
| 1990 | 100 | -24.6 | 3.8 | 40.55 | 0.91 | 44.76 | CMB |
| 1990 | 1,000 | -24.7 | 2.4 | 41.86 | 0.86 | 48.88 | CMB |
| 1990 | 5,000 | -25 | 3.2 | 39.79 | 0.85 | 47 | CMB |
| 1990 | 100 | -25.1 | 2.6 | 40.69 | 0.85 | 47.7 | CMB |
| 1990 | 100 | -25 | 3.8 | 40.83 | 0.79 | 51.5 | CMB |
| 1990 | 200 | -24.9 | 4.7 | 40.93 | 0.95 | 43 | CMB |
| 1990 | 200 | -24.8 | 3.7 | 41.56 | 1 | 41.62 | CMB |
| 1990 | 200 | -24.9 | 3.1 | 39.98 | 0.76 | 52.33 | CMB |
| 1990 | 200 | -24.7 | 4.1 | 40.85 | 0.96 | 42.44 | CMB |
| 1990 | 200 | -25 | 3.9 | 41.77 | 0.9 | 46.54 | CMB |
| 1990 | 1,000 | -25 | 5.6 | 40.24 | 1.1 | 36.47 | CMB |
| 1990 | 1,000 | -25.1 | 5.1 | 40.77 | 1.03 | 39.66 | CMB |
| 1990 | 1,000 | -24.4 | 5.8 | 39.68 | 1.24 | 31.89 | CMB |
| 1990 | 5,000 | -24.4 | 5.5 | 39.15 | 1.18 | 33.23 | CMB |
| 1990 | 5,000 | -25 | 4.6 | 40.73 | 1.22 | 33.41 | CMB |
| 1990 | 50 | -25.2 | 4 | 41.19 | 0.82 | 50.38 | CMB |
| 1990 | 50 | -25.2 | 2.5 | 37.8 | 0.7 | 54.28 | CMB |
| 1990 | 50 | -25.1 | 2.6 | 42.13 | 0.77 | 54.53 | CMB |
| 1990 | 50 | -25.3 | 3.6 | 41.73 | 0.79 | 53.08 | CMB |
| 1990 | 100 | -25.4 | 3.5 | 42 | 0.9 | 46.43 | CMB |
| 1990 | 500 | -25.2 | 4 | 42.21 | 1.01 | 41.88 | CMB |
| 1990 | 500 | -25.2 | 4.6 | 40.22 | 0.96 | 42.09 | CMB |
| 1990 | 500 | -25 | 4.5 | 40.74 | 1.11 | 36.56 | CMB |
| 1990 | 500 | -25.1 | 4.2 | 40.55 | 0.85 | 47.97 | CMB |
| 1991 | 10,000 | -24.9 | 3.8 | 42.05 | 0.89 | 47.24 | CMB |
| 1991 | 1,000 | -24.4 | 6.7 | 39.51 | 1.31 | 30.2 | CMB |
| 1991 | 1,000 | -24.7 | 5.5 | 38.88 | 1.35 | 28.89 | CMB |
| 1991 | 10,000 | -24.7 | 5.7 | 42.09 | 1.48 | 28.41 | CMB |
| 1992 | 10,000 | -24.8 | 5.1 | 40.27 | 0.97 | 41.64 | CMB |
| 1992 | 50,000 | -23.8 | 5.6 | 40.13 | 1.04 | 38.66 | CMB |
| 1992 | 10,000 | -23.9 | 6.7 | 40.26 | 1.55 | 26.01 | CMB |
| 1992 | 10,000 | -24.8 | 5.1 | 41.9 | 1.01 | 41.43 | CMB |
| 1992 | 50,000 | -24.1 | 6.1 | 41.31 | 1.55 | 26.65 | CMB |
| 1992 | 50 | -24.3 | 6.4 | 40.75 | 1.3 | 31.42 | CMB |
| 1992 | 50,000 | -23.9 | 6.9 | 42 | 1.51 | 27.83 | CMB |
| 1992 | 50,000 | -23.9 | 6.9 | 41.05 | 1.49 | 27.59 | CMB |
| 1992 | 1,00,000 | -24.1 | 5.9 | 40.57 | 1.34 | 30.22 | CMB |
| 1992 | 1,00,000 | -24 | 6.4 | 40.4 | 1.24 | 32.55 | CMB |
| 1993 | 5,00,000 | -24.2 | 4.7 | 41.38 | 1.29 | 32.09 | CMB |
| 1993 | 5,000 | -25 | 6.7 | 39.97 | 1.03 | 38.93 | CMB |
| 1993 | 5,000 | -24.6 | 6.7 | 41.24 | 1.21 | 34.16 | CMB |
| 2013 | 2 | -25.3 | 5.3 | 45.66 | 0.75 | 60.57 | CMB |
Conclusion
Even though the origin of the raw materials used to produce Brazilian money paper are not officially disclosed, our results showed a trend in the carbon and nitrogen stable isotopic ratio and also in the C:N ratio, which may be used in forensic analysis in order to predict not only if a banknote is forged, but also the geographic origin where
References
-
Central Bank of Brazil (2004) Dinheiro no Brasil.
-
The Royal Mint. The new 12-sided £1 coin.
-
Bank of Canada. Statistics pertaining to counterfeit Canadian bank notes (formerly B4).
-
Central Bank of Brazil. Estatística de Falsificação.
-
European Central Bank (2010) Quick guide to the security features of euro banknotes.
-
U.S. Department of Treasury. U.S. Currency: How money is made - paper and ink.
-
Central Bank of Brazil. Segunda família do real cartilha de treinamento.
-
Central Bank of Brazil (2018) O brasileiro e sua relação com o dinheiro.
-
Service CR (2009) North Korean Counterfeiting of U.S. Currency.
-
Heij HD (2010) DNB Occasional Studies: Banknote design for retailers and public. De Nederlandshhe Bank 8(4): 1-245.
-
Battilossi S, Cassis Y, Yago K (2020) Handbook of the History of Money and Currency. pp: 1-14.
-
Lehmann, Luiz EMAZA (2019) Minimalist strategies applied to analysis of forensic samples using elemental and molecular analytical techniques - A review. Anal Chim Acta 1063: 9-17.
-
Cerling TE, Barnette JE, Bowen GJ, Chesson LA, Ehleringer JR, et al. (2016) Forensic Stable Isotope Biogeochemistry. Annual Review of Earth and Planetary Sciences 44: 175- 206.
-
West JB, Bowen GJ, Dawson TE, Tu KP (2010) Isoscapes - Understanding movement, pattern, and process on Earth through isotope mapping.
-
Jones K, BensonS, Roux C (2013) The forensic analysis of office paper using carbon isotope ratio mass the cellulose used in its support composition came from. This technique could be particularly useful in dealing with high-quality forgery issues, as in the case of superdollars, in which actual banknote printers are seemingly employed and classical forensic methods, such as security features and printing process analysis, may be inadequate in identifying counterfeited money.c spectrometry – Part 1 : Understanding the background population and homogeneity of paper for the comparison and discrimination of samples. Forensic Sci Int 23(1-3): 354-363.
-
Jones K, Benson S, Roux C (2013) The forensic analysis of office paper using carbon isotope ratio mass spectrometry — Part 2 : Method development, validation and sample handling. Forensic Sci Int 231(1-3): 364-374.
-
Jones K, Benson S, Roux C (2013) The forensic analysis of office paper using carbon isotope ratio mass spectrometry. Part 3 : Characterizing the source materials and the effect of production and usage on the δ13C values of paper. Forensic Sci Int 233(1-3): 355-364.
-
Van EA, Koeijer JD, Van DPG (2009) Discrimination of document paper by XRF , LA – ICP – MS and IRMS using multivariate statistical techniques. Sci Justice 49(2) : 120-126.
-
Daéid NN, Augenstein WM, Kemp HF (2011) Investigating the provenance of un ‐ dyed spun cotton fibre using multi‐isotope profiles and chemometric analysis. Rapid Communications in Mass Spectrometry pp: 1812-1816.
-
Mallette JR, Casale JF, Jordan J, Morello DR, Beyer PM (2016) Geographically Sourcing Cocaine’s Origin – Delineation of the Nineteen Major Coca Growing Regions in South America. Nature.
-
Muccio Z, Jackson GP (2011) Simultaneous Identification and d 13 C Classification of Drugs Using GC with Concurrent Single Quadrupole and Isotope Ratio Mass Spectrometers. J Forensic Sci 56(S): 203-209.
-
Galimov EM, Sevastyanov VS, Kulbachevskaya EV, Golyavin AA (2005) Isotope ratio mass spectrometry : d 13 C and d 15 N analysis for tracing the origin of illicit drugs. 1213-1216. Rapid Communications in Mass Spectrometry 19(10): 1213-1216.
-
Hurley JM, West JB, Ehleringer JR (2010) Stable isotope models to predict geographic origin and cultivation conditions of marijuana. Sci Justice 50(2): 86-93.
-
Shibuya EK, Souza JE, Negrini O, Moreira MZ, Victoria RL (2006) Sourcing Brazilian marijuana by applying IRMS analysis to seized samples. Forensic Science International 160: 35-43.
-
Shibuya EK, Sarkis JES, Negrini-Netoc O, Omettod JPHB (2007) Multivariate Classification Based on Chemical and Stable Isotopic Profiles in Sourcing the Origin of Marijuana Samples Seized in Brazil. J Braz Chem Soc 18(1): 205-214.
-
Tipple BJ, Hambach B, Baenette JE, Chesson LA, Ehleringer JR (2016) The influences of cultivation setting on inflorescence lipid distributions, concentrations, and carbon isotope ratios of Cannabis sp. Forensic Sci Int 262: 233-241.
-
Craig H (1953) The geochemistry of the stable carbon isotopes. Geochimica et Cosmochimica Acta 3(2-3): 53- 92.
-
Amato C, Irlei S, Neves JES (2019) Cédulas do Brasil (1833 a 2019).
-
Silva VD (2004) 15N Natural abundance in woody plants and soils of central Brazilian savannas (cerrado). Ecol pp: 200-213.
-
Högberg P (1997) Tansley Review No. 95 15N natural abundance in soil-plant systems. New Phytol. 137(2): 179-203.
-
Craine J, Elmore AJ, Aidar MPM, Bustamante M, Dawson TE, et al. (2009) Global patterns of foliar nitrogen isotopes and their relationships with climate, mycorrhizal fungi. New Phytol 183(4): 980-992.
-
Farquhar GD, Ehleringer JR, Hubick KT (1989) Carbon Isotope Discrimination and Photosynthesis. Annu Rev Plant Physiol Plant Mol Biol 40: 503-537.
-
Saranga Y, Jiang C, Wright RJ, Yakir D, Paterson AH (2004) Genetic dissection of cotton physiological responses to arid conditions and their inter-relationships with productivity. Plant, Cell & Enviornment 27(3): 263-277.
-
Diefendorf AF, Mueller KE, Wing SL, Koch PL, Freeman KH (2010) Global patterns in leaf 13 C discrimination and implications for studies of past and future climate. Proc Natl Acad Sci USA 107(13): 5738-5743.
-
Kohn MJ (2010) Carbon isotope compositions of terrestrial C3 plants as indicators of (paleo) ecology and (paleo) climate. PNAS 107(46): 19691-19695.
-
National Printing Bureau. Characteristics of Banknotees.
- Forensic Implications of Adverse Drug Reactions in Schizophrenia A Case Series
- Narcotics and Digital Forensics: Bridging Crimes in the Digital Age
- Ethics in Forensic Psychiatry: Principles, Dilemmas, and Human Rights
- Impact of Acute Stress on Attentional Orienting to Social Cues
- Head Injury and Intracranial Hemorrhage in Western Region of Libya
- A Forensic Study on Handedness: Examination of Handwriting Features in Right and Left Handed Writers