Sexual Dimorphism from Femoral Bone Dimensions Parameters among African Tribes and South Africans of European Descent
Background: The skeletal dimensions remain an important to identify the victim in cases of disastars where key identification points of the body is lost. Sex determination is the first step in identifying a body.The main objective of this paper was to generate race-specific femoral database and to determine sexual demorphism of femur in South Africans ethnic groups and South Africans of Europeon decent. Six standard femoral variables were used; bone length, maximum head diameter, bicondylar breadth, head-neck length, lateral and medial condylar length. Ten South African ethnic groups (Zulu, Tswana, Swazi, Sotho, Xhosa, Dart Peti, Shan, Dart Shan, Ndebele and Venda) were considered as the independent variable and South Africans of European Descent. A total of 235 male femura and 160 female femora were obtained from Dart's Collection at Witwatersrand University. Results: Male dimensions were significantly larger than females dimensions in all the ethnic groups (p 0.001) except Shan and Dart Shan. Strong correlation was observed between head diameter and bone length. Conclusions: This study developed a database for sexual demorphism in femura among 10 South African ethnic groups and SAED. Results showing male dimensions larger than females. This is the first such study elaborating the race-specific sexual demorphism in South African ethnic groups.
Najam Siddiqi1* and Mark Norrish2
and Technology, College of Medicine and Health Sciences, Oman
UK
najam@omc.edu.om Dart's Collection at Witwatersrand University.
Shan and Dart Shan. Strong correlation was observed between head diameter and bone length.
sexual demorphism in South African ethnic groups.
European Descent
Abbreviations: CT: Computed Tomography ; ISA: Indigenous South Africans; SAED: South African of Europeans Descend; BL: Femoral Bone Length; HD: Femoral Head Diameter; Wdf: Femoral Condyle Width; HNL: Head-neck length; LCL, MCL: Medial and Lateral condyle.
Background
Forensic anthropologists and skeletal biologists have a strenuous task in identifying the deceased from the skeletal remains in natural or man-made disasters where corpses are highly decomposed and mutilated beyond recognition [1]. An open disaster is a major catastrophic event resulting in death of a number of unknown individuals in whom no prior records or descriptive data are available. Bones being rigid resist decomposition and this part of the fragmented skeletal, remains available for identification of the body. The femur is the strongest bone in the body which resists fragmentation and hence can be used for sex estimation and ancestry. Forensic identification is done by identifying the group and individualistic traits. Group traits including age, sex, stature and ancestry serve as important clues to identify individual traits. Sex remains the foremost step for developing a reliable biological profile in human identification from the skeletal remains [1, 2, 3, 4, 5, 6, 7, 8]. The reliability and accuracy of sex prediction is highest for the skull, pelvic bone and long bones followed by other parts of the skeleton. Long bones are the most actively studied bones for sex estimation [1]. Bones studied for sexual dimorphism include the skull, femur, tibia, humerus, patella, pelvis, talus, calcaneus, metatarsal bone, ribs, sternum, cervical vertebra, clavicle [9, 10, 11, 12, 13, 14, 15, 16, 17, 18, 19, 20, 21, 22, 23, 24, 25, 26, 27, 28, 29, 30]. Sex estimation methods are classified as non-metric (morphologic) and metric [1]. Metric methods are size- based and population-specific while geometric morphometrics involve shape, are less or not at all population-specific. Methods include direct measurements on the bone using a caliper or from scanned images such as CT scans. Recently postmortem computed tomography (CT) of skull was used for identification of age and sex at death [31, 32, 33, 34]. Molecular methods such as DNA analysis are used to determine the individual biological traits [35]. These methods though more reliable, are complicated, highly expensive, time consuming and not available in all remote areas [1]. The South African population is very diverse and a mixture of whites (SAED), blacks African ethnic groups and brown (Indian descent) living side by side, who constitute an entirely different population. It is therefore essential that standards for skeletal identification in different South African populations should be established. With the high incidence of crime in South Africa, it is a difficult task to identify the unidentified bodies and their ancestry; South Africa is a country where many ethnic groups still living in villages, preserving their own identity and cultural traditions and avoid mixing with other ethnic groups. It is well understood that standards for skeletal identification vary among different populations and ancestry, and standards for one population might not fit into the standards of other populations [8, 13, 15, 20, 21, 30, 36, 37]. Many authors have reported sex determination from different bones however, sexual dimorphism in different ethnic groups in South Africa has still not been identified [9]. Previous studies conducted in South Africa have collected bones constituting of different African ethnic groups and taken their means for different statistical analysis, assuming that there is no significant difference among these groups. Cutland published studies on African population, however, the bones consituted only Zulu tribe [38]. Although studies had shown significant differences in variables among Zulu and Sotho tribes, however, in another study, data generated from Zulu, Sotho and Xosa tribes were combined to represent the black population [9]. Macho studied Zulu, Sotho, Xosa and found similarities only between Zulu and SAED [39, 40]. In a previous study, the author found no significant difference between the FBL of Zulu and SAED, but significant differences were observed in FBL, FHD and BCB among SAED and other ethnic tribes [41]. In a study on sexual dimorphism of femoral head in South African population, Asala et al. collected 260 femora, but grouped them all together as South Africans and compared the specimens with South Africans whites [10]. In another stduy, Bidmos et al. grouped different South African ethnic groups into one as ‘Indigenous South Africans’ (ISA) [42]. Although the researchers recognized that ethnic groups have different dimensions, which had already been stated by Asala et al -- “it is necessary to determine race-specific standards of parameters” [9, 10]. Osteometric data on long bones in South African ethnic groups is still deficient. It is therefore important to develop a database for bone dimensions for each ethnic group seperately, which may be used later to confirm the ancestry of the victim. In this study, the author has developed a database for femoral measurements in ten South African ethnic groups. Details of these ethnics groups were already published [41]. This data will be very useful for forensic anthropologists in medico-legal cases to identify not only the gender but also the ethnic groups as these bone dimensions are race specific. Objectives: The aim of this study was to determine race- specific sexual dimorphism of femur in 10 African ethnic groups and South African of Europeans Descend (SAED) by using the data obtained by measuring 6 parameters on 395 femura obtained from Dart’s Collection at Witwaterand University.
Methods
The skeletal remains used in this study were obtained from Raymond A. Dart Collection of Human skeletons housed in the School of Anatomical Sciences, University of Witwatersrand, Johannesburg, South Africa, after approval from the department and the ethical committee. A total of 259 femura from males and 160 from females in ten different African ethnic groups and Africans of European descent (SAED) were selected. The Dart collection records have gender and ethnic origin identification for each skeleton [43, 44]. The inclusion criteria included femora from skeletally-mature adults (age range from 29 to 65 years, however, this is just an approximation, as the exact age was not known at that time with certainity) [39, 40]. Exclusion criteria included bones with visible degradation, broken parts, deformities, previous fractures, and other anomalies. The sample consisted of Nguni language speaking Zulu (25 males, 25 females), Xhosa (24 males, 25 females), Swazi (25 males, 13 femailes), Ndebele (33 males, 6 females), Tswana speaking Banto language (24 males, 25 females), Sestho speaking Sotho (25 males, 25 females), Shan speaking Khoisan language (25 males, 5 females), Venda (24 males, 5 females), Dart Pedi living in the North close to Kruger national park who speaks the Pedi language (15 males, 4 females), Dart Shan ( 15 males, 3 females). Twenty-four male and 24 female were selected from SAED. Parameters measured were previously established and recommended by Martin and Saller [45]. These parameters were choosen because many authors already reported their data using these measurements for femur and found them to be reliable parameters, easily measureable with almost negligible intra-observer and inter-observer variability [46]. A total of 6 femoral measurements were measured as follows:
1. Maximum femural length (BL): the linear distance between the most superior part of head of femur and the most inferior part of the medial condyle.
2. Head diameter (FHD): maximum diameter of the femoral head.
3. Head neck length (HNL): Maximum length from the tip of the head to the heighest point of the greater trochanter.
4. Bicondylar width (BCB): the linear distance between the medial border of the medial condyle and the lateral border of the lateral condyle.
5. Lateral condylar length (LCL): maximum anterioposterior length of the lateral condyle.
6. Medial condylar length (MCL): maximum anterioposterior length of the medial condyle. The maximum length of the femur was measured on an osteometric board accurate to the nearest 1 mm while the rest of the parameters were measurements directly located on the bone by using a TA electronic digital vernier caliper (Global selective Equipment cc, JHB, South Africa) accurate to 0.01 mm. All the measurements were repeated three times to minimize any chances of error. The measurements were reproducible and consistent with an error of 0.05 mm. A statistical analysis was carried out using SPSS. One- way ANOVAs were used to calculate between-group differences. Post hoc Duncan tests were used to find differences between individual ethnic groups. Parrson’s correlations were used to determine the relationship between the six dependable variables; FBL, FHD, HNL, BCB, MCL and MCL.
Results
The data for all six dependent variables with mean and standard deviations for each of the ten ethnic groups and SAED for both genders is shown in tables 1 & 2.
| Tribes | BL | HD | Wdf | MCL | LCL | HNL | ||||||
| Mean | SD | Mean | SD | mean | SD | mean | SD | Mean | SD | mean | SD | |
| Zulu (n=25) | 462.6 | 22.67 | 45.28 | 2.33 | 74.33 | 5.08 | 63.26 | 3.98 | 64.26 | 3.67 | 93.11 | 5.65 |
| Tsuwana (n=24) | 447.37 | 19.24 | 44.58 | 2.21 | 73.06 | 4.07 | 61.02 | 3.85 | 62.65 | 3.26 | 92.62 | 5.32 |
| Swazi (n=25) | 450.12 | 20.03 | 42.23 | 2.66 | 71.51 | 3.99 | 59.78 | 3.42 | 61.06 | 3 | 89.81 | 5.24 |
| Sotho (n=25) | 455.44 | 22.63 | 43.27 | 2.36 | 70.58 | 4.58 | 59.91 | 3.45 | 62.01 | 3.82 | 91.71 | 5.23 |
| Xhosa (n=25) | 453.79 | 22.56 | 44.34 | 2.7 | 65.94 | 3.76 | 61.74 | 3.06 | 62.99 | 3.32 | 92.35 | 4.75 |
| Dart Padi (n=15) | 453.6 | 25.62 | 44.61 | 3.26 | 72.39 | 5.22 | 61.58 | 3.85 | 64.01 | 3.43 | 92.12 | 11.37 |
| Shan (n=25) | 458 | 26.18 | 44.58 | 2.92 | 70.8 | 3.38 | 60.72 | 3.73 | 62.29 | 3.77 | 91.9 | 6.27 |
| Dart Shan(n=15) | 457.93 | 24.66 | 44.41 | 2.83 | 71 | 3.41 | 61.19 | 3.09 | 62.75 | 4.54 | 94.45 | 5.29 |
| Venda (n=24) | 456.87 | 29.88 | 44.75 | 2.58 | 72.5 | 4.1 | 62.71 | 3.9 | 63.69 | 4.51 | 91.61 | 5.2 |
| Ndebele (n=33) | 461.69 | 26.51 | 45.67 | 3.07 | 73.3 | 4.71 | 62.13 | 3.99 | 64.02 | 3.96 | 92.81 | 5.73 |
| SAED (n=24) | 475.62 | 25.85 | 47.53 | 2.59 | 77.27 | 4.05 | 64.53 | 3.71 | 65.96 | 3.87 | 101.85 | 6.34 |
| F-ratio | 2.318 | 6.465 | 4.972 | 3.737 | 3.047 | 6.354 | ||||||
| P value | 0.013 | 0 | 0 | 0.001 | 0.001 | 0 |
Table 1: Mean, standard deviations and univariate F-ratio for femur in MALE (mm).
| Tribes | BL | HD | Wdf | MCL | LCL | HNL | ||||||
| Mean | SD | Mean | SD | mean | SD | mean | SD | Mean | SD | mean | SD | |
| Zulu (n=25) | 424.96 | 22.29 | 40.57 | 2.02 | 66.39 | 4.47 | 57.44 | 2.87 | 59.23 | 2.75 | 82.03 | 4.14 |
| Tsuwana (n=25) | 427.68 | 18.63 | 39.85 | 2.23 | 64.9 | 3.16 | 56.71 | 2.74 | 58.74 | 3.72 | 82.76 | 4.35 |
| Swazi (n=13) | 433.38 | 24.59 | 41.33 | 3.04 | 67.68 | 5.01 | 59.79 | 5.25 | 62.11 | 4.91 | 87.2 | 5.67 |
| Sotho (n=25) | 434.44 | 24.75 | 38.06 | 3 | 63.52 | 4.93 | 55.57 | 3.49 | 57.71 | 4.1 | 82.58 | 5.91 |
| Xhosa (n=24) | 426.76 | 22.71 | 40.78 | 1.78 | 65.94 | 3.76 | 58.06 | 3.5 | 59.95 | 3.79 | 85.47 | 3.51 |
| Dart Padi (n=4) | 418.5 | 33.15 | 40.49 | 2.98 | 62.68 | 2.5 | 57.08 | 2.47 | 58.45 | 3.25 | 81.93 | 7.38 |
| Shan (n=5) | 454 | 9.46 | 43.36 | 2.53 | 72.03 | 4.09 | 61.53 | 2.32 | 62.77 | 2.88 | 89.69 | 3.11 |
| Dart Shan (n=3) | 451.66 | 12.74 | 42.32 | 3.37 | 70.29 | 4.57 | 61.11 | 1.32 | 61.84 | 3.69 | 89.47 | 4.17 |
| Venda (n=5) | 419 | 21.2 | 40.42 | 2.02 | 64.24 | 2.08 | 56.79 | 2.54 | 56.49 | 2.47 | 84.18 | 3.06 |
| Ndebele (n=6) | 427 | 15.78 | 39.77 | 2.83 | 64.35 | 1.82 | 54.55 | 2.63 | 59.94 | 3.06 | 85.18 | 3.7 |
| SAED (n=25) | 430.8 | 20.2 | 42.26 | 2.4 | 67.98 | 4.06 | 58.94 | 2.93 | 60.1 | 3.33 | 89.28 | 5.05 |
| F ratio | 1.5 | 4.55 | 3.8 | 3.84 | 2.41 | 5.49 | ||||||
| P valve | 0.143 | 0 | 0 | 0 | 0.011 | 0 |
Table 2: Mean, standard deviations and univariate F-ratio for femur in FEMALE (mm).
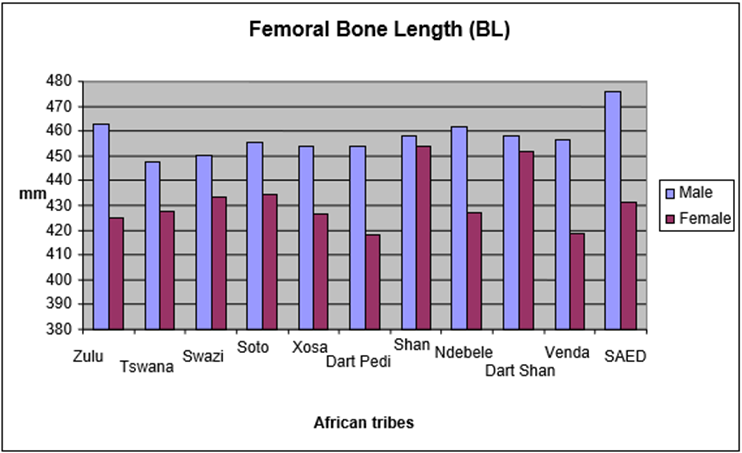
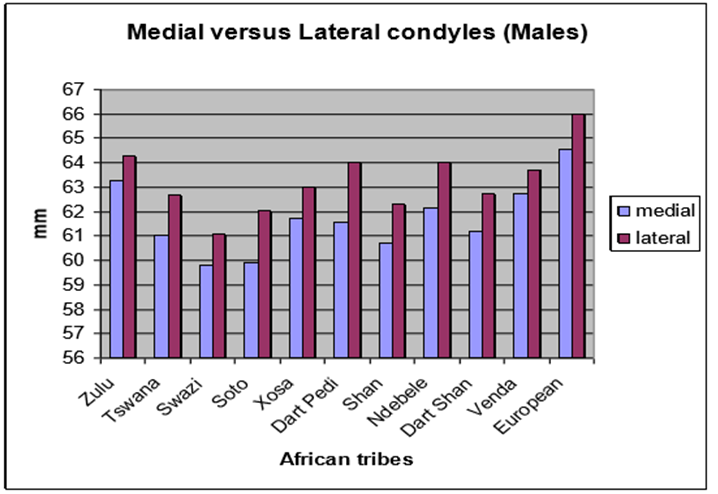
Table 2: Mean, standard deviations and univariate F-ratio for femur in FEMALE (mm). Femoral bone length (BL) : Males dimensions were significantly larger than females dimensions. Swazi and Venda (p< 0.05), Sotho and Dart Pedi (p< 0.01), Zulu, Tsuwana, Xosa, Ndebele and SAED (p< 0.001), no significant difference was observed for Shan and Dart Shan (Figure 1).
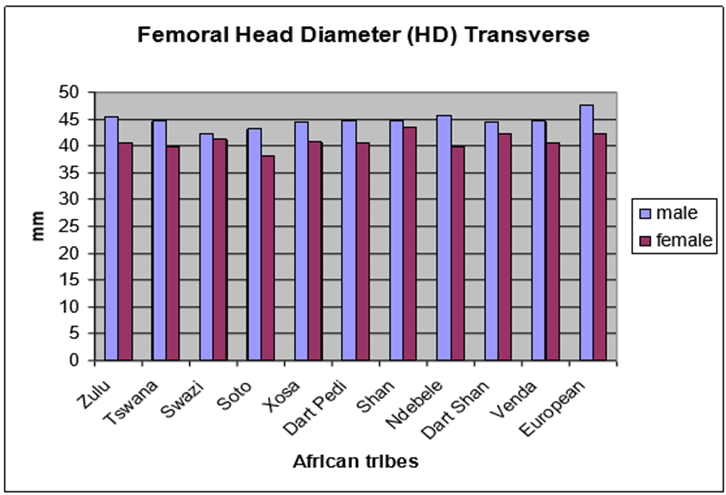
SAED (p< 0.001), no significant difference was observed for Shan, Dart Shan and Swazi (Figure 2).
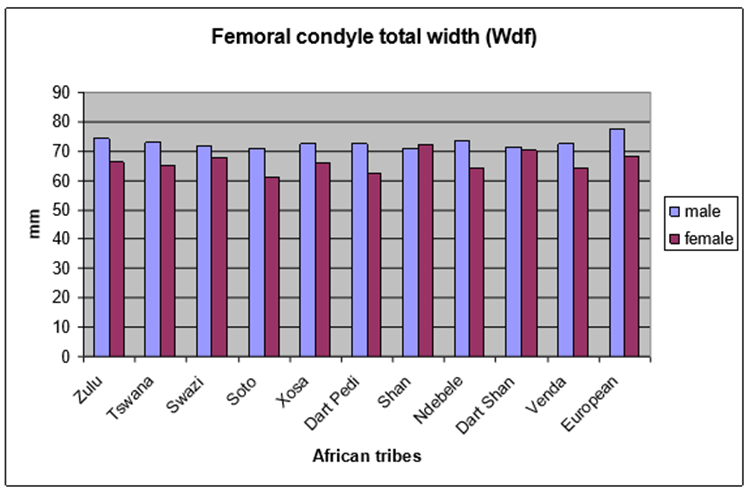
Femoral condyle width (Wdf): Males dimensions were significantly larger than females dimensions. Swazi (p< 0.05), Zulu, Tsuwana, Xosa, Ndebele Sotho, Venda and SAED (p< 0.001), no significant difference was observed for Shan, Dart Shan (Figure 3).
0.001), no significant difference was observed for Shan, Dart Shan and Swazi (Figure 4).
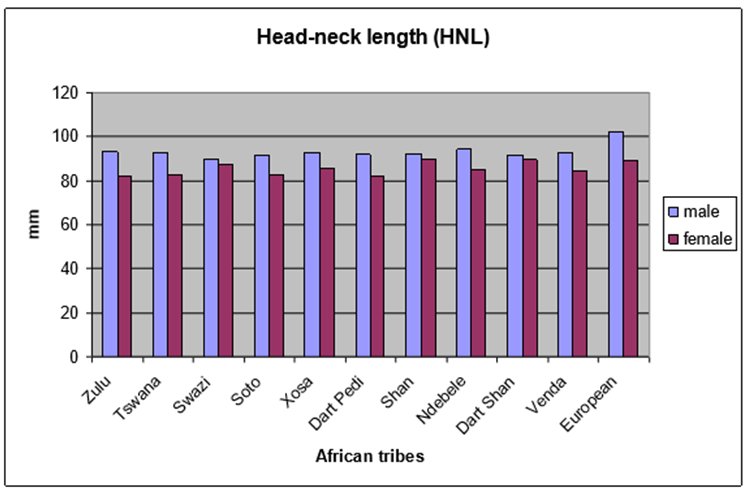
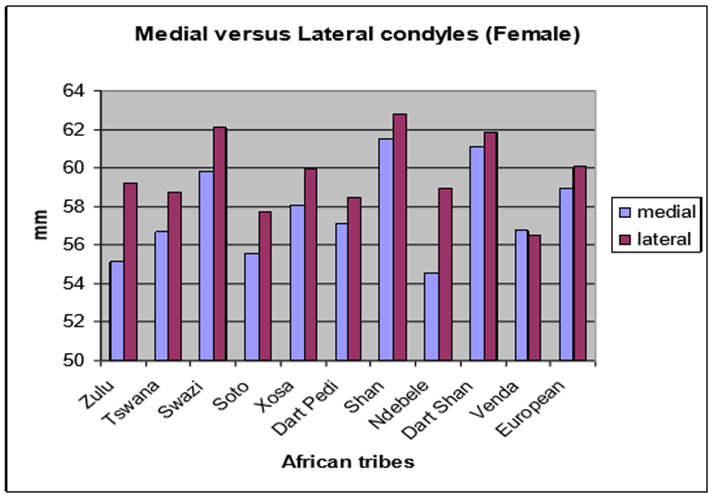
Figure 4: Head-neck length (HNL):Sexual dimorphism was significant in all the tribes except Shan, and Dart Shan (p<0.05.) Medial and Lateral condyle (LCL, MCL): A strong correlation was found between LCL and MCL for males in all the ethnic groups and SAED (r2=.837); lateral condyle significantly larger than the medial condyle (p< .005) were in agreement with previous studies. For the females, only Dart Shan and Venda did not show significant difference between the two condyles (Figures 5 & 6).
Regression equations were estimated for the femoral maximum length from the head diameter (FHD) for male and female population (average of all ethnic groups), and standard error of estimate were calculated.
This study reported the race-specific numerical values of 6 different variables of the femur in 10 African ethnic groups and SAED. Overall sexual dimorphism of femoral length did not differ among the populations studied. In this study, the ethnic groups were presented separately because significant differences existed between SAED, Zulu and other ethnic groups for BL, HD and Wdf. In a previous study, the data from femur was classified into three groups; SAED the tallest or the biggest, Zulu and Nedebule medium size and the rest of the ethnic tribes (Shan, venda, Sotho, Xhosa, Swazi and Tsuwana) the smallest [41]. The sexual dimorphism among all the groups were in agreement with previous studies and showed significant difference (p=.001) between males and females. Shan and Dart Shan were the two ethnic groups which did not show any significant difference between males and females in all the 6 parameters, which is most likely due to the small sample size of the female bones. The author did not exclude these two ethnic groups from the study to highlight the importance of each ethnic group. For HD, Sawazi also did not show significant difference between male and females, this could also be due to small sample size of female bones (n=13) for Swazi ethnic group. It has been reported that sexual demorphism from head diameter and bicondylar width are the most reliable parameters for sex diagnosis and are 94% accurate [36]. This fact was reconfirmed by using other modalities to measure femur. Using CT data of distal femur in a French hospital retrospectically, bicondyle breadth was found to be most reliable parameter to show sexual demorphism in distal femur [25]. Our data confirms that breadth dimensions are more sexually demorphic than linear measurements which is in agreement with King et at [36]. It is assumed that this is due to the weight bearing parts of the bone which contitute a heavy body weight in males than in the females. HNL has also been used to estimate sex and ancestry and its reported to be reliable. [26]. Our results are in agreement with Rebeeca et al and similar dimensions were recorded for White Americans and SAED in males (99.72 mm vs 101.85 mm in this study) and in females (88.02mm vs 89.28mm in this study), which shows population-specific result; showing a range of 81.93- 89.69mm in female enthic Africans and a range of 89.81 mm to 94.45 mm in males. When the lateral and medial condyles were compared, the lateral condyle showed a significant increase in size in both genders in all the groups except in Dart Shan and Venda (female) (n=5) which could be due to a small sample size. Strong correlation of lateral with medial condyle was observed in all the groups and both genders which is in agreement with published data [47]. Etienne et al using CT scan measured MCL and LCL in males and females [25]. The average MCL dimension for French males was 66.7 mm vs 64.53 mm for SAED in this study which suggest similarity among the white population. This also signifies the reliability of measurements done directly on bones for estimation of sex and ancestry. Using the same database, HD and BCB showed strong correlation with FBL in all the ethnic groups and in both sex. This study is in agreement with data reported by Asala et al and Purkait et al who mentioned HD as being the most important variable which demonstrates strong correlation with bone length [24]. The weakness of this study was a small sample size of the female bones in three ethnic groups. But to keep this report race-specific, the author did not combine the specimens of different ethnic groups. Further studies to increase the sample size of the female bones is recommended to over come this shortcoming in the present study.
Conclusions
1. Race-specific numerical values in 10 African tribes for 6
different femoral parameters in both sex were determined. 2. Males dimensions were significantly larger than females dimensions in all the groups.
3. Results also showed strong correlation between LCL
and MCL in both sex; lateral condyle larger than the medial, which is in agreement with previous studies.
Acknowledements
Thankful to Anna Romano, English teacher at Oman Medicalm College for editing this manuscript, and Dr Mark Norrish, Ex-Associate Professor of Behavious Sciences, Oman Medical College, for his enormous help in statistical analysis. Special thanks go to Prof. P.V. Tobias (Late), Prof. John Maina (HOD) and Prof. Beverly Kramer of the Faculty of Anatomical Sciences, University of Witwatersrand for allowing me to use the bone collection at the Raymond A. Dart Collection of Human skeletons. Technical assistance by E. Mofokeng of Dart collection was much appreciated.
References
-
Krishan K, Chatterjee PM, Kanchan T, Kaur S, Baryah N, et al. (2016) A review of sex estimation technique during examination of skeletal remains in forensic anthropology casework. Forensic Sci Int 261: 165e1- 165e8.
-
Bass WM (1995) Human osteology: a laboratory and field manual. Columbia: Missouri Archaeological Society.
-
Gómez-Valdés JA, Quinto-Sánchez M, Menéndez Garmendia A, Veleminska J, Sánchez-Mejorada G, et al. (2012) Comparison of methods to determine sex by evaluating the greater sciatic notch: visual, angular, and geometric morphometrics. Forensic Sci Int 221(1-3): 156.e1-156.e7.
-
Mall G, MHubig, ABüttner, JKuznik, RPenning, et al. (2001) Sex determination and estimation of stature from the long bones of the arm. Forensic Sci Int 117(1-2): 23-30.
-
Spradley MK, Jantz RL (2011) Sex estimation in forensic anthropology: skull versus postcranial elements. J Forensic Sci 56(2): 289-296.
-
Srivastava R, Saini V, Rai RK, Pandey S, Singh TB, et al. (2013) Sexual dimorphism in ulna: an osteometric study from India. J Forensic Sci 58(5): 1251-1256.
-
Uzun I, Iscan MY, Celbis O (2011) Forearm bones and sexual variation in Turkish population. Am J Forensic Med Pathol 32(4): 355-358.
-
Ashley L, Humphries, Ann H Ross (2011) Craniofacial sexual dimorphism in two portuguese skeletal samples. Anthropologiw49(1): 13-20.
-
Asala SA, Bidmos MA, Dayal MR (2004) Discriminant function sexing of fragmentary femur of South African blacks. Forensic Sci Int 145(1): 25-29.
-
Asala SA (2001) Sex determination from the head of the femur of South African whites and blacks. Forensic Sci Int 117(1-2): 15-22.
-
Igbigbi PS, Nanono-Igbigbi AM (2003) Determination of sex and race from the subpubic angle in Ugandan subjects. American J Forensic Med Pathol 24(2): 168- 172.
-
Dayal MR, Bidmos MA (2005) Discriminating sex in South African blacks using patella dimensions. J Forensic Sci 50(6): 1294-1297.
-
Kranioti EF, Michalodimitrakis M (2009) Sexual dimorphism of the humerus in contemporary Cretans--a population-specific study and a review of the literature. J Forensic Sci 54(5): 996-1000.
-
Iscan MY, Miller-Shaivitz (1984) Determination of sex from the tibia. Am J Phys Anthropol 64(1): 53-57.
-
Işcan MY, Shihai D (1995) Sexual dimorphism in the Chinese femur. Forensic Sci Int 74(1-2): 79-87.
-
Bidmos MA, Dayal MR (2004) Further evidence to show population specificity of discriminant function equations for sex determination using the talus of South African blacks. J Forensic Sci 49(6): 1165-1170.
-
Bidmos MA, Steinberg N, Kuykendall KL (2005) Patella measurements of South African whites as sex assessors. HOMO 56(1): 69-74.
-
Bidmos MA, Dayal MR (2003) Sex determination from the talus of South African whites by discriminant function analysis. Am J Forensic Med Pathol 24(4): 322-328.
-
Bidmos MA, Asala SA (2003) Discriminant function sexing of the calcaneus of the South African whites. J Forensic Sci 48(6): 1213-1218.
-
Bidmos MA, Asala SA (2004) Sexual dimorphism of the calcaneus of South African blacks. J Forensic Sci 49(3): 446-50.
-
De Villiers H (1968) Sexual dimorphism in the skull of the South African bantu-speaking Negro. S Afr J Sci 64(2): 118-124.
-
Steyn M, Iscan MY (1998) Sexual dimorphism in the crania and mandible of South African whites. Forensic Sci Int 98(1-2): 9-16.
-
Steyn M, Iscan MY (1997) Sex detemination from the femur and tibia in South Africans whites. Forensic Sci Int 90(1-2): 111-119.
-
Purkait R, Chandra H (2004) A study of sexual variation in Indian femur. Forensic Sci Int 146(1): 25- 33.
-
Cavaignac E, Savall F, Faruch M, Reina N, Chiron P, et al. (2016) Geometric morphometric analysis reveals sexual dimorphism in the distal femur. Forensic Sci Int 259: 246.e1-5.
-
Meeusen RA, Christensen AM, Hefner JT (2015) The Use of Femoral Neck Axis Length to Estimate Sex and Ancestry. J Forensic Sci 60(5): 1300-1304.
-
Chandrakanth HV, Kanchan T, Krishan K (2014) Osteometric analysis for sexing of modern sternum - an autopsy study from South India. Leg Med (Tokyo) 16(6): 350-356.
-
Albanese J, Eklics G, Tuck A (2008) A metric method for sex determination using the proximal femur and fragmentary hipbone. J Forensic Sci 53(6): 1283- 1288.
-
Albanese J (2003) A metric method for sex determination using the hip bone and the femur. J Forensic Sci 48(2): 263-273.
-
Dedouit F, Telmon N, Costagliola R, Otal P, Joffre F, et al. (2007) Virtual anthropology and forensic identification: report of one case. Forensic Sci Int 173(2-3): 182-187.
-
Silva RF, Botelho TL, Prado FB, Kawagushi JT, Daruge Junior E, et al. (2011) Human identification based on cranial computed tomography scan: a case report. Dentomaxillofac radiol 40(4): 257-261.
-
Lorkiewicz-Muszynska D, Kociemba W, Zaba C, Labecka M, Koralewska-Kordel M, Abreu-Glowacka M, Przystanska A (2013) The conclusive role of postmortem computed tomography (CT) of the skull and computer-assisted superimposition in identification of an unknown body. Int J legal Med 127(3): 653-660.
-
Dedouit F, Geraut A, Baranov V, ludes B, Rouge D, et al. (2010) Virtual and macroscopical studies of mummies—differences or complementarity? Report of a natural forzen Siberian mummy. Forensic Sci Int 200(1-3): e7-13.
-
Bulut O, Petaros A, Hizliol I, Warmlander SK, Hekimoglu B (2016) Sexual dimorphism in frontal bone roundness quantified by a noval 3D-based and landmark-free method. Forensic Sci Int 261: 162.e1- 162.e5.
-
Xu GC, Ren F, Hou XW, Yuan LB (2007) Application of the burned bone morphology and DNA technique in human identification. Fa Yi Xue Za Zhi 23(5): 370- 372.
-
King CA, Işcan MY, Loth SR (1998) Metric and comparative analysis of sexual dimorphism in the Thai femur. J Forensic Sci 43(5): 954-958.
-
Church MS (1995) Determination of Race from the Skeleton through Forensic Anthropological Methods. Forensic Sci Rev 7(1): 1-39.
-
Cutland C (1994) Anatomical variations in the proximal part of the femur: differences between sexes and groups. Abstract: Proceedings of the 24th Congress of the Anatomical Society of Southern Africa.
-
Macho GA (1991) Morphological asymmetries in southern African population. Further evidence for lateralization. Int J Anthropol 6(3): 215-229.
-
Macho GA (1990) Is sexual dimorphism in the femur a “population specific phenomenon”? Z Morphol Anthropol 78(2): 229-242.
-
Siddiqi N (2013) Comparison of osteometric femora; bone dimensions among the south africans of different ethnic groups and south africans whites. Egyptian J Forensic Sci 3(1): 8-14.
-
Bidmos MA (2008) Stature reconstruction using fragmentary femora in South Africans of European Descent. J Forensic Sci 53(5): 1044-1048.
-
Tobias PV (1897) Memories of Robert james terry (1871-1966) and the genesis of the Terry and Dart collections of human skeletons. Adler Mus Bull 13: 31-34.
-
Tobias PV (1991) On the scientific, medical, dental and educational value of collections of human skeletons. Int J Anthropol 6(3): 277-280.
-
Saller MK (1957) Lehrbuch der anthropologie. Stuttgart: Gustav Fisher Verlag.
-
Robinson MS, Bidmos MA (2009) The skull and humerus in the determination of sex: reliability of discriminant function equations. Forensic Sci Int 186(1-3): 86.e1-5.
-
Yoshioka Y (1987) The anatomy and functional axes of the femur. J Bone Joint Surg Am 69(6): 873-880.
- Forensic Implications of Adverse Drug Reactions in Schizophrenia A Case Series
- Narcotics and Digital Forensics: Bridging Crimes in the Digital Age
- Ethics in Forensic Psychiatry: Principles, Dilemmas, and Human Rights
- Impact of Acute Stress on Attentional Orienting to Social Cues
- Head Injury and Intracranial Hemorrhage in Western Region of Libya
- A Forensic Study on Handedness: Examination of Handwriting Features in Right and Left Handed Writers