Optimizing Breast Cancer Images from Wire Mesh Collimator SPECT Camera Using Characterized Butterworth Filter
Background: Previous studies have shown that SPECT camera coupled with Wire Mesh Collimator (WMC) has good sensitivity in detecting breast cancer. In this paper, we intend to improve the breast cancer detection through enhancing images by characterized Butterworth filter. The characterization was based on trade-off between noise suppression and spatial resolution degradation. Methods: Monte Carlo simulation studies were performed to obtain projections for a half-ellipsoidal breast phantom in the prone position with five different tumor sizes, and four projection sets with acquisitions of 20, 40, 80, 160 seconds were simulated which gave different count density in the range of 28 to 229 counts/cm2 for each tumor size. Butterworth filter was used to filter the sinograms with 13 different cutoff frequency (Fc), ranging from 0.2 to 0.8 Nyquist frequency (Nq) with 0.05 steps. The relationship between optimum Fc, count density and tumor size were revealed. Results: The results showed that the optimum Fc not only depended on count density but also linked to the change of tumor size. For the case of tumor size, it is suggested that the Fc can be relocated to a higher spatial frequency when tumor size was close to the spatial resolution of SPECT system in order to preserve tumor signal. Conclusion: It may be possible to use a priori knowledge of tumor size and count density as guideline for choosing the optimal parameters of Butterworth filter in Tc-99m breast SPECT imaging.
Introduction
In breast SPECT imaging, projections are obtained from many angles around the breast, and then these data are reconstructed to form the tomographic images by some reconstruction techniques like filtered back projection or iterative methods. Imaging filtering is a key technique related the imaging quality during the image reconstruction process. Butterworth filter is one of the best filter in filtered back projection (FBP) process for SPECT images because it offers good parametric variability for defining sharp edges and able to act as an efficient smoothing filter [1]. However, regarding its Fc, the Society of Nuclear Medicine &Molecular Imaging [2] and European Association of Nuclear Medicine [3] are not explicit about selection of the appropriate Fc, thus it is usually chosen empirically. In clinical practice, several factors would affect the choice of parameters of Butterworth, such as the organs being imaged, the energy of the isotopes, the number of counts and the type of collimators [4, 5]. Therefore there is no accordance between authors concerning the best Fc for Butterworth filter in SPECT imaging [6, 7]. It is suggested that the Fc should be determined by referring to the total counts in each examination [8, 9]. For high count images, a higher Fc is preferred to optimize the reconstruction process of an image. They suggested that the optimal Fc and order could be chosen by evaluating the count density in SPECT- myocardial perfusion imaging. Similarly, Shibutani, et al. [10] also found that Fc of Butterworth filter depended on the count density of projections in the myocardial SPECT imaging and a regression expression was generated for each reconstruction method. It brings an important point that the optimum Fc could be determined by the characteristics of breast cancer SPECT raw projections. Whereas these studies did not consider the effect of tumor size when optimizing parameters of Butterworth filter. Blokland, et al. [11] indicated that the optimal Fc was dependent on the size and extent of the defect. Thus relationship between optimal parameters and tumor size still need to be investigated.
Breast SPECT imagings have been examined in studies [12, 13, 14, 15]. However, no study has investigated the characteristic of Butterworth filter during image reconstruction process in breast SPECT imaging. Wire mesh collimator (WMC) is a newly designed collimator to replace the conventional parallel collimator on low- energy high-resolution (LEHR) types of gamma rays collimated imaging system. Previously, this collimator has only be tested on a breast cancer 2D planar imaging [16, 17, 18, 19]. The weight is approximately half of the conventional parallel collimator, which makes it possible to be configured into a portable dedicated breast SPECT camera.
In this study, we intend to improve breast cancer detection through enhancing images using characterized Butterworth filter. The characterization was based on trade-off between noise suppression and spatial resolution degradation for SPECT configured with WMC, tested on Tc-99m breast images. Monte Carlo methods were applied to generate realistic simulation data in order to determine the parameters involved in affecting the optimum parameters of Butterworth filter and reveal their relationship.
Materials and Methods
Monte Carlo Simulation
The SIEMENS Symbia T camera is a dual-head SPECT camera, which consists of a removable LEHR collimator, a sodium iodide (NaI) scintillation crystal, a light guide and an array of PMT [20]. The detector is filled with NaIwith density of 3.67g/cm3 and size 0.9525 cm in thickness, 53.3x38.7 cm2 in area. Based on this camera, Monte Carlo N-Particle Code Version 5 (MCNP5) [21] was used to simulate the geometry structure of SPECT camera configured with WMC. The WMC is a parallel and square hole type of collimators which have 101 interchangeable layers of wire with the hole size 0.15cm, septa size 0.02cm and thickness 4cm [19]. The geometry of SPECT camera and side view of WMC is shown in Figure 1. The pixel size is 0.48 cm, and a hardware zoom factor of 1.23 is applied, thus yields pixel size with 0.39cm [22, 23]. A Pyrex slab with a density of 1.4718 g/cm3 and thickness of 6.6cm is used to address the issue of backscatter by modelling the backscattering effect due to the light pipe, PMTs, mu- metal magnetic shielding or other structures in a real camera.
Half-ellipsoidal breast phantom as the approximation of the real breast is used to simulate the clinical examination for breast cancer in the prone position [18]. Based on the early stage of TNM system [24, 25], tumor in stage one is investigated in this study. Five different sizes of spherical tumors located in the center of the breast phantom are simulated: 0.1cm, 0.5cm, 1.0cm, 1.5cm and 2.0cm in diameter.
In order to make the simulation approximately close to the real situation, the activity of breast should be assigned properly. For breast imaging, patient is often injected with 20mCi (740MBq) of Tc 99m and patient will take a rest for several minutes to allow Tc 99m to International Journal of Nuclear Medicine & Radioactive Substances
distribute thoroughly [26, 27]. To approximate the activity concentration expected from volumetric breast SPECT, the activity in the breast are converted to units of µCi/mL. Many efforts had been done to measure the activities in
![Figure 1: The pixel size is 0.48 cm, and a hardware zoom factor of 1.23 is applied, thus yields pixel size with 0.39cm [22,23]. A Pyrex slab with a density of 1.4718 g/cm3 and thickness of 6.6cm is used to address the issue of backscatter by modelling the backscattering effect due to the light pipe, PMTs, mu- metal magnetic shielding or other structures in a real camera.](/fulltextimages/2652/fig_1.png)
Breast
Tumor
WMC
NaI detector
Backscattering
the breast [26, 28], and the activity is about 80nCi/mL for breast normal tissue. This activity had also been used in other studies [16, 18].
Hole Spaces WMC
NaI Septa
(a) (b) Figure 1: Geometry of simulated SPECT system components (a) the geometry of dual-head SPECT camera configured with wire mesh collimator. (b) The side view of WMC.
In order to obtain various count density, four projection sets with acquisitions of 20, 40, 80, 160 seconds were simulated which gave different count density. Every projection set was acquired by a 64x64 matrix with 120 angles over 360 degrees with radius of 15 cm, with an angle step of 3o for each projection. The method to generate the projections from the MCNP simulation output files followed our previous study [29].
Since we assigned five tumor sizes, the ideal slice should be created accurately in order to be used in the latter section. First of all, the gray level of tumor area is always assigned to be 255, and the gray level of background is assigned according to tumor-to- background ratio (TBR). For instance, if TBR is 10:1, then the gray level of background is 25.5 (255=255/10). Due to pixel size limitation, tumor only occupies part of pixel at the edge, thus the gray level of those pixels should be assigned according the percentage of tumor area. Ten thousands of points are randomly defined inside each pixel. Thus the fraction of the tumor area can then be approximated by the fraction of points inside the tumor circle compared to the total number of points in the pixel. The calculated ideal slices were shown in figure 2.
After all projections were collected, Butterworth filter with various Fc values, ranging from 0.2 to 0.8 Nq with 0.05 steps, was used to filter the sonogram during the image reconstruction. The order of Butterworth filter was fixed at 6 in this study, which was optimal for many systems [30]. Therefore, when optimizing the parameters of Butterworth filter, many studies also optimized the value of Fc while fixing the value of order [7, 10]. The transaxial slices were obtained by image reconstruction using the filtered back projection with matrix of 64x64, which yields a voxel size of 0.39x0.39x0.39cm3. Images
Creation of Ideal Slice
International Journal of Nuclear Medicine & Radioactive Substances
Optimization Parameters of Butterworth Filter
When optimizing parameters of Butterworth filter, the order was fixed at 6 [33], which also found that there was no major difference in their influence on the Fc of 0.5 Nq or above when estimating the optimized values of Butterworth filter for the quantification of the cardiac volumes and left ventricular ejection fraction for Tc-99m gated myocardial SPECT. Therefore, when optimizing the parameters of Butterworth filter, many studies optimized the value of Fc while fixing the value of order [4, 7, 10, 34].
Optimum Fc for the different count density and tumor size was assessed by objective method which calculates the mean square error (MSE) with the ideal slice. The MSE as defined in Eq. (1) was calculated for each projection set and then optimum Fc was determined based on the point where the least MSE value was obtained. MSE is an
indicator that can give an objective and reproducible
measure of the reconstruction accuracy and it also makes
agreement with visual assessment. Therefore, MSE was
used for parameter optimization [34]. It can be calculated
$$ \begin{array}{l} \mathrm {M S E} = \left(\sum_ {-} (\mathrm {x} = 1) ^ {\wedge} \mathrm {N} \sum_ {-} (\mathrm {y} = 1) ^ {\wedge} \mathrm {M} \sum_ {-} [ \mathrm {f} (\mathrm {x}, \mathrm {y}) - \mathrm {g} (\mathrm {x}, \mathrm {y}) ] ^ {\wedge} 2 \right) / (\mathrm {N} \times \mathrm {M}) \tag {1} \\ \end{array} $$
![Figure 2: After all projections were collected, Butterworth filter with various Fc values, ranging from 0.2 to 0.8 Nq with 0.05 steps, was used to filter the sonogram during the image reconstruction. The order of Butterworth filter was fixed at 6 in this study, which was optimal for many systems [30]. Therefore, when optimizing the parameters of Butterworth filter, many studies also optimized the value of Fc while fixing the value of order [7,10]. The transaxial slices were obtained by image reconstruction using the filtered back projection with matrix of 64x64, which yields a voxel size of 0.39x0.39x0.39cm3. Images](/fulltextimages/2652/fig_2.jpeg)
Relationship between total Counts, Tumor Size and Power Spectra
Figure 4(a) showed the simulated sinogram spectra with various acquisition time and the magnitude of the values in the spatial frequency spectrum was summed over all angles in the sinogram and shown in the logarithmic scale. Features of the underlying signal In order to clearly show the effect of tumor size on the spectrum, a separate spectrum for tumor was presented.
International Journal of Nuclear Medicine & Radioactive Substances
strength tapered rapidly with increasing spatial frequency for larger tumor and more slowly for smaller tumor.
$$ \begin{array}{l} \mathrm {t u m o r} \mathrm {s i z e} = 0. 1 \mathrm {c m} \\ \mathrm {t u m o r} \mathrm {s i z e} = 0. 5 \mathrm {c m} \\ \mathrm {t u m o r} \mathrm {s i z e} = 1. 0 \mathrm {c m} \\ \mathrm {t u m o r} \mathrm {s i z e} = 1. 5 \mathrm {c m} \\ \mathrm {t u m o r} \mathrm {s i z e} = 2. 0 \mathrm {c m} \\ \end{array} $$
(a) (b) Figure 4: (a) Spatial frequency distribution for different total image counts for fixed tumor size. (b) Spatial frequency distribution for different tumor for fixed total image counts.
Figure 5 (a)-(d) depicted the relationship between tumor size and MSE for the acquisition time 20s, 40s, 80s, 160s, respectively. As was indicated in the graph, there
10
10 $$ \begin{array}{l} D = 0. 1 \mathrm {c m} \\ D = 0. 5 \mathrm {c m} \\ D = 1. 0 \mathrm {c m} \\ D = 1. 5 \mathrm {c m} \\ D = 2. 0 \mathrm {c m} \\ \end{array} $$
10 $$ \begin{array}{l} D = 0. 1 \mathrm {c m} \\ D = 0. 5 \mathrm {c m} \\ D = 1. 0 \mathrm {c m} \\ D = 1. 5 \mathrm {c m} \\ D = 2. 0 \mathrm {c m} \\ \end{array} $$
$$ \begin{array}{l} D = 0. 1 \mathrm {c m} \\ D = 0. 5 \mathrm {c m} \\ D = 1. 0 \mathrm {c m} \\ D = 1. 5 \mathrm {c m} \\ D = 2. 0 \mathrm {c m} \\ \end{array} $$
$$ \begin{array}{l} D = 0. 1 \mathrm {c m} \\ D = 0. 5 \mathrm {c m} \\ D = 1. 0 \mathrm {c m} \\ D = 1. 5 \mathrm {c m} \\ D = 2. 0 \mathrm {c m} \\ \end{array} $$
International Journal of Nuclear Medicine & Radioactive Substances
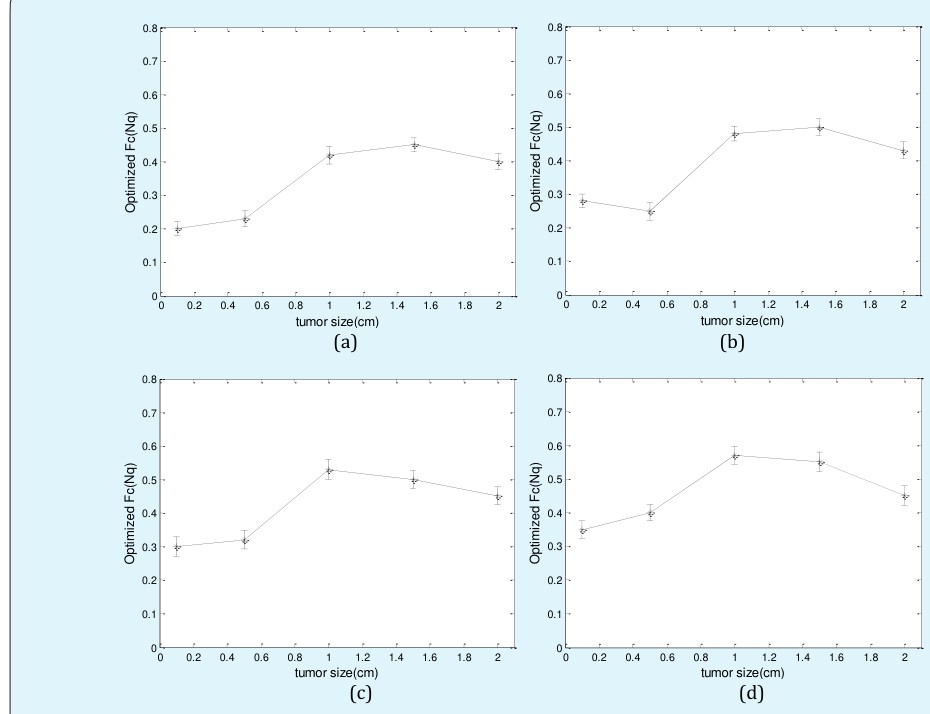
Regarding to results from MSE, the results shown in figure 6 imply that the optimum Fc not only depends on the count density but also on tumor size. The error bar was the standard deviation calculated from three random number seeds. As we can see that, it raised up slowly along with the increase of tumor size in all cases. It changed from 0.2Nq to 0.4Nq and 0.28Nq to 0.5Nq for 20s and 40s acquisition time, respectively. The optimal value first reached a peak point and then decrease from the point. As can be seen from the figure 6 (a) and (b), the highest Fc was obtained when tumor size was 1.5cm, and then it started to decrease for tumor size 2.0cm. It is worth mentioning that the peak point moved to tumor size 1.0cm with longer acquisition time.
Since spatial resolution of SPECT system is nearly 1.0cm, it is assumed that this peak point related to spatial resolution of SPECT system. It means that tumor size 0.1cm and 0.5cm, which were smaller than spatial resolution of the SPECT system, were almost impossible to be visible in the background. Therefore, low Fc was preferred. On the other hand, when tumor size was bigger than 1.0cm, Fc should be decreased along with the increase of tumor size. This is reasonable, according to analysis of figure 4 (a), a critical point which was dividing point between the tumor signal and noise moved to lower frequency along with the increase of tumor size. Therefore, Fc need to decrease along with the increase of tumor size. This results made agreement with the previous studies [11], which also showed it was object size dependent.
International Journal of Nuclear Medicine & Radioactive Substances
The count density was determined by averaging the count per pixel for four equally spaced 5x5 pixel regions on the projection image. This way for determination of count density was used because the radiologist can quickly perform this task to obtain the count density for projection .The count densities calculated were 28.4±0.2, 56.9±0.5, 114.3±0.8, and 229.5±1.9 counts/cm2 for acquisition time 20s, 40s, 80s, and 160s, respectively. The relationship between the optimized Fc and count density was shown in figure 7. When count density was low, noise level was high, a lower Fc was preferred to be implemented on the image to remove noise. Whereas, as count density went high, more features began to merge, thus a high Fc could preserve signals. However, when count density became bigger, the optimal Fc started to be saturated.
This result made agreement with the previous studies [34], which showed the optimal Fc of Butterworth filter increased with higher count density. Generally, a low Fc is preferred for low count density projections while a high Fc should be implemented on high count density
projections. Ramom, et al. [8] showed linear relationship between optimal Fc and dose level. Shibutani, et al. [10] revealed the relationship by a two-degree polynomial function, which showed a similar trend as that in this study. However, different value of Fc was obtained in our study mainly due to different organs being imaged since the previous studies were done in either myocardial study or brain study, this study was done for breast SPECT imaging. In addition to that, different acquisition parameters also lead to different optimum parameters since Onishi, et al. [4] reported varied optimal image reconstruction parameters depended on different acquisition parameters. However, the result revealed that range of optimized Fc were apparently different even though the optimal Fc raised gradually no matter how big the tumor size was and trends were almost similar. Figure 7 shows that optimized Fc lies in the range of 0.2 to 0.4 Nq for tumor size less than SPECT spatial resolution while 0.4 to 0.55 Nq for bigger tumor size, which indicated that optimized Fc for various count density should be assigned referring to tumor size.
(e) Figure 7: Relationship between different count density, optimized Fc when TBR was 10:1. The results obtained from different tumor size were shown in (a) 0.1 cm; (b) 0.5 cm; (c) 1.0 cm; (d) 1.5 cm; (e) 2.0cm.
decreased the star artifacts in the slice. The reduced noise level led to increased tumor detect ability. Meanwhile, small areas appeared in the upper row images which would be misdiagnosis as a tumor. Whereas, the optimized images decreased the possibility of misdiagnosis. In summary, the optimized Fc could provide the trade-off between noise smoothing and resolution degradation and adjust well for various imaging conditions.
Fc=0.50
Fc=0.50
Fc=0.50
Fc=0.20
Fc=0.23
Fc=0.42
Fc=0.50
Fc=0.50
Fc=0.45
Fc=0.40
(a) (b) (c) (d) (e) Figure 8: Comparison of reconstructed breast slices in the region of interest between default Fc (upper row) and optimized Fc (lower row), (a)-(e) show results for different tumor size.
International Journal of Nuclear Medicine & Radioactive Substances
Conclusion
Characteristic of sinogram for WMC in Tc-99m breast SPECT imaging was investigated in this research and we found that the optimum parameter of Butterworth filter has relation with count density and tumor size. In order to improve breast cancer detection, it is suggested that the optimal Fc should change with the increase of tumor size and the peak point related to spatial resolution of SPECT system. Furthermore, optimized Fc for different count density situation should be referred to tumor size.
Future Works
These experiments were conducted when TBR was fixed. In the future, relationship between optimized parameters and TBR will be considered. All these factors exist in the real situation, so a mathematical equation is needed to combine all the factors together to optimize Fc of Butterworth filter.
References
-
Van Laere K, Koole M, Lemahieu I, Dierckx R (2001) Image filtering in single-photon emission computed tomography: principles and applications. Comput Med Imaging Graph 259(2): 127-133.
-
Khalkhali, Diggles LE, Taillefer R, Vandestreek PR, Peller PJ, et al. (2004) Procedure guideline for breast scintigraphy 2.0: 1-4.
-
Giammarile F, Alazraki N, Aarsvold JN, Audisio RA, Glass E, et al. (2013) The EANM and SNMMI practice guideline for lymphoscintigraphy and sentinel node localization in breast cancer. Eur J Nucl Med Mol Imaging 40(12): 1932-1947.
-
Onishi H, Matsutake Y, Matsutomo N, Amijima H (2010) Validation of optimal cut-off frequency using a Butterworth filter in single photon emission computed tomography reconstruction for the target organ: Spatial domain and frequency domain. J Fac Heal Welf 10 (1): 27-36.
-
Lyra M, Ploussi A (2011) Filtering in SPECT image reconstruction. Int J Biomed Imaging 1-14.
-
Wright GA, McDade M, Martin W, Hutton I (2002) Quantitative gated SPECT: the effect of reconstruction filter on calculated left ventricular ejection fractions and volumes. Phys Med Biol 47(8): N99-105.
-
Sankaran S, Frey EC, Gilland KL, Tsui BMW (2002) Optimum compensation method and filter cutoff frequency in myocardial SPECT: a human observer study. J Nucl Med 43(3): 432-438.
-
Juan Ramon, Yang Y, Pretorius PH, Slomka PJ, Johnson KL, et al. (2017) Investigation of dose reduction in cardiac perfusion SPECT via optimization and choice of the image reconstruction strategy. J Nucl Cardiol 1- 12.
-
Mizutani, Matsunari I, Kobayashi M, Nishi K, Fujita W, et al. (2015) Impact of injection dose, post- reconstruction filtering, and collimator choice on image quality of myocardial perfusion SPECT using cadmium-zinc telluride detectors in the rat. EJNMMI Phys 2: 1-17.
-
Shibutani T, Onoguchi M, Yamada T, Kamida H, Kunishita K, et al. (2016) Optimization of the filter parameters in 99mTc myocardial perfusion SPECT studies: the formulation of flowchart. Australas Phys Eng Sci Med 39(2): 571-581.
-
Blokland KAK, Winn RDR, Pauwels EKJ (2000) Signal to noise ratio based filter optimization in triple energy window scatter correction. Med Phys 27(8): 1955-1960.
-
Wang Y, Tsui BMW, Member S, Baird WH, Frey Ec, et al. (2001) Investigation of Acquisition and Image Reconstruction Parameters for Rotating Multi- Segment Slant-Hole SPECT. In: Nucl Sci Symp Conf Rec 2143-2146.
-
Baird WH, Frey EC, Tsui BMW, Wang Y, Wessell, et al. (2003) Evaluation of rotating slant-hole SPECT mammography using Monte Carlo Simulation methods. IEEE Trans Nucl Sci 50(1): 105-109.
-
Metzler SD, Bowsher JE, Tornai MP, Pieper BC, Member S, et al. (2002) SPECT Breast Imaging Combining Horizontal and Vertical Axes of Rotation. IEEE Trans Nucl Sci 49(1): 31-36.
-
Perez KL, Cutler SJ, Madhav P, Tornai MP (2011) Towards Quantification of Functional Breast Images Using Dedicated SPECT With Non-Traditional Acquisition Trajectories. IEEE Trans Nucl Sci 58(5): 2219-2225.
-
Saad WHM, Roslan RE, Mahdi MA, Choong WS, Saion E, et al. (2011) Monte Carlo design of optimal wire mesh collimator for breast tumor imaging process. International Journal of Nuclear Medicine & Radioactive Substances Nucl Instruments and Methods in Phys Res 648(1): 254-260.
-
Saripan M, Saad W, Suhairul Hashim, Rozi Mahmud, Abdul Jalil Nordin, et al. (2009) Monte Carlo Simulation on Breast Cancer Detection Using Wire Mesh Collimator Gamma Camera. IEEE Trans Nucl Sci 56(3): 1321-1324.
-
Roslan RE, Saad WHM, Saripan MI, Hashim S, Choong WS (2010) The performance of a wire mesh collimator SPECT camera for different breast volumes in prone position. Nucl Instruments Methods Phys Res Sect A: Accel Spectrometers Detect Assoc Equip 619(1-3): 385-387.
-
Saripan MI, Petrou M, Wells K (2007) Design of a wire-mesh collimator for gamma cameras. IEEE Trans Biomed Eng 54(9): 1598-1612.
-
(2010) Siemens, Siemens Spect Symbia T: System specifications.
-
X-5 Monte Carlo Team (2005) MCNP - A General Monte Carlo N-Particle Transport Code. Version 5, pp: 1-146.
-
Bahreyni Toossi MT, Islamian JP, Momennezhad M, Ljungberg M, Naseri SH (2010) SIMIND Monte Carlo simulation of a single photon emission CT. J Med Phys 35(1): 42-47.
-
Gopal Saha B (2013) Physics and Radiobiology of Nuclear Medicine. Springer, New York , pp: 356.
-
(2014) Number Stages of Breast Cancer. Cancer Research.
-
Sobin LH, Gospodarowicz MK, Wittekind CH (2009) TNM : classification of malignant tumours, seventh, Willey-Blackwell press, pp: 1-332.
-
Perez KL (2011) Investigating Functional Breast Image Quality and Quantification with a dedicated SPECT-CT System, Duke University.
-
O'Connor ML, Phillips SW, Hruska CB, Rhodes DJ, Collins DA (2007) Molecular breast imaging: advances and limitations of a scintimammographic technique in patients with small breast tumors. Breast J 13(1): 3-11.
-
Mann SD, Perez KL, McCracken EKE, Shah JP, Wong TZ, et al. (2012) Initial in vivo quantification of Tc- 99m Sestamibi uptake as a function of tissue type in healthy breasts using dedicated breast SPECT-CT. J Oncol 2012: 1-7.
-
Dong X, Saad WHM, Adnan, Hashim S, Hassan NPM, et al. (2013) Simulation of intrinsic resolution of scintillation camera in Monte Carlo environment. In: IEEE ICSIPA, IEEE Int Conf Signal Image Process Appl 11-14.
-
(2013) American College of Radiology. Site Scanning Instructions for the ACR Nuclear Medicine. Phantom ACR Nuclear Medicine Accreditation Program, pp: 1- 18.
-
Lyra M, Ploussi A, Rouchota M, Synefia S (2014) Filters in 2D and 3D Cardiac SPECT Image Processing. Cardiol Res Pract 1-11.
-
(2003) IAEA, IAEA Quality Control Atlas for Scintillation Camera Systems.
-
Duarte DD, Monteiro MS, Hakmaoui FE, Prior JO, Vieira L, et al. (2012) Influence of Reconstruction Parameters During Filtered Backprojection and Ordered-Subset Expectation Maximization in the Measurement of the Left-Ventricular Volumes and Function During Gated SPECT. J Nucl Med Technol 40(1): 29-36.
-
Minoshima S, Maruno H, Yui N, Togawa T, Kinoshita F, et al. (1993) Optimization of Butterworth filter for brain SPECT imaging. Ann Nucl Med 7: 71-77.
-
Takavar, Shamsipour G, Sohrabi M, Eftekhari M (2004) Determination of optimum filter in myocardial SPECT: A phantom study. Iran J Radiat Res 1: 205- 210.
-
Groch MW, Erwin WD (2000) SPECT in the year 2000: basic principles. J Nucl Med Technol 28(4): 233-244.
-
Weinmann P, Moretti JL, Brauner MW (2008) Usefulness of tomographic versus planar lung scintigraphy in suspected pulmonary emoblism in a daily practice. Open Med Imaging 2: 49-55.
- Contribution of 18FDG PET in Atypical HORTON Disease
- Living Conditions, Healthy Practice and State of Households of a Town Rural in Colombia
- Background to the Health and Safety Regulation at Work in Colombia
- Risk Factors Psychology Workers Sena (Center for the Petrochemical Industry) Regional Bolívar, Colombia
- Diffuse Intense Pleural FDG Uptake with Smooth Thickening: A MARKER of Tuberculosis in Isolated Pleural Effusion
- Hypermetabolic Splenomegaly with Infarct in FDG PET/CT: A Clue to Scrub Typhus in PUO