Diffuse Intense Pleural FDG Uptake with Smooth Thickening: A MARKER of Tuberculosis in Isolated Pleural Effusion
Case Presentation
A 50 year old man presented with fever and breathing difficulty for 5 days. His chest X-ray showed massive left pleural effusion. His complete hem gram, RFT, LFT and urine routine were unremarkable. ESR (36 mm/Hr) and CRP (40.9 mg/L) were elevated; blood culture was negative. CT thorax showed left pleural effusion with collapse of the left lung lower lobe and mild mediastina shift to the right. He was treated with left intercostal tube drainage and pleural fluid cytology showed lymphocytic effusion with no evidence of malignant cell or acid-fast bacilli (AFB). Pleural fluid biochemical analysis and culture were also not contributory. Contrast enhanced CT of the abdomen was normal.
FDG-PET /CT were done after 2 weeks to assess the possible cause and extent of disease and to localize the site for tissue biopsy. Based on the diffuse intense metabolic activity in the pleura with no other lesions, tuberculosis was considered as a possible diagnosis (Figure 1 & Figures 2A-2D). USG guided Pleural biopsy from the FDG-avid posterior-inferior costal pleura demonstrated caseation granulomas (Figure 2E) and AFB (Figure 2F) thus confirming tuberculosis.
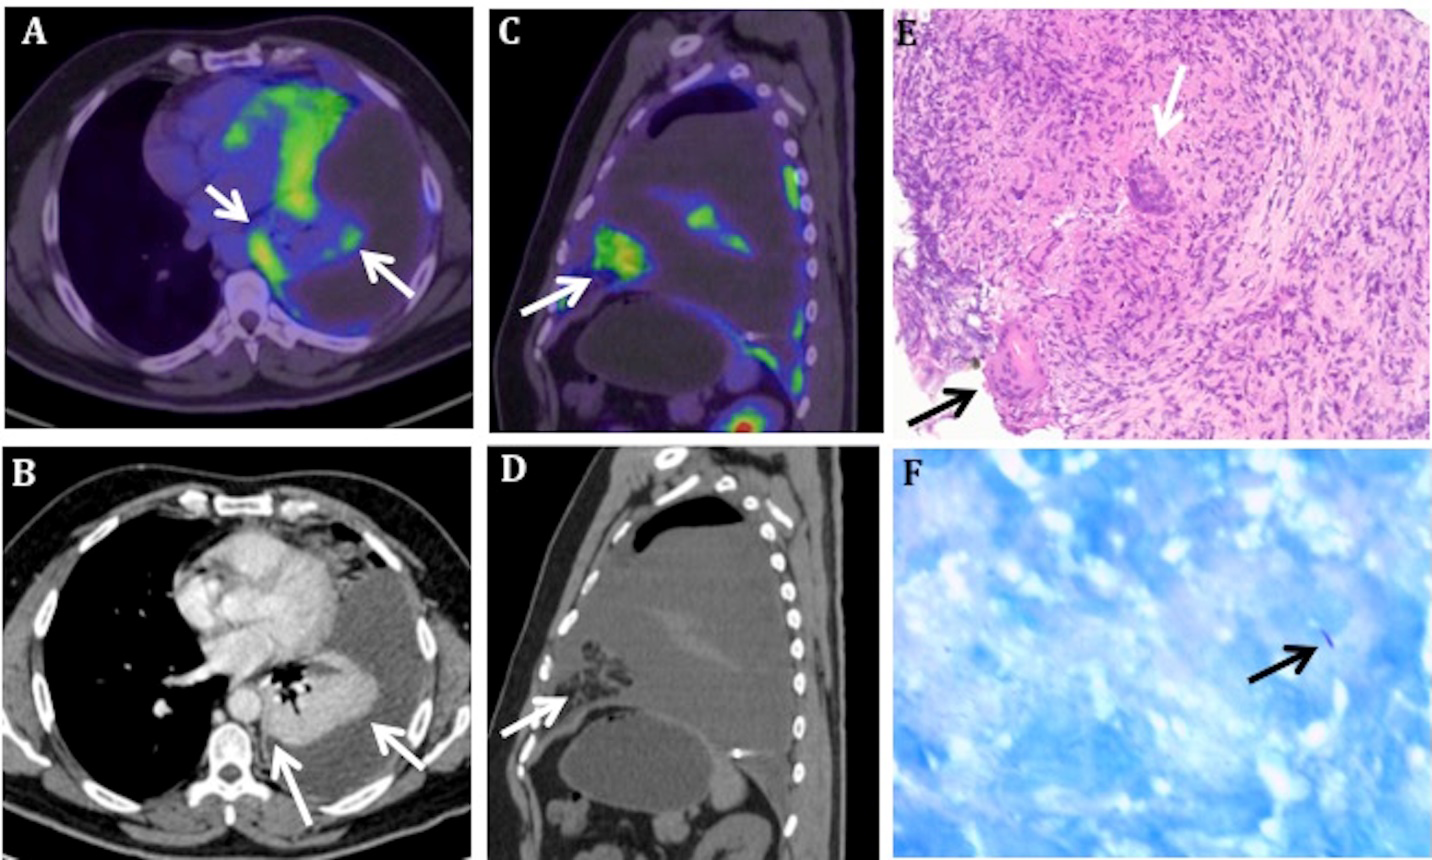
Figure 1: MIP image (A) showing abnormal FDG avid regions limited to the left hemi thorax. Coronal (B) and axial (C) fused PET/CT showing diffusely increased FDG uptake in the left parietal pleura involving the mediastina (arrow in B) and posterior- inferior costal pleura (arrow in C). Coronal (D) and axial (E) CT show gross left pleural effusion (maximum anterior posterior depth ~17.0 cm). Axial CT (E) shows diffuse smooth left pleural thickening in the FDG avid areas. The FDG uptake (SUV max 10.5) is disproportionately high compared to the pleural thickening (~2 mm), which was missed on diagnostic CT thorax.
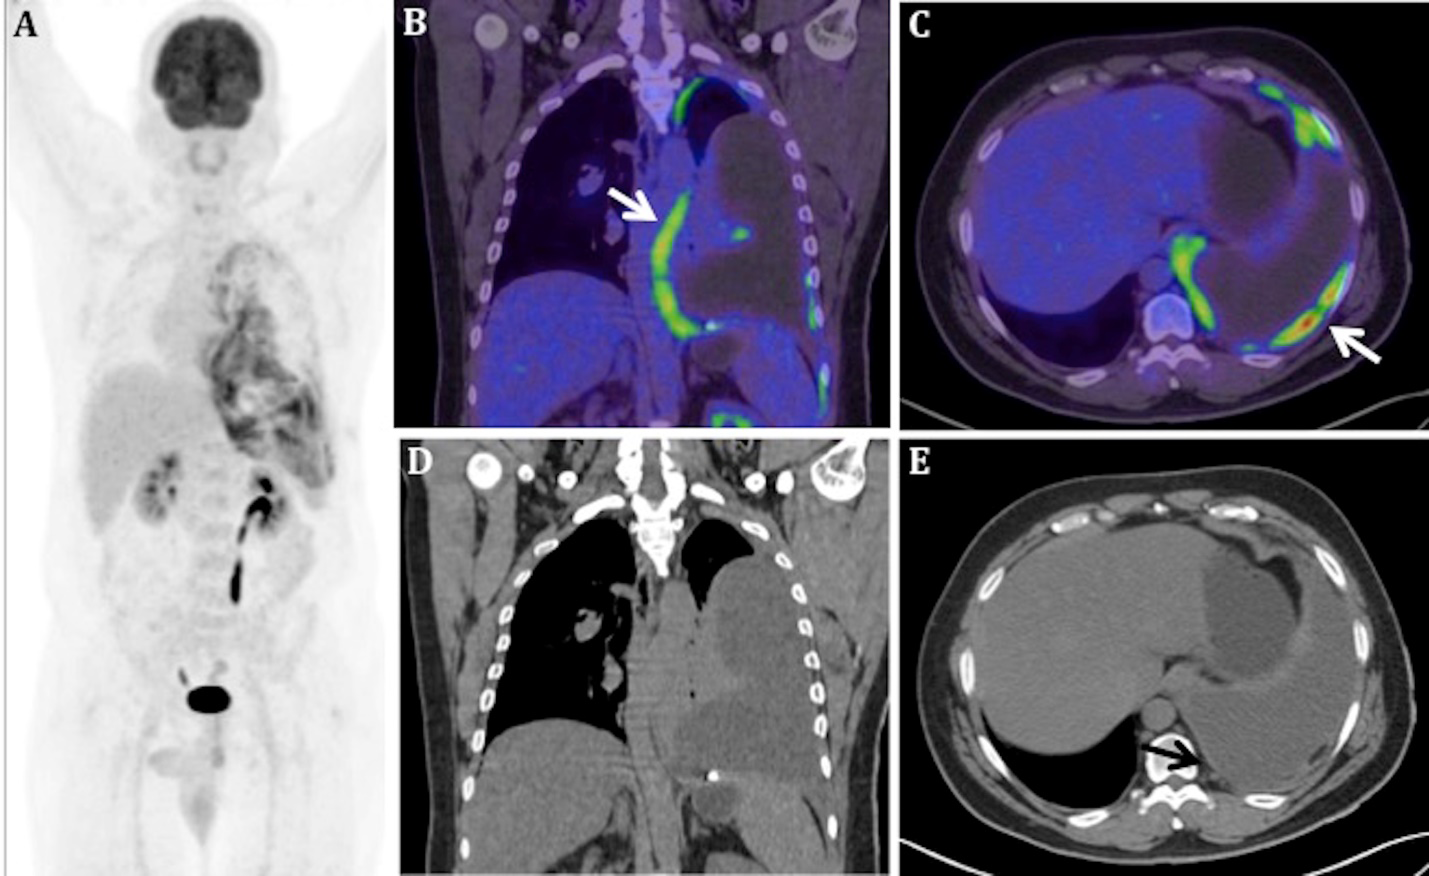
Figure 2: Axial fused PET/CT (A) image shows diffuse FDG avidity (SUVmax 6.3) in periphery of the basal segments of the collapsed lower lobe (arrows in A), likely representing visceral pleural involvement, since the contrast enhanced CT done previously did not show any focal hypo attenuation or nodular change (arrows in B). Sagittal CT (C) and fused PET/CT (D) show FDG avid (SUVmax 7.6) nodular fat stranding in the left epiphrenic region (arrows in C and D), adjacent to the mediastina pleura. Eosin-Hematoxylin (100x) stain (E) shows granulomas with multinucleated Langham’s giant cell (arrows), central caseation necrosis and no malignant cell. Ziehl Nielson’s (400x) stain (F) shows beaded AFB (arrow).
Conclusion
In conclusion, Diffuse pleural uptake with smooth pleural thickening in the absence of extra pleural lesions is predominantly seen in tuberculosis [1, 2] and the FDG avid areas can be targeted for pleural biopsy to facilitate accurate diagnosis.
References
-
Yajuan S, Hongjuan Y, Jingquan M, Peiou L (2016) The Role of 18F-FDG PET/CT Integrated Imaging in Distinguishing Malignant from Benign Pleural Effusion. PLoS One 11: e0161764.
-
Yang MF, Tong ZH, Wang Z, Zhang YY, Xu LL, et al. (2019) Development and Validation of the PET-CT Score for Diagnosis of Malignant Pleural Effusion. Eur J Nucl Med Mol Imaging 46(7): 1457-1467.
- Contribution of 18FDG PET in Atypical HORTON Disease
- Living Conditions, Healthy Practice and State of Households of a Town Rural in Colombia
- Background to the Health and Safety Regulation at Work in Colombia
- Risk Factors Psychology Workers Sena (Center for the Petrochemical Industry) Regional Bolívar, Colombia
- Hypermetabolic Splenomegaly with Infarct in FDG PET/CT: A Clue to Scrub Typhus in PUO
- Water Management for of Proton Exchange Membrane Fuel Cells Marketing and Sensitive Balance