Water Management for of Proton Exchange Membrane Fuel Cells Marketing and Sensitive Balance
Introduction
Because of their high energy density at low operating temperatures, quick start-up, and zero emissions, PEMFCs are seen as a potential solution to environmental and energy problems are expected to become the most promising energy converters for automotive, stationary, and portable applications shortly [1]. As a result, governments consider PEMFCs as a feasible method to reduce greenhouse gas emissions. Consequently, thermal and water management must be optimized [2]. Thermal management is necessary to remove heat from the membrane to prevent overheating and dehydration. Water management is also critical. According to recent research, water management is essential to achieving optimal performance and durability from PEMFCs [3]. On the one hand, to maintain adequate proton conductivity and performance, the relative humidity of the incoming gases is kept high to keep the membrane well-hydrated [4]. Evaporation, water vapor diffusion, and capillary transport must be used to remove the liquid water that has accumulated in the flow channel or electrode pore. If the produced or condensed water drops or the drained water increases, the membrane may dry up, reducing fuel cell efficiency. In the car fuel cell, frequent health flaws such as water flooding and membrane drying that impact the stable operation and life of the fuel cell develop readily [4]. As a result, understanding the water transport pathways is critical for enhancing fuel cell performance and durability. The effect of parallel flow channels on water removal is subtle, although the pressure loss is minimal. The serpentine flow channels offer a high capacity for water removal and substantial pressure dips. Although the interdigitated flow channels have a strong water removal performance, the pressure loss is too considerable, especially for the large-area PEMFC. Because of the necessity of flow channel of water removal, serpentine flow channels are utilized to assure the fuel cell’s water removal capability.
The purpose of the present review is to summarize the movement of water or other electroneutral solvents through a membrane-associated with the moving of ions under the influence of an electric field. In addition, water transportation, mechanism of transport, and membrane water transport with sorption/desorption are discussed.
Electroosmotic Drag in Membranes
Electroosmotic drag in membranes refers to the movement of water or other electroneutral solvents through a membrane associated with the movement of ions under the influence of an electric field [5]. The flux of water typically generates a difference between the water concentrations on both sides of the membrane, resulting in the transportation of water by diffusion portrayed as “back diffusion,” which is directed from cathode to anode [6]. Some authors have adapted the experimental conditions for reducing diffusion; some consider diffusion in the model used for the analysis of the experimental results; a pseudo-two-dimensional model has been developed to separate diffusion and electro-osmosis contribution to water transport through the membrane [7].
nwater=nd iA/F When nd is the coefficient of electro-osmotic drag and has the water molecules units per proton, this flux reduces as hydration of the membrane decreases. This model of water movement has been quantified extensively. Zawodzinsky, et al. [8] tried to quantify and found that the membranes were balanced between fluid and vapor. Others found the electro-osmotic drag coefficient to raise the temperature and decrease the membrane water content. You have created a way for measuring (nd) operating a hydrogen-pumping cell. Pivovar has provided a summary of the coefficient techniques. Janssen et al examined the drag coefficient and their relationships with density, temperature, pressure, and input humidity. The effective drag coefficient. The main modes of mass transport are generally believed to be diffusion and electro-osmotic drag. However, Berning et al [9] concluded that the membrane was attributable to diffusing alone in the opinion of net water transfer.
The zeta potential of a membrane-electrolyte contact usually creates an electrical double layer (EDL). When an electrical field is supplied in an EDL to fluid, the ensuing Coulomb force induces the net charge to move [10]. The ion movement drags the solvent together, creating bulk fluid movement because of dynamic transmission (viscous drag). An external electrical field called this bulk liquid motion electroosmosis and can occur in any net loading fluid, even in membrane channels or membrane holes.
In many membrane techniques, including Electroosmotic drag (EOD), often called ‘water transport,’ one reason for losing current density is the underlying process implicated in solvent transport [11]. Electrodialysis (ED) has several industrial applications, including chlorine production, NaOH, other inorganic acids and bases EOD water in proton exchange membranes, which leads to problems in water management. Methanol EOD (DMFCs), leading to a methanol overlay in direct methanol fuel cells. EODs can cause vanadium crossover and capacity loss in vanadium redox batteries (VRBs). EOD is used for flow or pressure generation in electroosmotic pumps (EOPs) [12]. EOPs can help fuel cell PEM hydration. EOD is a mechanism for anomalous flux produced by the loaded membranes (e.g., NF membranes) because of the axial rearrangement of the EDLs, because of the preferential transition of one kind of loaded ion over another.
The Coulomb force exerted by an electric field on the net mobile electric charge in a solution causes electroosmotic flow [13]. Because the chemical equilibrium between a solid surface and an electrolyte solution usually results in the interface gaining a net fixed electrical charge, an electrical double layer or Debye layer occurs surrounding the interface. The Coulomb force causes the net charge in the electrical double layer to move when an electric field is given to the fluid (typically via electrodes positioned at inlets and outlets). Electroosmotic flow is the name given to the resulting flow [14].
The plug flow is the outcome of applying a voltage. A plug flow’s velocity profile is nearly flat, with minimal fluctuation near the electric double layer, unlike a parabolic profile flow created by a pressure differential [15]. This suggestion has fewer harmful dispersive effects and can be managed without valves, making it a high-performance approach for fluid separation, albeit with many intricate considerations that make control challenging. Because measuring and monitoring flow in microfluidic channels is challenging because of the flow pattern disrupted, most analysis is done using numerical methods and simulation [16].
Electroosmotic flux through microchannel can be described with the driving force arising from the electric field and pressure difference following the Navier-Stokes’s equation. It is therefore regulated by the equation of continuity [17].
$$ \nabla . U = 0 $$
Linear momentum, often known as translational momentum or simply momentum, is the product of an object’s mass and velocity in Newtonian theory. It’s a two-dimensional vector quantity with a magnitude and a direction. If an object’s mass is m and its velocity is v, then its momentum equals.
and momentum
$$p \frac{DU}{Dt} = \nabla p + \mu \nabla 2U + \text{pe} \nabla (\psi + \phi),$$
where $U$ is the velocity vector, $\rho$ is the density of the fluid, $D/$ Dt is the material derivative, $\mu$ is the viscosity of the fluid, $pe$ is the electric charge density, $\phi$ is the applied electric field, $\psi$ is the electric field due to the zeta potential at the walls and $p$ is the fluid pressure.
Laplace’s equation can describe the external electric field
$$\nabla^2 f = 0$$
where $\nabla^2$ is the Laplace operator
$$\nabla^2 \psi = \frac{-Pe}{\varepsilon 0},$$
Where $\varepsilon$ is the dielectric constant of the electrolyte solution and $\varepsilon 0$ is the vacuum permittivity. This equation can be further simplified using the Debye-Hückel approximation
$$\nabla^2 \psi = K^2 \psi,$$
where $1 / k$ is the Debye Length, used to describe the characteristic thickness of the electric double layer.
Electroosmotic flow is used in microfluidic devices, soil analysis and processing, and chemical analysis, all of which involve highly charged surfaces, often oxides. Capillary electrophoresis is an electric field to separate chemicals according to their electrophoretic mobility [18]. The electroosmotic flow affects the analytes’ elution time in electrophoretic separations.
Electroosmotic flow is triggered in a Flow FET to control fluid flux across a junction. Microfluidic devices that use electroosmotic flow are expected to be used in medical research in the future. The capacity to split fluids on an atomic level will be a critical component for drug dischargers once the management of this flow is better understood and realized [19]. At the moment, mixing fluids at the micro-size is hard. Small fluids are expected to be combined using controlled fluids [20].
In fuel cells, electro-osmosis causes protons moving through a proton exchange membrane (PEM) to drag water molecules from one side (anode) to the other (cathode) [21]. Ionomeric materials such as Nafion®, which are perfluorinated sulphonic membranes, are employed in PEM fuel cells. The existence of the negative sulphonic charges on the wall surfaces of the nano-sized pores of the membrane leads to the establishment of a concentration gradient of protons leading to a potential distribution in the electrolyte [22]. The electric double layer, or EDL, is the name given to this region. When exposed to the electrical field of a working cell (for example, in the range of roughly 3000 V/m), a considerable electrokinetic body force is generated, which moves protons in the pores and drags water molecules along the membrane with them. EOF is a phenomenon that increases membrane resistance and reduces fuel cell performance [23].
Water Transportation
Water management is the chief difficulty facing the membrane. The failure in this context leads to durability difficulties, water transportation in the stack, and thermal management. Excessive water can lead to floods, while water shortages can also lead to dryness. None of these are acceptable since they influence PEM fuel cell performance on the polarization curve [24].
If the fuel and oxidant are partially humidified, water can enter the anode and cathode. Water is also created in the cathode because of oxygen reduction. Water is transferred across the membrane in two ways: EOF and backdiffusion from the cathode to the anode. Because EOF increases membrane resistance and lowers fuel cell efficiency, determining and managing the degree of EOF in the membrane is critical for optimizing PEM fuel cell performance [25].
The qualities of various components, such as the gas diffusion layer and bipolar plate, affect the gas structure and water transport in a PEM fuel cell [26]. The generation of water in the PEM fuel cell took place on the cathode side because of the electrochemical reaction. It occurs because protons drag water from the anode to the cathode through the electrolyte. Water molecules produce clusters or channels that protons can travel through vehicles and mechanisms of Grotthuss [27]. That is why the proton conductance of Nafion® depends substantially on its water content, balanced by two techniques, concentration gradient diffusion, and electroosmotic drag. Electro-osmotic drag and back diffusion are the two main water transport methods in PEM fuel cells, and this mechanism affects the hydration state of an electrolyte membrane, which is critical for proton conductivity to travel across it readily [28]. Other types of water transport include thermal-osmotic drag and hydraulic permeation, besides electro-osmotic drag and back diffusion (Table 1). Electro-osmotic drag and back diffusion have been the focus of recent research since they are the primary sources of water flooding in fuel cells [29]. The impact of thermal, osmotic drag on water management has received little attention in the past, and water movement because of temperature changes has only lately gained attention. Temperature changes generated thermal osmotic drag (TOD) in a fuel cell across the membrane. A temperature differential occurs across the electrolyte membrane during fuel cell operation. The heat pipe effect is thought to be one of the key mechanisms of TOD [28]. This heat pipe effect exists in a PEM fuel cell at the catalyst layer and is caused by the evaporation of water, which moves as vapor then condenses down a path because temperature decrease is given the temperature gradient in the cell. During the start- up and shut-down of the fuel cell, this form of transportation is critical. Protons migrate from the anode to the cathode portion of the membrane, accompanied by water molecules.
Electro-osmotic drag is the process of water being dragged across a membrane by protons [30]. Ijaodola et al. [28] used an electrophoresis method to estimate the electro- osmotic drag coefficient across a Nafion membrane. The water electro-osmotic drag coefficient within the Nafion membrane depended on the water content of the membrane and the counter-cation used [30]. The electro-osmotic drag coefficient rose with increasing temperature between 20oC and 90oC, according to Luo et al. [31].
| Definitions | References | |
|---|---|---|
| Electroosmotic drag | Water is transported from the anode to the cathode side of the membrane because of proton transport through it. | [36] |
| Thermal osmotic drag | The temperature gradient causes thermal osmosis of water flux. | [37] |
| Back diffusion | Water travels from the cathode to the anode because of the concentration gradient-driven flow. | [38] |
| Hydraulic permeation | Water is transported through the membrane because of a pressure gradient between the anode and cathode sides caused by gas or capillary pressure. | [39] |
Table 1: Mechanisms of water transport in PEMFC.
The excess water generated in the cathode region diffuses back to the anode region, resulting in back diffusion water transfer (BDWT). Water diffuses back from the cathode along with the membrane space in the fuel cell because of water concentration gradients, and examinations on BDWT from the cathode to the anode region have lately piqued interest [32]. The BDWT coefficient is determined by several parameters, including the water concentration gradient, membrane thickness, and pressure gradient through the membrane. Water’s back diffusion coefficient has also been measured in experimental tests [33]. Hydraulic permeation occurs in a PEM fuel cell because of a pressure gradient between the anode and cathode regions. The capillary pressure difference or gas phase pressure differential leads to water fluxes in the membrane [28, 34]. According to Tamayol and Bahrami [35], if the cells are pressurized independently so that the fuel gas (anode) is supplied at a lower pressure than the oxidant gas (cathode), water at the cathode can be reduced. We must consider membrane mechanical strength when pressurizing the anode and cathode regions differently.
The conductivity is very effective, significant for the proton conductivity is Nafion® water, which generates a swelling problem. Transporting water plays a key part in Nafion’s performance and durability, and the equivalent weight (EW) and the water content (λ) are two primary metrics for defining Nafion. EW is defined as dry Nafion weight per SO3- mole and is inversely related to the fixed charge density (SO3-) [36, 37, 38, 39, 40]. Depending on the production method, the EW of Nafion® is determined and has a typical value of 1100 g / mol-SO3. Nafion® absorbs more water with a lower EW and is greater than one with a higher EW proton conductivity. A is defined as the number of water molecules per SO3- and most of the Nafion® properties vary depending on the level of water. Diffusion of water molecules takes place in the chemical potential or concentration with the gradient present. By looking into the coefficient of self- distribution [41], Dslef, and thermodynamic improvement factor or Darken factor, the water diffusion coefficient can be determined:
$$ D = D s e l f \frac {\partial \ln \alpha w}{\partial I n \lambda} $$
D is chemical diffusion coefficient, which dictates the net flux of water under the concentration gradient. ð In αw / ð In λ is the Darken factor and can be evaluated from the relationship between the activity of water and the water content of Nafion® membranes or the data on the equilibrium sorption of water as a function of the activity. The Dself is associated with Nafion membranes microstructure and fluctuates according to the water content like proton conductivity, as the process of the auto-diffusion of water is identical to the proton mechanism, which moves with hydronium water molecules. Based on the approach to free volume.
$$ D s e l f = D s e l f, 0 \exp \left(\frac {- b V p}{1 - V p}\right) $$
Where Dself, 0 equal 2, 3x10⁻⁹ m2/s at 25οC39 is the pure
water self-diffusion coefficient and b is a test data fit
parameter. Although Equation 10 properly anticipated that
the Dself log was proportional to the volume fractions ratio,
V / (1-Vp), the Dself estimate was not precise. That is because
the diffusion is not the same in all the water molecules (1-V)
shown. The water molecules in a polymer matrix are strongly linked to the ionic groups when the water content of Nafion® is minimal and the mobility of these water molecules much less than the molecules of free water.
A study examines what happens when the relative moisture of the outer solvent is increased, and the range of $\mu$ is between three and five. If $\mu$ is one to two, hydrogen bonds are around 80% stronger in pure water. However, when more water is added to counter-ion clusters, hydrogen bindings are weaker as the geometry of the cluster does not allow stronger bindings to develop. This includes further growth of counter-ion clusters, whereas the overload (proton) is movable across the whole cluster, as is evidenced by the removal of hydronium bending strips and the emergence of the bending water strip in Fourier transform infrared (FT-IR) data [42]. Nafion membranes have examined the sorption of water extensively, but other membranes, unfortunately, have not been investigated so thoroughly [42]. However, similar tendencies are anticipated for Nafion in other membranes due to similarities between all membranes. The per capita number of sorbed waters is often considered in the water sorting behavior of PEMs. First, the scientists studied Nafion’s behavior for $\mu$ between one and two. It should be noted that membrane anhydrate ($\mu = 0$) is not acquainted since all water removal means a rise of membrane temperature to the point of membrane disintegration. They consider Nafion’s behavior in the range between one and two [43]. There is no typical anhydrous membrane shape ($\mu = 0$), as eliminating all the water will cause raising the membrane temperature to where the membrane will decompose. Throughout a membrane that is not in contact with any water vapor or water, liquid remains roughly one and a half water per sulphonate head. As FT-IR studies suggest, the first fluids sorbed by the membrane induce the sulfonate heads to dissociate, resulting in creating hydronium ions. Water that hydrates the membrane generates an ion counter-cluster that works as nucleation sites at sulfonate sites. With the hydrophobic character of the backbone and the hydrophilic nature of the sulfonate head, it is plausible to regard the sulfonate heads for all water molecules sorbed by the membrane. In addition, the hydronium ion is on the sulfonate heads, and the conductivity is low since insufficient water has been absorbed to form a continuous aquifer phase. The sulfonate groups separate from the size of molecules to have approximated proportions. Also, on an actual membrane, the distance between the heads of the sulfonate is less in a sulfonate, and some transfer is possible on the lower water content ($\sim 2$) [44]. If water content is one to two, hydrogen bonds are around 80% stronger in pure water. However, when more water is added to counter-ion clusters, hydrogen bindings are weaker as the geometry of the cluster does not allow stronger bindings to develop. This includes further growth of counter-ion clusters, whereas the overload (proton) is movable across the whole cluster, as is evidenced by the removal of hydronium bending strips and the emergence of the bending water strip in FT-IR data. They observed that when relative humidity is reduced from around 60% (equivalent to around five water levels per head of sulfonate), the conductivity falls by about two orders of magnitude (13%), which corresponds to about two waters per sulphonate head. For example, two orders of magnitude conductivity change in the range of 2 to 5 water per sulfonate head, while there is only one magnitude fluctuation in the water contents between 5 and 15 water per sulfonate head (responding to relative humidity in the range from 60% to 100%). The drastic change in conductivity of water content between 2 and 5 shows the importance of the conductivity of the membrane because creating a continuous phase.
Mechanism of Transport
An extra proton is often found in bulk water as one of two structures, the first being a hydronium ($H_3O^+$), a proton donor in the other three fluids that are tightly bound [45].
The hydronium’s principal hydration shell is formed by the three firmly bonded water, yielding an “Eigen” ion ($H_3O^+$) +. When the diffusion coefficients of $H_2O$ and $H_3O^+$ are the same at Standard Temperature and Pressure conditions, this phenomenon is known as vehicle diffusion, and it contributes around 22% of total conductivity [46]. Two types of domains can be identified in a hydrated acidic polymer, the most frequently used ionomer material in PEM fuel cells, 1) hydrophobic domains forming the backbone polymer, which grants morphological constancy to the membrane, and 2) hydrophilic domains allowing the conduction of proton and comprising sulfonate groups ($-SO_3H$) [47]. In addition, a transitional region between hydrophobic and hydrophilic areas has been observed because of the NafionTM side-chain architecture. NafionTM, with its swelling characteristic, is expected to confer in this region because it has been suggested that a progressive side chain with an increasing water level is developing [48]. Water content is perceived as hydration of the $SO_3$ groups and can be linked to the expansion of the nanochannels as the membrane becomes more hydrated and increasing its conductivity [49].
The sources of water in PEMFC are fuel inlet gas humidification, oxidant inlet gas humidification, and cell electrochemical reactions. Cathode gas is the same as the following equation:
$$n_{w\_an/w\_cat}^{in} = \frac{p_{sat}(T_{hum})}{p - p_{sat}(T_{hum})} n_{h_3/air}^{in}$$
As water supplied to the cells by humidifying the entry anode. The value of this is proportional, with increasing gas pressure, to the current density and stoichiometry.
The electrochemical reactions in the cell create water in proportion to the cell density per unit of time.
$$ = \lambda H _ {2} \frac {j A}{2 E} a n d n _ {a i r} ^ {i n} = \frac {\lambda_ {a i r}}{x o} $$ in in air H air jA jA n H and n F xo F
2 2 2 2 4 $$ n _ {w _ {-} p r o d} = \frac {j A}{2 F} $$
For PEM fuel cell performance, water control is highly critical. Water is driven from the anode side by electro- osmosis by diffusion in the opposite direction. Water is generated from the cathode; it leads to cathode flooding more than water transport. If anode water loss is more than water, the membrane dehydration results in considerable ohmic losses. The conductivity of the electrolyte polymer has a significant hydration and cathode flood function. The inlet fuel and air streams are commonly saturated. The water vapor increases along with the cathode because the cathode is generated it and the electric osmosis is dragged from anode to cathode. The addition of water from chemical reaction and osmosis drag causes the cathode-side to over- saturate because the inlet cathode stream is sterilized. The cathode’s water exists, leading to flooding. Then proposed that water content in the cathode intake stream be reduced to prevent this phenomenon.
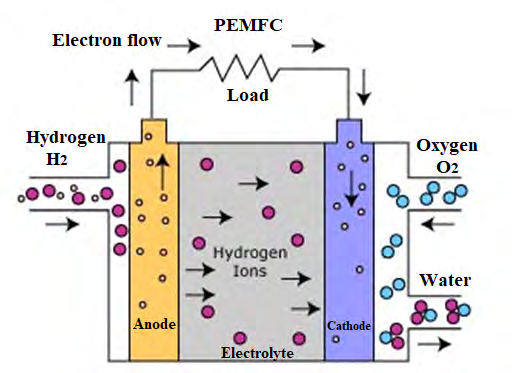
Many of the observations were made to explaining the tendency of gases to absorb water into saturation [50]. The anode gas exit was saturated except for a dry cathode anode outlet. The efficient pull did not depend on the current density considerably, and Darcy flow could describe the effect of a pressure differential across the membrane rather than the changes in the gas moisture. The moisture of the incoming gases was also very sensitive to cell efficiency [50]. Cathode-side drying events have been far more damaging to cellular performance than on the anode-side, which shows that the rise in activation losses is much higher than the increase in membrane strength. Dryness depended on the substance of the cathode electrode. In many circumstances, it has been found that it might prevent the cathode from drying by increasing the water in the anode gas, which can be effective if the refurbished gas is used for fuel. Janssen and Overvelde, [51] revealed that water management in PEMFCs needs to be contemplated when operating in stacks where circumstances are not always well controlled (Figure 1). In addition, the response to a change in water transport conditions depends on the composition of the MEA.
A theoretical seven-layer model including inputs of the anode and cathode channels, anode and cathode gases, catalyst layers, and the proton-exchange membrane 117 of the nation is proposed [52]. The results revealed that the resistance of ionic membranes declines and the voltage increases as membrane thickness lowers. Both the volume of membrane water and the probability of cathode flooding with a thin membrane rise (about 0.015 mm) [52]. The lowest membrane resistance happens with high stoichiometry hydrogen that provides a high voltage at a particular current density. The water towards the membrane/anode interface increases by using a high porosity of the gas diffusion layer (ε
1⁄4 0.4), and this prevents anode dehydration and prevents cathode electrode flooding [52]. Cathode electrode water concentration increases with increased current density. So, water vapor is a problem for the blocking gas diffusion layer and catalyst layer. It also reduces the transportation of oxygen. Therefore, the membrane may be preserved in the proper humidity and condition when relative humidity is dropped to about 80 percent. Also, The study of Rakhshanpouri & Rowshanzamir, [52] has demonstrated that water management and efficiency are adjusted with a reduction of relative cathode gas humidity to 60%, relative moisture of anode gas to 80% with hydrogen stoichiometry equal to 4, and oxygen stoichiometry equal to 6.
Reid has invented a method for measuring water transit within a PEFC in real-time [53]. For the continuous stoichiometry flow, the real-time behavior of net water drag (NWD) was investigated. NWD increased slightly at 50/0 percent RH, increased smoothly to 50/50 percent RH and increased slightly at 0/50 percent RH because of changes in PCI and high current densities of electro-osmotic drag- overloading back diffusion. The response time of NRW was also measured, and the response time of NRW to step-changes in current density was lowered substantially by ~200 seconds at 0.2 A/cm2 and by ~10 seconds at 1.4 A/cm2, particularly for RH 0/50%. As the cause for the shorter response times was the increased vapor-phase diffusion accompanied by higher electroosmotic drag at higher currents. Besides, the implements of asymmetric microporous layer (MPL) conditions on water transport to the cathode flow channels were investigated. A thicker MPL is added to the cathode, which results in a higher heat pipe efficiency and a higher PCI flow, while a thicker MPL is added to an anode, which lowers the temperature gradient across the MEA. While both asymmetric units improved the effect of NWD, the cathode effects of a thick MPL were greater than those of the thicker MPL on the anode. Based on these findings, he hypothesized the primary mechanism of water transportation in fuel cells to be diffusion through the cathode MPL layer.
We can calculate the rate at which water is created. It depends on the actual density (A/cm2) and the constant Faraday (F). The mols-1cm-2 is its unit. Current density and Faraday constants depend on water production. There is a linear link between electroosmotic drag and water production. The consequences of water affected fuel cells on membranes. Roy et al. examined the effect of its chemical structure and its composition and found that there was a strong association among different water kinds’ morphologies, constructions, and makes up. It helps to determine the connection between it and other fuel cell materials and components. External humidification devices or massive blowers are frequently required for proper water management to remove excess water that is detrimental to efficiency and increases the volume of the fuel cell system. In addition, the fuel cell’s working temperature is kept below -80 C to prevent excessive water evaporation from the membrane. One answer to this problem is to create a new proton exchange membrane that can work at a higher temperature without relying on the humidity in the surroundings to maintain proton conductivity.
It’s vital to maintain a good water balance like the polymer electrolyte is hydrated for sufficient proton conductivity while avoiding cathode flooding and anode dehydration for maximum fuel cell efficiency. Electro-osmotic drag (EOD) of water containing protons from the anode to the cathode, and diffusion because of the concentration gradient, transport water across the membrane. The oxygen reduction activity at the cathode provides an additional supply of water. Water builds up at the cathode because of both EOD and water production [54].
Many experimental data regarding water transport in proton exchange membranes (PEM), such as Janssen’s net drag coefficients, have been published in the literature. The humidity of the inlet gas was limited to a dry or wet condition, although their research was focused on the influence of humidity. Ren et al. published water electro- osmotic drag measurements for a PEM in a direct methanol fuel cell (DMFC) [55]. The studies were carried out on the assumption that the electro-osmotic drag was the sole source of water flux over the membrane. In co-flow settings, with a single Serpentine flow channel, Dong et al [27]. Presented current differentiation, distribution of species, and high- frequency resistance data. Experimental data suggest that anode moisturization was an essential aspect for achieving excellent performance in the incoming region rather than the cathode. In the co-flow setup, Nguyen created a combined heat and mass transmission model, provided that all water is in the vapor phase in the electrodes. Janssen introduced a two-phase, two-dimensional model along the channel. The model explains the transporting water into electrodes under saturated and unsaturated gas conditions using the theory of concentrated solution in all places with the assumption of a uniform current density. In PEMFC, liquid water appears in the cathode during operation with unsaturated reactor gas specific at low stoichiometric flow rates. The two-phase flow and transport of the PEMFC air cathode were modeled by You and Liu, [56] and the capillary action was established within the two-phase zone. The distribution of current MEA and GDL density and temperature and the distribution of the GDL and GDL gas species at a cross-section of GDL and flow channel at an increased power density were recently developed in three-dimensional models.
PEMs are of primary importance and play an essential role in improving performance and durability to reducing costs compared to other components in the MEA. PEMs should be highly conductive on both sides of the anode and the cathode. In contrast, the gaseous reactants should not be transmitted to the other side, nor should they allow electrons to flow. Furthermore, large gaseous reactants pass on the contrary, nor can electrons pass during the functioning of fuel cells [57]. The action of free radicals on the polymeric membrane structures leads to chemical breakdown and pinhole production. The crossing of the cathode-side hydrogen, the anode-side oxygen, and an incomplete reduction in oxygen produced the radicals. In addition, mechanical forces may crash the PEMs down, such as fatigue and assembly stresses. PFSA membranes like Nafion are widely used for electrochemical devices, including PEFCs [58]. Currently, PFSA membranes are utilized for electric energy devices. However, prohibitive costs and long-term problems prevented PEFCs from competitively penetrating the market. Alternative PEMs are attempted to comply with as much as possible the above parameters and it may be stated that hydrocarbon-based PEMs (SPEEK) have shown promising properties for the prolonged PEFC operation, e.g., Sulfonated Polyetherketone Membranes. The number of PEEK units having a sulfonic acid set linked to them is indicated. In addition, alternative procedures such as thermal linkage and nanocomposite membranes can be taken to further enhance SPEEK membranes’ overall stability. Automated moisturizing proton interchangeable membranes have been introduced in PEMs, coupled with various hydration and proton conductivity additives, are equipped with Pt nanoparticles as catalytic sites for internal water generation. Thus, external moisturizers were no longer needed in these situations. This strategy not only decreases PEFCs’ costs and complexity but also improves the power density, as the water removal of Toyota MIRAI’s fuel cell has reduced weight and volume by 13 kg and 15 L, respectively.
Membrane Water Transport with Sorption/ Desorption
Water transport is of the utmost importance in proton- conductive membranes since water is primarily responsible for transporting charges throughout the membrane. Thus, the permeability and diffusiveness of the membrane to the water molecules are characteristics well researched [59]. A membrane water permeation process may be expressed in three separate stages: (1) water sorption on the sorption side into the membrane; (2) water diffusion across the membrane; and (3) water desorption from the membrane on the dry side [60]. The sorption and desorption steps are interfacial barriers to the movement of masses, and many authors have been researched Zhao et al [61]. They have claimed that the surface of the membrane is hydrophobic to water vapor and hydrophilic to water because of their permeation investigations. Small-angle X-ray scattering tests were shown that structural changes in the membrane’s interface depending on the media in contact with Karlsen et al [62] were substantiated. Majsztrik et al [60] reported that water desorption at the membrane/gas interface was the limiting rate in penetration experiments. Different approaches are employed to evaluate water permeability and water diversity via a membrane. Water permeability is usually assessed by a simple permeation test, in which the membrane separates two water-filled chambers and applies a total pressure differential. The volume change is monitored with a capillary and is related to membrane permeability in the lower pressure chamber [63].
In the operation of polymer electrolyte membranes (PEM) fuel cells, water sorption and transport in polymer membranes play a crucial part. The water sorption and diffusion in the membrane control the fuel cell distribution of water and affect the local conductivity of the protons. The most frequent polymer membrane material in PEM fuel cells is Nafion [63].
Three fundamental approaches were used to measure water sorption and transport. The first method is mass absorption or loss, provided Fickian diffusion controls the water absorption, sorption diffusivity of the product, the rate constant, and the square of the characteristic dimension of the polymer regulated desorption [60]. Measurements for the water uptake provide average values ~10-8 cm2/s to the lowest diffusion coefficients. Measurements of water desorption provide ~10-7 cm2/s of intermediate diffusion coefficients. Second, relief NMR. The pulsed gradient NMR experiment relaxation times may calculate the Nafion water self-diffusing coefficient. The NMR measurements of self- diffusion reveal the maximum diffusiveness values of about ~10-6 cm2/s. Third, experimental permitting. The continuous water permeation through membranes is measured according to the chemical activity throughout the membrane. Permeation measurements suggest the diffusiveness of 10-7 cm2/s little lower than NMR. Interfacial mass transportation, diffusion, and polymer swelling are involved in sorption and penetration. All affect the speeds of transport and reaction process in Nafion, including temperature, membrane thickness, and water and vapor.
Alves-Lima et al [64] examined the feasibility to quantify and picture liquid water content through Nafion PE MPs using a portable, comparatively inexpensive terahertz imaging system. In the 25-500 μm thickness range, the technique has been sensitive to quantify fluid water, with insensitivity of under 25 μm in thickets. Assuming that the thickness of the membrane may be used as the thickness of the water, we have calculated the loss of water with terahertz measurements to monitor the weight change simultaneously. The results are compatible with the gravimetric analysis and earlier research despite differences from the measuring panel in the residual surface water and liquid water. Finally, during a desorption process, which would not be achievable using gravimetric techniques otherwise, they showed the imagery of water spatial distribution and motion through a partially hydrated membrane of Nafion N-117. While the Nafion production sector is trending towards thinner membranes for commercial high-performance PEMFC applications (< 25~15 μm) because of decreased proton strength and better fuel cell performance, the proposed system is appropriate for thicker (50–254 μm) membranes.
Models of sorption seek to characterize membrane characteristics in balance with a nearby fluid. The models show how protons and water are conveyed and how they interact through the polymer matrix [65]. The unit-less amount λH2O, which is defined as water molecules per acid site in the polymer and depends on the water activity in a vapor phase near the membrane is appropriate for the concentration [66]. An entire model must explain the water sorption during a fuel cell operation in an adjacent liquid phase because liquid water is forming in the cathode. Sorption from a completely saturated steam phase and a fluid phase should theoretically be equal to the activity of water in both phases. But experimental evidence shows that the membrane water concentration for balance with a liquid stage is substantially higher [67]. The paradox of Schröder is this discrepancy. It is under question whether the continuous Schröder paradox exists because later studies confirm its absence. It could be observed if it cannot exist if the contact with water vapor at 100% relative humidity has been monitored in a non-equilibrium state [68].
Conclusion
Electroosmotic drag has several industrial uses, including chlorine generation, NaOH and other bases, and inorganic acids. The membrane can be dried too little by water and hence reduces conductivity and cell performance. There can be too much water in the membrane and cathode inundations. Water is also carried through the membrane besides generating water at the cathode catalyst layer due to the electrochemical reaction. It is vital to quantify electroosmotic drag for optimizing water concentration in a fuel-cell membrane.
Water management is becoming one of the key concerns for PEMFC marketing. A successful grasp of water transportation in various PEMFC components is required for good water management. The hydration of the membrane and the avoidance of cathode from flooding is a sensitive balance. Flooding of cathode happens when the produced water exceeds the rate of water removal. Cathode flood inhibits the transfer of oxygen to the reaction locations and diminishes the effective catalyst area. Water that develops on a cathode fuel cell reduces performance and impedes efficient functioning; therefore, water management is one of the most crucial features of a PEMFC.
References
-
van Biert L, Godjevac M, Visser K, Aravind PV (2016) A Review of Fuel Cell Systems for Maritime Applications. Journal of Power Sources 327: 345-364.
-
Liu B, Pouramini S (2021) Multi-Objective Optimization for Thermal Comfort Enhancement and Greenhouse Gas Emission Reduction in Residential Buildings Applying Retrofitting Measures by an Enhanced Water Strider Optimization Algorithm: A Case Study. Energy Reports 7: 1915-1929.
-
Singh R, Oberoi AS, Singh T (2021) Factors Influencing the Performance of PEM Fuel Cells: A Review on Performance Parameters, Water Management, and Cooling Techniques. Int J Energy Res.
-
Xu Y, Fan R, Chang G, Xu S, Cai T (2021) Investigating Temperature-Driven Water Transport in Cathode Gas Diffusion Media of PEMFC With a Non-Isothermal, Two- Phase Model. Energy Convers and Manag 248: 114791.
-
Magnico P (2013) Influence of the Ion–Solvent Interactions on Ionic Transport through Ion-Exchange- Membranes. J Memb Sci 442: 272-285.
-
Liso V, Araya SS, Olesen AC, Nielsen MP, Kær SK (2016) Modeling and Experimental Validation of Water Mass Balance in A PEM Fuel Cell Stack. Int J Hydrogen Energy 41(4): 3079-3092.
-
Dekel DR, Rasin IG, Page M, Brandon S (2018) Steady State and Transient Simulation of Anion Exchange Membrane Fuel Cells. J Power Sources 375: 191-204.
-
Zawodzinski TA, Davey J, Valerio J, Gottesfeld S (1995) The water content dependence of electro-osmotic drag in proton-conducting polymer electrolytes. Electrochimica Acta 40(3): 297-302.
-
Berning T, Odgaard M, Kær SK (2011) Water Balance Simulations of a Polymer-Electrolyte Membrane Fuel Cell Using a Two-Fluid Model. J Power Sources 196(15): 6305-6317.
-
Wu Z, Li D (2008) Mixing and Flow Regulating by Induced-Charge Electrokinetic Flow in a Microchannel with a Pair of Conducting Triangle Hurdles. Microfluidics and Nanofluidics 5: 65-76.
-
Mu YT, Weber AZ, Gu ZL, Schuler T, Tao WQ (2020) Mesoscopic analyses of the impact of morphology and operating conditions on the transport resistances in a proton-exchange-membrane fuel-cell catalyst layer. Sustain Energy Fuels 4(7): 3623-3639.
-
Wang J, Ma J, Liu F, Mi W, Cai Y, et al.(2016) Experimental Study on the Improvement of Marine Clay Slurry by Electroosmosis-Vacuum Preloading. Geotextiles and Geomembranes 44(4): 615-622.
-
Zhang F, Li D (2013) Induced-Charge Electroosmotic Flow around Dielectric Particles in Uniform Electric Field. J Colloid Interface Sci 410: 102-110.
-
Porsev EG, Malozyomov BV (2018) Synthesis of Advanced Electrokinetic Technologies in Agroecosystems. In Proceedings of the International Conference” Actual Issues of Mechanical Engineering”(AIME 2018). Atlantis Press pp: 504-508.
-
Ghosal S (2006) Electrokinetic Flow and Dispersion in Capillary Electrophoresis. Annu Rev Fluid Mech 38: 309- 338.
-
Iverson BD, Garimella SV (2008) Recent Advances in Microscale Pumping Technologies: A Review and Evaluation. Microfluid Nanofluidics 5: 145-174.
-
Probstein RF (2005) Physicochemical hydrodynamics: an introduction; John Wiley & Sons, ISBN 0471725129.
-
Catalano J, Biesheuvel PM (2018) AC-Driven Electro- Osmotic Flow in Charged Nanopores. EPL Europhysics Lett 123: 5.
-
Alrifaiy A, Lindahl OA, Ramser K (2012) Polymer-Based Microfluidic Devices for Pharmacy, Biology and Tissue Engineering. Polymers 4(3): 1349-1398.
-
Fiorini GS, Chiu DT (2005) Disposable microfluidic devices: fabrication, function, and application. Biotechniques 38(3): 429-446.
-
Pan M, Pan C, Li C, Zhao J (2021) A Review of Membranes in Proton Exchange Membrane Fuel Cells: Transport Phenomena, Performance and Durability. Renew Sustain Energy Rev 141: 110771.
-
Palanisamy G, Jung HY, Sadhasivam T, Kurkuri MD, Kim SC, et al. (2019) A Comprehensive Review on Microbial Fuel Cell Technologies: Processes, Utilization, and Advanced Developments in Electrodes and Membranes. J Clean Prod 221: 598-621.
-
Kocherginsky N (2009) Acidic Lipids, H+-Atpases, and Mechanism of Oxidative Phosphorylation. Physico- Chemical Ideas 30 Years after P. Mitchell’s Nobel Prize Award. Prog Biophys Mol Biol 99(1): 20-41.
-
Sharma S (2019) Membranes in Single-Cell Proton Exchange Membrane Fuel Cells and Stacks. In Membranes for Low Temperature Fuel Cells. De Gruyter pp: 79-126.
-
Xing L, Du S, Chen R, Mamlouk M, Scott K (2016) Anode Partial Flooding Modelling of Proton Exchange Membrane Fuel Cells: Model Development and Validation. Energy 96: 80-95.
-
Jeon DH (2019) Effect of Channel-Rib Width on Water Transport Behavior in Gas Diffusion Layer of Polymer Electrolyte Membrane Fuel Cells. J Power Sources 423: 280-289.
-
Maiyelvaganan KR, Kamalakannan S, Shanmugan S, Prakash M, Coudert FX, Hochlaf M (2022) Identification of a Grotthuss proton hopping mechanism at protonated polyhedral oligomeric silsesquioxane (POSS)–water interface. Journal of Colloid and Interface Science 1;605:701-709.
-
Ijaodola OS, El Hassan Z, Ogungbemi E, Khatib FN, Wilberforce T, et al. (2019) Energy Efficiency Improvements by Investigating the Water Flooding Management on Proton Exchange Membrane Fuel Cell (PEMFC). Energy 179: 246-267.
-
Zhou S, Dhupia JS (2020) Online Adaptive Water Management Fault Diagnosis of PEMFC Based on Orthogonal Linear Discriminant Analysis and Relevance Vector Machine. Int J Hydrogen Energy 45: 7005-7014.
-
Xu F, Leclerc S, Stemmelen D, Perrin JC, Retournard A, et al. (2017) Study of Electro-Osmotic Drag Coefficients in Nafion Membrane in Acid, Sodium and Potassium Forms by Electrophoresis NMR. J Memb Sci 536: 116-122.
-
Luo Z, Chang Z, Zhang Y, Liu Z, Li J (2010) Electro- Osmotic Drag Coefficient and Proton Conductivity in Nafion® Membrane for PEMFC. Int J Hydrogen Energy 35(7): 3120-3124.
-
Petrov MM, Modestov AD, Konev DV, Antipov AE, Loktionov PA, et al. (2021) Redox Flow Batteries: Role in Modern Electric Power Industry and Comparative Characteristics of the Main Types. Russ Chem Rev 90(6): 677-702.
-
Mohanty F, Rup S, Dash B, Majhi B, Swamy MNS (2008) Digital Mammogram Classification Using 2D-BDWT and GLCM Features with FOA-Based Feature Selection Approach. Neural Comput Appl 32: 7029-7043.
-
Husar A, Higier A, Liu H (2008) In Situ Measurements of Water Transfer Due To Different Mechanisms in a Proton Exchange Membrane Fuel Cell. J Power Sources 183(1): 240-246.
-
Tamayol A, Bahrami M (2011) Water Permeation through Gas Diffusion Layers of Proton Exchange Membrane Fuel Cells. J Power Sources 196(15): 6356-6361.
-
Wiley D, Fimbres WG (2016) Electroosmotic Drag in Membranes. In: Drioli E, Giorno L. (eds) Encyclopedia of Membranes. Springer, Berlin, Heidelberg pp: 653-654.
-
Dai W, Wang H, Yuan XZ, Martin JJ, Yang D, et al. (2009) A Review on Water Balance in the Membrane Electrode Assembly of Proton Exchange Membrane Fuel Cells. Int J Hydrogen Energy 34: 9461-9478.
-
Uddin KMS, Saha LK, Oshima N (2014) Water Transport through the Membrane of PEM Fuel Cell. Am J Comput Appl Math 4(6): 225-238.
-
Kleinhans KL, Jackson AR (2018) Hydraulic Permeability of Meniscus Fibrocartilage Measured Via Direct Permeation: Effects of Tissue Anisotropy, Water Volume Content, and Compressive Strain. J Biomech 72: 215-221.
-
Karimi MB, Mohammadi F, Hooshyari K (2019) Recent Approaches to Improve Nafion Performance for Fuel Cell Applications: A Review. Int J Hydrogen Energy 44(54): 28919-28938.
-
Rosenberger D, Lubbers N, Germann TC (2020) Evaluating Diffusion and the Thermodynamic Factor for Binary Ionic Mixtures. Phys Plasmas 27: 102705.
-
Duan Q, Wang H, Benziger J (2012) Transport of Liquid Water through Nafion Membranes. J Memb Sci 392: 88- 94.
-
Liu DS (2014) Controlling the Mechanical and Transport Properties of Layer-By-Layer Films and Electrospun Mat Composite Membranes for Fuel Cell Applications.
-
Knox CK, Voth GA (2010) Probing Selected Morphological Models of Hydrated Nafion Using Large-Scale Molecular Dynamics Simulations. J Phys Chem B 114(9): 3205- 3218.
-
Lockwood GK, Garofalini SH (2014) Proton Dynamics at the Water–Silica Interface via Dissociative Molecular Dynamics. J Phys Chem C 118(51): 29750-29759.
-
Choe YK, Tsuchida E, Ikeshoji T, Yamakawa S, Hyodo S (2009) Nature of Proton Dynamics in a Polymer Electrolyte Membrane, Nafion: A First-Principles Molecular Dynamics Study. Phys Chem Chem Phys 11(20): 3892-3899.
-
Edmondson CA, Fontanella JJ (2002) Free Volume and Percolation in S-SEBS and Fluorocarbon Proton Conducting Membranes. Solid State Ionics 152: 355-361.
-
Maciak E (2019) Low-Coherence Interferometric Fiber Optic Sensor for Humidity Monitoring Based on Nafion® Thin Film. Sensors 19(3): 629.
-
Kreuer KD, Paddison SJ, Spohr E, Schuster M (2004) Transport in Proton Conductors for Fuel-Cell Applications: Simulations, Elementary Reactions, and Phenomenology. Chem Rev 104(10): 4637-4678.
-
Fathi H, Raoof A, Mansouri SH (2017) Insights into the Role of Wettability in Cathode Catalyst Layer of Proton Exchange Membrane Fuel Cell; Pore Scale Immiscible Flow and Transport Processes. J Power Sources 349: 57- 67.
-
Janssen GJM, Overvelde MLJ (2001) Water Transport in the Proton-Exchange-Membrane Fuel Cell: Measurements of the Effective Drag Coefficient. J Power Sources 101(1): 117-125.
-
Rakhshanpouri S, Rowshanzamir S (2013) Water Transport through a PEM (Proton Exchange Membrane) Fuel Cell in a Seven-Layer Model. Energy 50(1): 220-231.
-
Reid SK (2013) Water Transport in Polymer Electrolyte Fuel Cells: An Exploration of Net Water Drag in Real Time.
-
Jiao K, Li X (2011) Water Transport in Polymer Electrolyte Membrane Fuel Cells. Prog energy Combust Sci 37(3): 221-291.
-
Ito H, Ishikawa T, Ishida M, Someya S, Munakata T (2019) Measurement of Net Water Drag Coefficients in Polymer Electrolyte Fuel Cells under Cathode-Dry Conditions. J Electrochem Soc 166: 1117-1127.
-
You L, Liu H (2006) A Two-Phase Flow and Transport Model for PEM Fuel Cells. J Power Sources 155(2): 219- 230.
-
Sorrentino A, Sundmacher K, Vidakovic Koch T (2020) Polymer Electrolyte Fuel Cell Degradation Mechanisms and their Diagnosis by Frequency Response Analysis Methods: A Review. Energies 13(21): 5825.
-
Kinumoto T, Inaba M, Nakayama Y, Ogata, K, Umebayashi R, et al. (2006) Durability of Perfluorinated Ionomer Membrane Against Hydrogen Peroxide. J Power Sources 158(2): 1222-1228.
-
Chabi S, Papadantonakis KM, Lewis NS, Freund MS (2017) Membranes for Artificial Photosynthesis. Energy Environ Sci 10(6): 1320-1338.
-
Majsztrik PW, Satterfield MB, Bocarsly AB, Benziger JB (2007) Water Sorption, Desorption and Transport in Nafion Membranes. J Memb Sci 301(1): 93-106.
-
Zhao Q, Majsztrik P, Benziger J (2011) Diffusion and Interfacial Transport of Water in Nafion. J Phys Chem B 115(12): 2717-2727.
-
Karlsen ML, Thorsen TS, Johner N, Ammendrup Johnsen I, Erlendsson S, et al. (2015) Structure Of Dimeric and Tetrameric Complexes of the BAR Domain Protein PICK1 Determined by Small-Angle X-Ray Scattering. Structure 23(7): 1258-1270.
-
Park JW, Wycisk R, Lin G, Chong PY, Powers D, et al. (2017) Electrospun Nafion/PVDF Single-Fiber Blended Membranes for Regenerative H2/Br2 Fuel Cells. J Memb Sci 541: 85-92.
-
Alves Lima DF, Schlegl H, Williams BM, Letizia R, Dawson R, et al. (2020) Observing Liquid Water Build-Up in Proton Exchange Membrane Fuel Cells Using Terahertz Imaging and High-Resolution Optical Gauging. In Proceedings of the 2020 45th International Conference on Infrared, Millimeter, and Terahertz Waves (IRMMW- Thz). USA.
-
Pikalova EY, Kalinina EG (2019) Electrophoretic Deposition in the Solid Oxide Fuel Cell Technology: Fundamentals and Recent Advances. Renew Sustain Energy Rev 116: 1-23.
-
Futter G (2019) Physical Modeling of PEMFC Performance and Chemical Membrane Degradation. 2019.
-
Yang F, Lyu B, Xu S (2021) Water Sorption and Transport in Shales: An Experimental and Simulation Study. Water Resour Res pp: 57.
-
Jahnke T, Futter G, Latz A, Malkow T, Papakonstantinou G, et al. (2016) Performance and Degradation of Proton Exchange Membrane Fuel Cells: State of the Art in Modeling From Atomistic to System Scale. J Power Sources 304: 207-233.
- Contribution of 18FDG PET in Atypical HORTON Disease
- Living Conditions, Healthy Practice and State of Households of a Town Rural in Colombia
- Background to the Health and Safety Regulation at Work in Colombia
- Risk Factors Psychology Workers Sena (Center for the Petrochemical Industry) Regional Bolívar, Colombia
- Diffuse Intense Pleural FDG Uptake with Smooth Thickening: A MARKER of Tuberculosis in Isolated Pleural Effusion
- Hypermetabolic Splenomegaly with Infarct in FDG PET/CT: A Clue to Scrub Typhus in PUO