Correlation between the Flooding of the River and the Quality of the Agriculture Soil
Land as the main edaphic factor, plays a very important role in the production of various field crops, fruit and vine crops. Its role is reflected in the fertility and productivity. Soil fertility includes content available nutrients, such as individual elements, pH and humus. The study of soil quality leads to conclusions about what the land is suitable for cultivation of what kind of culture. This paper presents the results of investigation of changes in soil quality in the South Morava river valley, in correlation with the floods. Different results of pH, humus, nitrogen, phosphorus and potassium, are obtained in the function of time, within the research conducted. Experiment was implemented two years ago, immediately after the flood and six months after the floods, which occurred in May 2014 in the region South Serbia. The methods that were used for the analysis of the soil are: colorimetric, photometric, potentiometric and spectrophotometry. Results show a high degree of sustainability of quality of land intended for the cultivation of field crops. The conclusion is that the soil relatively quickly regenerates their properties after floods.
Jelena Markovic1* and Svetlana Stevovic2
Keywords: Correlation; Soil; Flooding; Quality; Humus
Introduction
The land is diverse and represented smonitza, forest soil, podzol, and there are traces of mountain black soil. The plot is loose surface layer of the earth’s crust formed as a product of the geological substrate and the participation of climatic factors (especially temperature, water, air movement and gravity) and living beings (particularly important as plant organisms and microorganisms) Nikolic V, et al. [1]. The land is an integral part of the ecosystem and is situated between the Earth’s surface and the wall. It is divided into horizontal layers and different in their chemical, physical and biological characteristics. Quality land has approximately 50% solids and 45% to 5% of mineral and organic substances, and 25% containing water and air Altieri, et al. [2]. Composition of land directly affects the anatomical structure of plants and their characteristics Stevovic S, et al. [3], Stevovic S, et al. [4]. Depending on the amount of chemical elements present N (nitrogen), P (phosphorus) K (potassium), of humus and pH value depends on the quality of soil. Soil quality is reflected in its fertility, and thus the yield of the plants that grow on the same land, Stevovic S, et al. [5]. If the soil is rich in nitrogen, then the plant will have a normal flowering, better fruiting and reduced yellowing leaves Altieri, et al. [2]. In order to process the construction of nucleic acids, nucleoproteins and phytate performed properly, the land is required to be rich in phosphorus. However soil is generally low in phosphorus and subsequently carries phosphorous fertilizers [2]. To make the plants resist on steres and diseases it is necessary that the land is rich in potassium. Potassium is the essential for cell growth and division in plants Stevovic S, et al. [5]. The lack of potassium in the soil causes a disruption in water balance, dry tops or curling of leaves and root rot. Successive changes, such as deficiencies of nutrients in the soil create problems. Sustainable agricultural intensification is defined as producing more output from the same area of land while reducing the negative environmental impacts and at the same time increasing contributions to natural capital and the flow of environmental services [6].
The increased amount of moisture in the soil also affects the poor quality of the soil. Flooding can have a very negative effect on land Stevovic I, et al. [7], these effects can be: sludge sedimentation, erosion of agricultural land, loss of nutrients in the soil, which affect fertility. This paper will discuss the sustainability of soil quality in the period before, immediately after the flood, and six months after the floods. This implies that take into account the influence of environmental factors, which comprise the complex factors influencing the land Krnacova, et al. [8].
Crop production includes production of all major field crops: wheat, corn, soybean, sunflower, rapeseed and sugar beet with the use of agro-technical measures and the use of latest machinery in agricultural production, with optimal use of chemical protection and respecting the agro deadlines Stevovic S, et al. [9]. The cultivation of crops, except for the application of agro-technical measures and soil quality, plays a big role on were as climatic factors.
Materials and Methods
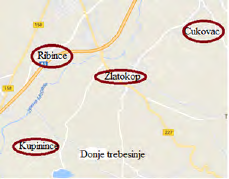
For this work samples of soils, were taken from the grounds of the villages located next to the South Morava river valley. These are the villages Cukovac, Zlatokop, Ribnice and Kupinince (Figure 1).
We examined the quality of the soil on which crops are sown in the period before during and after the flood to. Tests the change of the quality of the soils. Type of soil that has been tested is vertisol and sandy soil. Resin is black, clayey soil rich in humus and belong to our fertile soil. The composition and quality of the soil impacts the yield of grown crops. Soil samples that were used for the analysis were tested in the laboratory of Agricultural advisory and extension services in Vranje.
Soil samples were taken from smaller parcels. Soil samples were taken from a depth of 15 cm. Time sampling was after cereal and corn harvest. Colorimetric method is based on the fact that some of the elements in this case K and P, when dissolved in a particular solvent, give characteristically colored solutions, or the colouration arises as a result of the reaction of the given substance and the corresponding reagent. The intensity of the resulting coloration depends on the concentration of the test substance in the solution. By measuring the intensity of the coloring, the concentration of the test element in the solution can be quantitatively determined. The task of calibration is to determine how much the content analyzed of nutrients is significant for the grown crops, as well as the significance of other properties of the soil, to what extent the availability of nutrients is important for cultivated crops. Calibration should show where are the boundaries of weakness and good level of supply of some soil with phosphorus, potassium and other nutrients, (Kovacevic, 2003.). The percentage of humus content in the soil is determined by the formula:
C A 100 72,1 514 ,0 ⋅ ⋅ ⋅ [1]
Humus (%) =
Where A –is the amount of 0.1n KMnO4 spent on carbon oxidation in humus cm³; 1.72 - coefficient for translating carbon into humus because it has been experimentally found that the content of carbon in humus is 58% (100: 58 = 1.724); 0.514 - coefficient indicating that each cm³ of 0,1n KMnO4 oxidizes 0,514 g of carbon into CO2; 100 - Coefficient for calculation of percentages; C - Is the mass of the air of dry soil taken for analysis.
Nitrogen (%) = 0,05 •humus [2]
Results of testing various samples of the soil are analyzed in the period from July 2013 to October 2014. The results are presented in tables 1.
Results and Discussion
The results obtained in this study indicate different soil quality. Table 1 shows the results of the quality of the land on which crops are sown in the period of 2012. The aim was to show the content of nitrogen, phosphorus, potassium and humus in the soil and what the pH value of such land is after harvest.
- Soil sample
- Soil type pH
- Humus, %
- N,
- P,
- K,
- %
- %
- %
- Cukovac
- 1
- Vertisol
- 5.43
- 3.58
- 0.2
- 10.21
- 34
- 2
- Vertisol
- 6.02
- 2.74
- 0.17
- 15.17
- 11.22
- 3 sandy soil
- 5.78
- 3.14
- 0.19
- 12.78
- 31.23
- 4 sandy soil
- 6.42
- 5.28
- 0.23
- >40
- 21.14
- Zlatokop
- 5
- Vertisol
- 5.71
- 9.14
- 0.42
- >40
- 18.79
- 6
- Vertisol
- 5.31
- 2.45
- 0.13
- 20.15
- >40
- 7 sandy soil
- 4.78
- 4.85
- 0.28
- 37.76
- 15.22
- 8 sandy soil
- 4.79
- 3.78
- 0.25
- 17.87
- 22.13
- Ribince
- 9
- Vertisol
- 5.56
- 8.24
- 0.39
- 36.18
- 35.41
- 10
- Vertisol
- 5.06
- 5.15
- 0.24
- 19.21
- 24.31
- 11 sandy soil
- 4.49
- 3.78
- 0.18
- 9.48
- 32.41
- 12 sandy soil
- 5.15
- 2.4
- 0.12
- 16.26
- 10.86
- Kupinince
- 13
- Vertisol
- 5.09
- 3.34
- 0.14
- 15,24
- 18.64
- 14
- Vertisol
- 6.75
- 9.17
- 0.46
- >40
- 36.52
- 15 sandy soil
- 5.45
- 3.51
- 0.17
- 16.92
- 33.12
- 16 sandy soil
- 4.76
- 4.15
- 0.29
- 21.05
- 14.73
Table 1: The content of various parameters in the examined samples countries (K, P, humus, N and pH in %), Source: Author’s
In soil samples in which K, P, Humus, N and pH were tested before flooding, it is evident that the soil is mostly acidic because the pH is in the range of 4.48-6.42, except in the sample 14 where the pH is 6. 75 and that sample the soil have a neutral reaction. Before the flood, the soil was rich in nitrogen. The percentage of nitrogen was in the range of 0.12 in the Ribnice location in the sample of 12 types of soil sandwiches, up to 0.46 in the sample number 14 at the site Kupinince type on vertisol. Percentage K varied in the range of 10.86 in the Ribnice location in the sample number 12 on the sandy soil to up to 40 in the sample number 6 at the Zlatokop site on the same type of soil. Regarding P, its value was from 9.48 in sample number 11 at the Ribnice location on sandy soil, and up to 40% at the location Cukovac in sample number 4 of the same type of soil, in sample number 5 at Zlatokop and Kupinince in the sample number 14 on the vertisol. Based on the obtained results for the values of K and P, it can be said that the soil is mostly of high quality phosphorus and potassium. The percentage of humus in the samples was the smallest at Zlatokop site in sample number 6 and amounted to 2.45, while the highest percentage of humus was at Kupinince site in sample number 14 9.17, in both samples on vertisol.
Table 2 shows the results from the same land parcel located in the valley of the South Morava River, but immediately after the flood. That lasted 15 days, in May 2014. After the flood, it took a long time for land to dry out. The obtained results show a large deviation in terms of soil quality. From the results obtained, Table 2 (before floods) shows a lower level of nitrogen in soil samples at Ribnice 0.12 for the sandy soil, at the site Kupinince 0.14 for the type of sand, at the site Cukovac 0.17 for the type of sandblast and ice cream and at Zlatokop, the percentage of nitrogen is 0.13, which is the case with the type of resin. It can be noticed that for the type of soil, the percentage of nitrogen is l (Table 2).
| Soil sample | Soil type | pH | Humus, % | N, % | P, % | K, % |
|---|---|---|---|---|---|---|
| Cukovac | ||||||
| 1 | Vertisol | 5.18 | 2.85 | 0.19 | 9.49 | 21.75 |
| 2 | Vertisol | 4.86 | 3.42 | 0.16 | 11.73 | 10.11 |
| 3 | sandy soil | 5.3 | 2.93 | 0.14 | 19.68 | >40 |
| 4 | sandy soil | 6.04 | 5.12 | 0.18 | >40 | 19.79 |
| Zlatokop | ||||||
| 5 | Vertisol | 5.36 | 8.89 | 0.3 | 38.14 | 15.14 |
| 6 | Vertisol | 5.27 | 2.41 | 0.11 | 19.74 | >40 |
| 7 | sandy soil | 4.18 | 4.68 | 0.21 | 34.47 | 14.87 |
| 8 | sandy soil | 4.63 | 3.74 | 0.22 | 17 | 21.74 |
| Ribince | ||||||
| 9 | Vertisol | 5.43 | 8.03 | 0.32 | 30.17 | 30.79 |
| 10 | Vertisol | 5.04 | 5.02 | 0.17 | 19.03 | 23.16 |
| 11 | sandy soil | 4.43 | 3.76 | 0.18 | 12.1 | 30.91 |
| 12 | sandy soil | 5.13 | 2.41 | 0.11 | 16.02 | 11.32 |
| Kupinince | ||||||
| 3 | Vertisol | 5.67 | 3.32 | 0.13 | 15.43 | 18.01 |
| 14 | Vertisol | 6.64 | 9.07 | 0.41 | >40 | >40 |
| 15 | sandy soil | 5.38 | 3.51 | 0.16 | 16.54 | 32.18 |
| 16 | sandy soil | 4.69 | 3.84 | 0.12 | 14.78 | 9.97 |
Table 2: The content of various parameters in the examined samples of the country immediately after the flood, Source: Author’s c
If we compare the results from Tables 1 and 2 it can be seen that there are no major changes before and immediately after the flood. This means that the land retains its own quality.
| Soil sample | Soil type | pH | Humus, % | N, % | P, % | K, % | |
|---|---|---|---|---|---|---|---|
| Cukovac | |||||||
| 1 | Vertisol | 6 | 3.61 | 0.18 | 10.9 | 32 | |
| 2 | Vertisol | 5.78 | 2.62 | 0.13 | 19.18 | 13.33 | |
| 3 | sandy soil | 6.05 | 2.54 | 0.13 | 18.94 | 29.87 | |
| 4 | sandy soil | 5.82 | 2.16 | 0.11 | 37.97 | 18.54 | |
| Zlatokop | |||||||
| 5 | Vertisol | 4.82 | 3.83 | 0.19 | 30.28 | 17.94 | |
| 6 | Vertisol | 5.18 | 2.31 | 0.12 | 18.37 | 38.49 | |
| 7 | andy soil | 5.48 | 3.35 | 0.17 | 30.12 | 10.91 | |
| 8 | sandy soil | 6.42 | 5.35 | 0.27 | 25.87 | 20.83 | |
| Ribince | |||||||
| 9 | Vertisol | 7.5 | 6.43 | 0.32 | 38.54 | >40 | |
| 10 | Vertisol | 4.92 | 3.01 | 0.15 | 16.86 | 17.84 | |
| 11 | sandy soil | 6.41 | 4.61 | 0.23 | 15.96 | 37.42 | |
| 12 | sandy soil | 6.99 | 6.02 | 0.3 | 23.12 | >40 | |
| Kupinince | |||||||
| 13 | Vertisol | 4.49 | 7.53 | 0.38 | 12.59 | 10.71 | |
| 14 | Vertisol | 4.89 | 3.69 | 0.18 | 35.41 | 34.26 | |
| 15 | sandy soil | 4.67 | 4.24 | 0.21 | 20.15 | 28.77 | |
| 16 | sandy soil | 5.58 | 3.27 | 0.16 | 18.43 | 21.67 | |
Table 3: The content of various parameters in the examined samples of agricultural crops in the country between October of 2014,
After a certain period, the land, which was flooded, was treated with fertilizers means and the results obtained in Table 3 show the quality of the soil after the application of fertilizers. The Malawi fertilizer subsidy program is a rare example of that has led to substantial changes in farm use of fertilizers and the rapid shift of the soil from food deficit to food exporter Dorward A, et al. [10].
Based on the results obtained at three periods of observation it can be said that there is a relatively high level of sustainability parameters of soil chemical quality in the South Morava valley, due to the flood occurred in May 2014. Examined soils in the valley of the South Morava River are characterized by a slightly weaker grain size composition on the north side of the study area (samples 2, 3, 4, 6). It represented that soil texture is sandy to sandy loam; while on the south side (samples 8, 9, 12, 13, 15) represented the clay loam soil samples texture. Considering pH of the samples are is in the range from acidic (samples 9 and 12) to slightly acidic (samples no. 1, 2, 3, 4, 5, 6, 7, 8, 10,11, 13, 14, 15, and 16). It is believed that this soil samples appropriate acidity and that such soil are suitable for crop farming and orchardings. Studied soils are not calcarious. The humus content in all samples is high except in samples 2, 3, 4 and 6 where it records low values that do not favor the plants. Higher values indicate that the humus soil is favouras for all crops. The quantity and quality of humus in the soil is constantly being renewed or the amount of new topsoil to replace the old and thus maintains a certain level of humus in the soil, which is intended for planting of some crops. This balance is of great importance for the creation and maintenance of soil fertility [2]. In this paper, humus content in the examined samples meet the expected value of around 3. The obtained values of humus content in the analyzed samples even moving through third. Changes in the chemical indicators of soil quality (KP N) does not depend only on the type of soil, and whether or not there was flooding, but also depend on the depth, as well as the location, and sampling. How would later plant absorb the amount of these elements in the soil depends on how the plants are arranged and which species are concerned. For example, in the land where he planted a pear, the percentage and the amount of N and P were higher in soil layer 0-20 cm were higher than those in the 20-40 cm soil layers and 40-60, while the percentage of K at a depth of 40-60 cm soil layer was higher than in soil layers 0-20 cm and 20-40 [11].
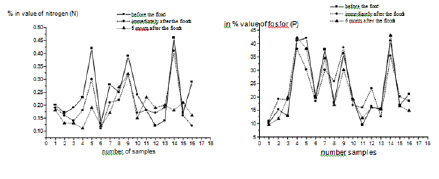
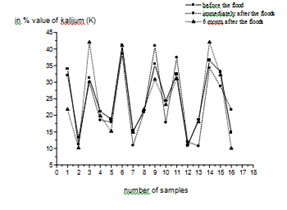
Total nitrogen content is at the level of provision of good, which is a consequence of adequate and appropriate application of fertilizers. Another indication of the input samples of fertilizers in the soil’s balance of carbon and nitrogen, which indicates the extent of its availability to the plants. It is an important indicator, or an indicator of the speed of transformation of organic residues, the quality of humic. The nitrogen content in the analyzed samples of the soil ranges from 0.1 to 0.30 % (i.e. from 0.11% to 0.34%), which is the expected value for this area. The potassium content ranged from low values (samples 5 and 6) through the medium (samples 2, 3, 4, 7, 10, 13, 14 and 15), up to high values (samples 1, 8, 16), as well as excessively high values (samples 9, 11, 12,). Soil samples with high potassium content shouldn’t be fertilized to avoid saturation that could impact yield and yield quality. Phosphorous (P) is very low in the samples 5, 14, in samples No. 1, 2, 3, 4, 6, 7, 10, 13, 15 and 16, the phosphorus content is moderately high, while in samples 8, 9 , 11 and 12 showed high quantity of this element.
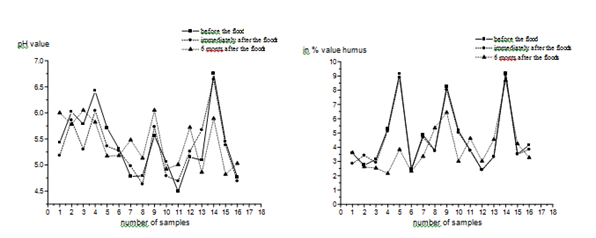
Figure 2: The contents of soil pH (left), and humus values in% (right) before, immediately after and after the floods, Source: Author’s calculation based on the survey data. In the Figure 2 left it can be seen that the pH value of the soil after the flood, changed the value greatly in comparison with values obtained before flooding. It can be concluded that the soil is more acidic, but not so much that could pardize its quality. The graphs in Figure 3 right and 3 are approximately the same. This means that the sustainability of the nutrient quality of the soils along the valley of the River South Morava not endanger by the floods where water is retained more than 20 days (Figures 3 & 4).
On the basis of the results of the soil samples, it can be concluded that chemical property of the soils are satisfactory for growing crops, almost at all locations from which samples were taken before and after a flood. Favorable results are influenced by favorable environmental factors, as well as a good geographical position.. The influence of climatic factors in the future will significantly affect the cultivation of crops and will be of fundamental importance for the survival of people [12, 13, 14, 15, 16, 17, 18, 19, 20, 21].
Conclusion
This paper is research about the sustainability of soil quality in correlation to flooding. Various soil samples from different locations in the South Morava River valley where examined. Samples were taken after harvest in the period before, immediately after the flood and the 6 months after the flood. The test results that were obtained showed that the samples examined in the region soil of satisfactory quality for growing crops, including even land that was flooded. The soil type is sandy and clays as well assoil type shifts, the results are good. The results showed that the samples of soil mainly with pH around 7, that are acidic; that some samples of soil do not need extra fertilization because they are rich in phosphorus and potassium (phosphorus and potassium have values greater than 40). The results showed that soil is rich in humus because in all samples the value of humus is around 3-3.5.
On the basis of the research it can be concluded that the growing of crops and other crops are correct and viable strategy of development of the South Morava valley and the entire region of South Serbia. The analyzed region in the long-term plans can be considered good for farming because the land has a certain quality that is sustainable even in conditions of extreme floods. Due to long-term sustainability, agriculture investment in this region is fisib
References
-
Nikolic V, Ivanis М, Stevovic I, Cvijanovic D (2014) Innovation of organization model for integral rural development - Serbia case study. Economics of Agriculture 61(3): 695-706.
-
Altieri (1995) Agroecology: The science of sustainable agriculture.
-
Stevovic S, Mikovilovic VS, Dragosavac DC (2010) Environmental study of heavy metal influence on soil and Tansy (Tanacetum vulgare L.). African Journal of Biotehnology 9(16): 2392-2400.
-
Stevovic S, Mikovilovic VC, Dragosavac DC (2009) Environmental adaptibility of tansy (Tanacetum vulgare L.,). African Journal of Biotehnology 8(22): 6290-6294.
-
Stevovic S, Mikovilovic VS, Dragosavac, DC (2010) Enviromental impact of site location on marco-and microelements in Tansy. African Journal of Biotehnology 9(16): 2408-2412.
-
Godfray C, Beddington JR, Crute IR, Haddad L, Lawrence D, et al. (2010) Food security: the challenge of feeding 9 billion people. Science 327(5967): 812-818.
-
Stevovic I, Jovanovic J, Stevovic S (2017) Sustainable management of Danube renewable resources in the region of Iron Gate: Djerdap 1, 2 and 3 case study. Management of Environmental Quality 28(5): 664-680.
-
Krnacova Z, Jhresko J, Kanka R, Boltiziar M (2013) The evalution of ecological factors affecting environmental functions of the soils in area of traditional agrarian structures. Ekol Bratislava 32(2): 248-261.
-
Stevovic S, Miloradovic M, Stevovic I (2014) Management of Environmental Quality and Kostolac Mine Areas Natural Resources Usage, Management of Environmental Quality 25(3): 285-300.
-
Dorward A, Chirwa E (2011) The Malawi Agricultural Input Subsidy Programme: 2005/06 to 2008/09. International Journal of Agricultural Sustainability 9(1): 232-247.
-
Xu LF, Zhou P, Han QP, Li ZH, Yang BP, et al. (2013) Spatial Distribution of Soil Organic Matter and Nutrients in the Pear Orchard Under Clean and Sod Cultivation Models. Journal of Integrative Agriculture 12(2): 344-351.
-
Campbell B (2012) Open-pollinated seed exchange: renewed Ozark tradition asagricultural biodiversity conservation. Journal of Sustainable Agriculture 36(5): 500-522.
-
Altieri M, Nicholls C (2005) Berkeley Agroecology and the Search for a Truly Sustainable Agriculture, United Nations Environment Programme Environmental Training Network for Latin America and the Caribbean Boulevard de los Virreyes 155, University of California Colonia Lomas de Virreyes Mexico D.F, Mexico.
-
Mcintyre B, Kim Y, Fruci J, Rosenthal E (2011) The best- laid plans: climate change and food security. Climate and development 3(4): 281-284.
-
Spulerova J (2008) Succession changes in extensively used agricultural soil. Ekológia (Bratislava) 27(1): 54- 64.
-
Pretty J (2008) Agricultural sustainability: concepts, principles and evidence, Philos Trans R Soc Lond B Biol Sci 363(1491): 447-465.
-
Stevanovic B, Jankovic M (2001) Ecology of plants with basics of plant physiology. NNK International, Belgrade, pp: 514.
-
Stevović, Mikovilović SS, Dragosavac VC, Dušica D (2010) Environmental impact on morphological and anatomical structure of Tansy. African Journal of Biotehnology 9(16): 49-2421.
-
Stevovic S, Dervnja N, Dragosavac DC (2011) Environmental impact quantification and correlation between site location and contents and structure of Tansy. African Journal of Biotehnology 10(26): 5075- 5083.
-
Stevovic S (2011) Correlation between Environment and Essential Oil Production in Medical Plants. Advances in Environmental Biology 5(2): 465-468.
-
Conway GR, Waage J (2010) Science and Innovation for Development, UKCDS, London.
- Contribution of 18FDG PET in Atypical HORTON Disease
- Living Conditions, Healthy Practice and State of Households of a Town Rural in Colombia
- Background to the Health and Safety Regulation at Work in Colombia
- Risk Factors Psychology Workers Sena (Center for the Petrochemical Industry) Regional Bolívar, Colombia
- Diffuse Intense Pleural FDG Uptake with Smooth Thickening: A MARKER of Tuberculosis in Isolated Pleural Effusion
- Hypermetabolic Splenomegaly with Infarct in FDG PET/CT: A Clue to Scrub Typhus in PUO