Formulation and Characterization of a New Gastrointestinal Drug Delivery System of Cinnarizine Hydrochloride
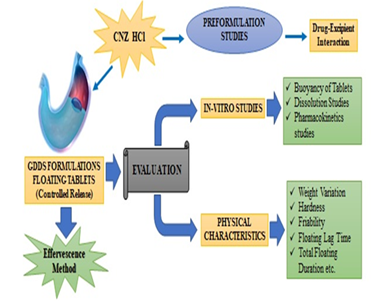
The goal of this study was to create and test an in vitro floating drug delivery system employing polymers such as sodium carboxymethyl cellulose (CMC Sodium), Xanthan gum (XG), and sodium alginate (SA), using cinnarizine hydrochloride (CNZ) as the model drug. The efficacy of the model drug was proven during the pre-formulation research. 18 distinct formulations were developed using a direct compression (effervescent) technique (F1-F18). As a gas generator, sodium bicarbonate was employed. Physical properties such as weight variation, hardness, friability, floating lag time, and total floating duration were assessed in all of the formulations. Four mathematical models were used to predict the drug release Kinetics: zero order, first order, Higuchi, and Korsmeyer Peppas. F1, F2, F3, F6, and F7 were known to be the optimum formulations. They all include the same amount of sodium bicarbonate (40 mg) and ethyl cellulose (40 mg), but different quantities of CMC Sodium, XG, and SA (150mg, 120mg, 90mg, 150mg and 120mg of CMC Sodium:30mg, 60mg, 90mg, 0mg, 0mg of XA & 0mg, 0mg, 0mg, 30mg and 60mg of SA respectively). In 0.1N HCl, all of the optimized batches had a release rate of 92 % to 99.8% in 12 hours and showed adequate swelling for up to 10 hours. Polymers such as CMC sodium, XG, and SA, in conjunction with sodium bicarbonate as a gas producing agent, may be employed to formulate sustained release floating tablets containing CNZ, according to the findings.
Introduction
Drug Delivery in the digestive system may remain in the stomach area for many hours, significantly prolonging the drug’s gastric residence time. Prolonged stomach retention improves bioavailability, prevents drug waste, and increases solubility for medications that are less soluble in high pH environments [1]. Increased medication bioavailability and predictability are the fundamental objectives of oral controlled drug delivery systems. The purpose of developing Oral Gastro controlled release dose forms is to lengthen the time that drugs remain in the body, ideally in the upper small intestine and stomach for at least 12 hours [2].
Longer gastric residence time (GRT) dosage forms, such as gastro remaining or gastro retentive dosage form (GRDF), will open up new therapeutic possibilities [3]. This will greatly lengthen the duration during which drugs may be delivered, allowing for longer dosing intervals and more patient compliance than currently available controlled release dose forms [4]. Calcium supplements, chlordiazepoxide, Furosemide, Diazepam, Levodopa, Methotrexate. Ranitidine, Metformin HCl are some of the suitable candidates and can be formulated in such delivery systems [5]. Cinnarizine hydrochloride (CNZ) is an antihistamine and calcium channel blocker that has been used for a variety of purposes, including smooth muscle contraction in the airways and gastrointestinal tract, vasodilation, cardiac stimulation, gastric acid secretion, interleukin release promotion, and chemotaxis of eosinophil and mast cell [6]. CNZ is a weak base with poor aqueous soluble drug. According to a paper the solubility of CNZ the drug is highly pH dependent, that is, 0.29 mg/mL at pH 2, 0.017 mg/mL at pH 5, and 0.002 mg/mL at high pH of 6.5 [7].
CNZ is characterized by short half-life (3–6 h).Long term administration of cinnarizine leads to headache, GI upsets and gastric reflux [8, 9, 10]. So, new drug delivery systems need to be thoroughly researched in order to find the best dosing regimen without jeopardizing the drug’s therapeutic efficiency. In compared to single unit dose forms, the gastro-retentive floating system appears to have more consistent drug absorption over time and lowers the risk of local discomfort. The goal of this study was to develop a new carrier based on effervescent technology and sustained release gastro-retentive floating tablets containing CNZ. In the form of gastro-retentive floating tablets, an attempt has been made to enhance the solubility, stability, and bioavailability of cinnarizine as a whole. This approach might also assist to remove the need for frequent dosage, which would improve patient compliance and reduce the toxic side effects.
Materials and Methods
Cinnarizine hydrochloride (CNZ) was obtained from Ananta Drugs & Pharma (P) Ltd, Sri Ganganagar. Xanthan gum (XG), PVP K-30 was procured from Ramson Industries, Amritsar. Carboxymethyl cellulose Sodium (CMC sodium), Di-basic calcium phosphate (DCP), Sodium bicarbonate (SB), n-propyl alcohol was procured from Central Drug House Private Limited, New Delhi
Preformulation Studies
The FT-IR and NMR spectroscopic techniques were used in the process of characterizing CNZ [11, 12]. A spectrophotometric study was performed using 0.1 N HCl and methanol as the solvents of choice for the calibration curve. The drug-excipient and polymer compatibility tests were determined using FT-IR and Spectrophotometric measurements in addition to powder flow characteristics [13].
Preparation of Floating Tablets of Cinnarizine Hydrochloride
For the production of 18 distinct CNZ floating tablet formulations, the direct compression technique was employed (F1- F18). As stated in table 4, the first main combination was created by combining 50 mg of CNZ with all of the other ingredients excluding talc (TL) and magnesium stearate (MS). To create the compacts, the mixture was then squeezed together in a slugging machine. The compacts were subsequently separated by milling and sieving, using sieves no. 18 and 60, respectively. Granules are the fragments that passed through sieve number 18, whereas fines are the fragments that passed through filter number 60. The residual particles were removed from the granules by crushing, milling, and a second sieving through sieves 18 and 60. The process of pressing, milling, and screening was repeatedly carried out until a 70:30 granule-to-fines ratio was reached.
The final amalgamation was then created by adding Talc as a lubricant and magnesium stearate as a binding agent. According to protocol, precompression investigations were conducted on the manufactured mixture to establish its bulk density, tapped density, hausner’s ratio, carr’s index, and angle of repose [14, 15, 16]. The mixture was compressed using a rotary press to create 370 mg tablets after the precompression parameters were assessed. In this study sodium CMC, XA, and SA were used as polymers, sodium bicarbonate as effervescent agent, di-calcium phosphate to increase buoyancy (floating), PVP K-30 as diluent and starch as binder [17].
Evaluation of CNZ Floating Tablet
Weight Variation Test: 20 tablets were taken and each tablet was weighed individually using the electronic balance. The average weight of the tablet was calculated and considered as the standard weight of the individual tablet. Then all the tablets were individually weighed and the percentage weight variation was calculated from the following formula to determine whether the individual weight is within the range or not.
% weight variation= [(Individual weight- Average weight) X100]/ Average weight The tablets meet the USP test if not more than two tablets are outside the percentage limit and if no tablet differ by more than two times the percentage limit.
Hardness Test: To evaluate the tablet hardness, Monsanto hardness tester was used. The tester consists of a barrel containing a compressible spring held between two plungers. The lower plunger was placed in contact with the tablet and the zero reading was taken. The upper plunger was then forced against a spring by turning a threaded bolt until the tablet fractures. As the spring was compressed, a pointer rides along a gauge in the barrel to indicate the force. The force of fracture was recorded and the zero-force reading was deducted from it.
Friability Test: Roche friabilator was used to check the friability of the tablet. This device, subjects a number of tablets to the combined effects of abrasion and shock by utilizing plastic chamber that revolves at 25 rpm, dropping of tablets a distance of six inches with each revolution. A pre weighed tablets sample was placed in the friabilator, which was then operated for 100 revolutions. The tablets were then dusted and reweighed. According to USP the tablets should not lose more than 1% of their total weight. The percentage friability is calculated from the following formula:
% Friability = [(Weight before friability-Weight after friability) X 100] / Weight before friability Diameter & Thickness Test: The diameter was measured by using the Vernier calipers. In which permitted accurate measurements and provide information on the variation between tablets. Tablet was placed in vernier caliper and recorded the reading in which main scale and vernier scale reading co-inside with each other. The tablet diameter was controlled within a ±5% variation of a standard value.
Tablets thickness was determined using the micrometer screw gauge. Ten tablets were picked randomly from each batch. Each tablet was placed in between the micrometer screw gauge, spindle and thickness reading was obtained in millimeters.
Swelling Study: Swelling studies were performed to calculate molecular parameters of swollen polymers. The swelling behaviour of a dosage unit was measured by studying its weight gain. The swelling index of tablets were determined by placing the tablets in 100 ml beakers of 0.1 N HCL pH and after 1, 2, 4, 6 and 8 hrs each beaker containing tablet was withdrawn, for each time point. Swelling index was calculated by using the following formula.
Swelling index = (Wt. of wet tablet – Wt. of dry tablet) / Wt. of dry tablet ×100 Floating Behaviour: In this work for greater localized effect of Cinnarizine Hydrochloride, the floating strategy was taken into consideration in the design of delivery system. The floatation was accomplished by incorporating gas generating salts such as sodium bicarbonate into a swellable hydrophilic layer. Carbon dioxide is formed within the tablet containing effervescent agent when the Cinnarizine tablet is brought in contact with the acidic dissolution medium. Moreover, the gelling capacity of polymer that also helps to float the tablet by entrapping carbon dioxide.
Floating Lag Time: The time taken for dosage form to emerge on surface of medium is called floating lab time. The floating lag time of the tablets were determined by the time required for the tablet to rise to the surface of the medium (0.1N HCl, pH 1.2) in 500mL beaker where the tablets were placed.
Floating Duration Time: The duration of time by which dosage form remain buoyant is called total duration of time. The total time can be determined by placing the tablet in 500mL beaker containing 0.1N HCl, pH 1.2. The duration of time in dosage form constantly remained on the surface of medium was determined as the floating duration time.
In Vitro Drug Release Study: In Vitro dissolution studies for all the prepared tablets were carried out using USP paddle method. Placed the 900 ml of the dissolution medium (0.1 N HCL), into the vessel of the apparatus. Setup the programme according to requirements and warmed the dissolution medium to 37º C. Placed the tablet in the vessel and dissolution test apparatus was then start immediately at the speed of 50 rpm. After the 1, 2, 3, 4, 5, 6, 7, 8, 9, 10, 11 and 12 hours samples were withdrawn from a zone midway between the surface of the dissolution medium and the top of the rotating paddle, not less than 10 mm from the wall of the vessels. An equal volume of pre warmed (37ºC) fresh medium was replaced in to dissolution medium after each sampling, to maintain the constant volume throughout the test. Filtered the sample solution promptly through a membrane filter disc with an average pore diameter not greater than 1.0 micrometer. Discard the first few ml of the filtrate and noted absorbance spectrophotometrically at 253.5 nm. Then the cumulative percentage of drug release was calculated and represents graphically. Stability Study: Stability studies were conducted only on optimized formulation. The formulation were packed with aluminum foil and subjected to stability studies at different temperature and humidity condition as per ICH guidelines viz. room temperature (28°C) and 40°C / 75 % RH. Samples were withdrawn at time intervals of 30, 60 and 90 days. These were evaluated for possible weight variation, hardness, and % drug content and in-vitro drug release. In vitro release was studied by spectrophotometrically method.
Result and Discussion
Preformulation Studies
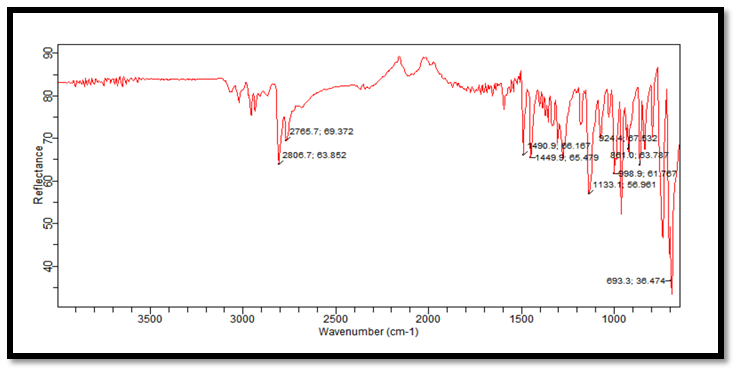
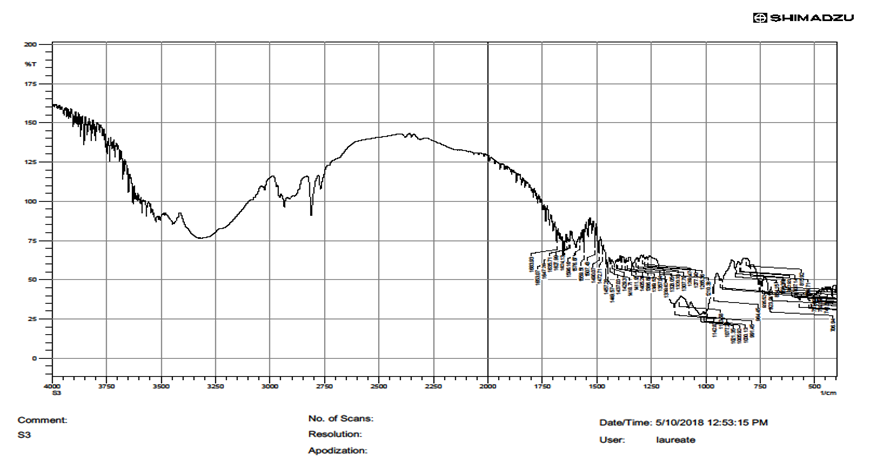
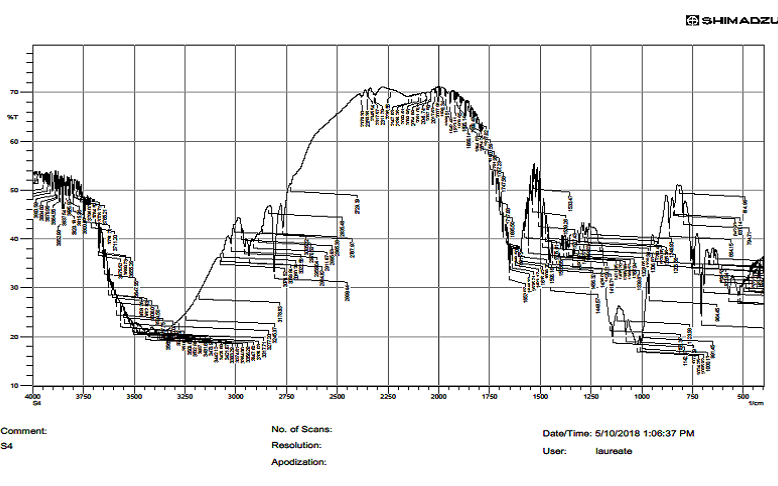
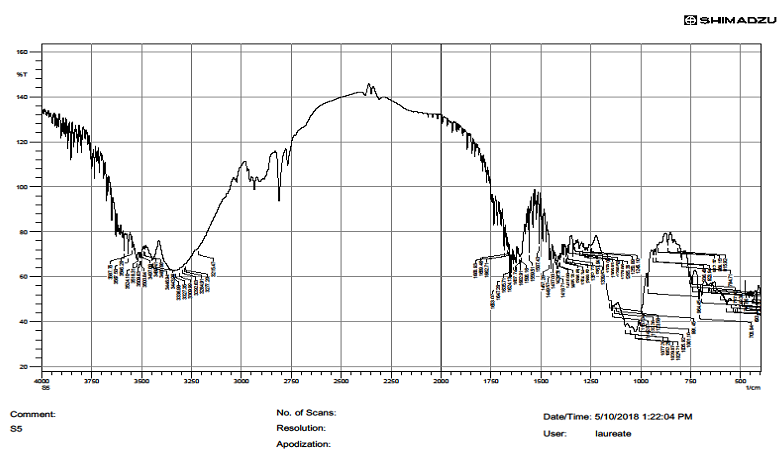
Characterization of Drug by FTIR & NMR: FT-IR spectrum of CNZ was obtained by using FT-IR spectrophotometer using potassium bromide pellet technique (pressure of 10- 12 pounds) in the range of 4000-400 cm-1 Figure 1.
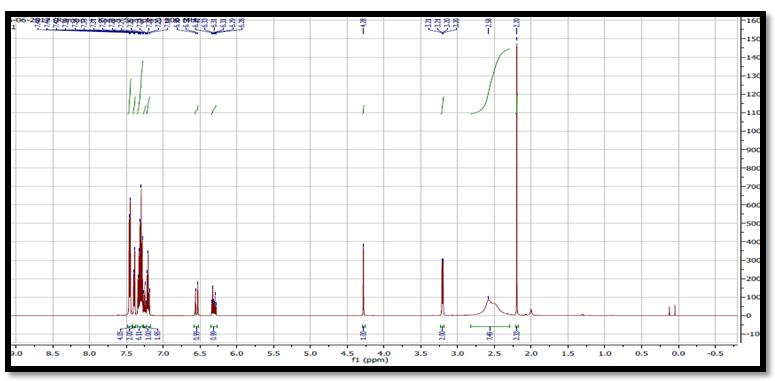
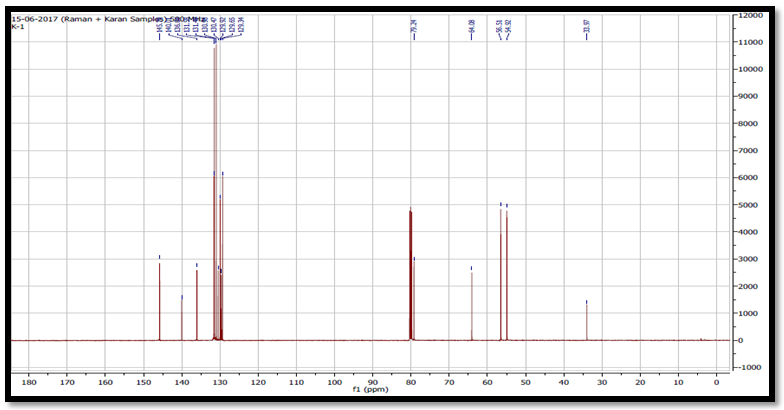
Nuclear Magnetic Resonance (NMR): On the NMR spectrometer AVANCE III, which operates at a proton frequency of 500 MHz and uses 5mm sample tubes, the mean spectra of CNZ were captured at 250C. Tetramethylsilane was utilised as an internal standard and the drug was dissolved in it. Chemical shifts were represented on the TMS signal (0 ppm) in parts per million downfield Figure 2 and Figure 3.
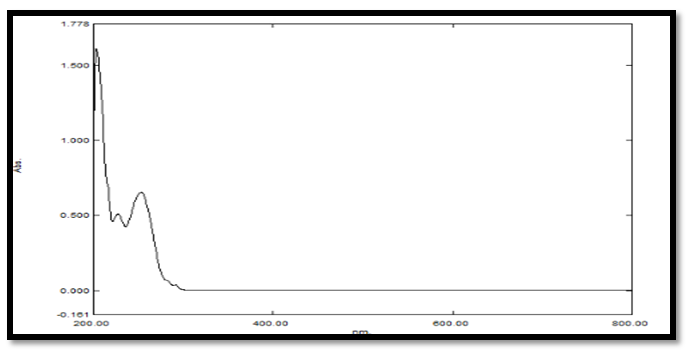
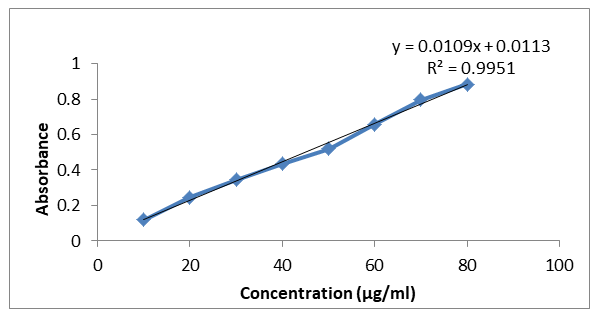
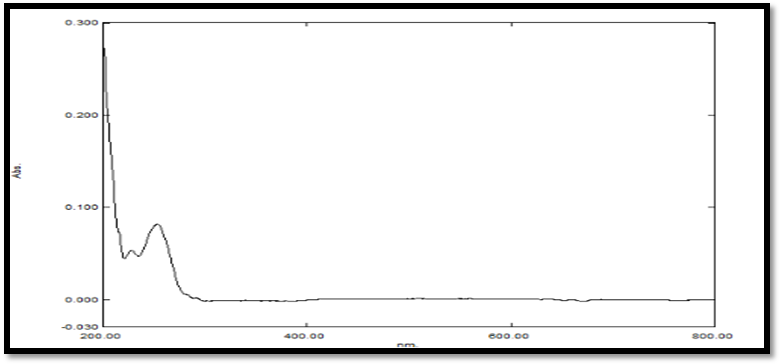
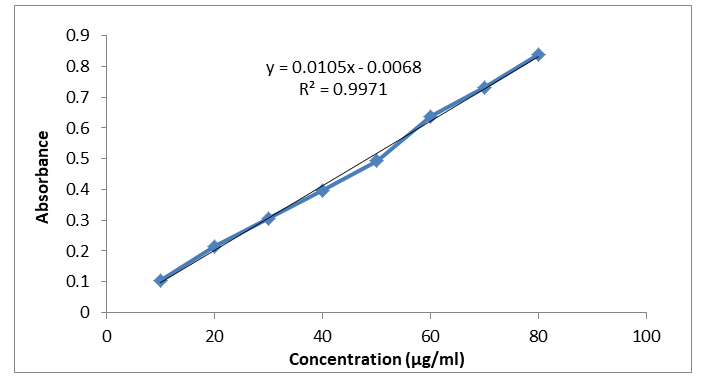
Spectrophotometric Analysis of Drug in 0.1 N Hcl & Methanol: CNZ was dissolved separately in 0.1N HCl and methanol to prepare different dilutions ranging from 10 to 90 µg/ml using 0.1N HCl and methanol as blank. The prepared dilutions were scanned spectrophotometrically within the range between 200 to 800 nm using Shimadzu UV 1800 spectrophotometer (Figures 4-7).
Melting Point: The melting point was determined by capillary method The reported melting point is 117°C – 121°C and the melting was found to be 119°C.
Solubility Determination: The drug’s solubility was examined in distilled water, phosphate buffers, and 0.1N HCl. The concentration of CNZ was determined by U.V spectrophotometer (Table 1).
| Solvent | Solubility(mg/ml) | Reported(mg/ml) | |
|---|---|---|---|
| Distilled water | 0.001 | 0.001 | |
| Phosphate Buffer 7.2 | 0.0017 | 0.0018 | |
| Phosphate Buffer 7.4 | 0.0012 | 0.0012 | |
| Phosphate Buffer 6.8 | 0.0025 | 0.002 | |
| 0.1N HCl (1.2 pH) | 0.31 | 0.32 | |
| Parameters | CNZ powder | ||
| Bulk Density (g/ml) | 0.474±0.050 | ||
| Tapped Density (g/ml) | 0.573±0.060 | ||
| Hauser’s Ratio | 1.208±0.037 | ||
| Compressibility Index (%) | 17.277±1.6 | ||
| Angle of repose (0) | 21.80±1.670 |
Table 1: Solubility of CNZ in different solvents.
Powder Flow Characteristics: Parameters like Bulk Density, Tapped Density, Hauser’s Ratio Compressibility Index (%) Angle of repose (0) was studied as per standard procedure given in the literature (Table 2).
Drug Excipients and Polymers Compatibility Study by Spectrophotometer and FTIR: CNZ was mixed properly with the excipients in various ratios manually. These mixtures were filled in glass vials and packed properly and exposed to 400C/75%RH for a period of one month. Physical checks of the mixture’s like colour and nature were performed at the time of process initiation and at 1, 2, and 3 month intervals (Table 3).
| Excipients | Starting of Study (Initial) | After Three Month (Final) | Conclusion | |
|---|---|---|---|---|
| 1 | CNZ | White Crystalline powder | White Crystalline powder | Compatible |
| 2 | CNZ + CMC sodium | White Crystalline powder | White Crystalline powder | Compatible |
| 3 | CNZ + XG | Cream fine powder | Cream fine powder | Compatible |
| 4 | CNZ + SA | Yellowish Crystalline powder | Yellowish Crystalline powder | Compatible |
| 5 | CNZ + DCP | White Crystalline powder | White Crystalline powder | Compatible |
| 6 | CNZ + EC | White Crystalline powder | White Crystalline powder | Compatible |
| 7 | CNZ + SB | White Crystalline powder | White Crystalline powder | Compatible |
| 8 | CNZ + ST | White crystalline powder | White Crystalline powder | Compatible |
| 9 | CNZ + PVP K-30 | White Crystalline powder | White Crystalline powder | Compatible |
| 10 | CNZ + TL | White Crystalline powder | White Crystalline powder | Compatible |
| 11 | CNZ + MS | White Crystalline powder | White Crystalline powder | Compatible |
Table 2: Drug-Excipients and polymers Compatibility Studies.
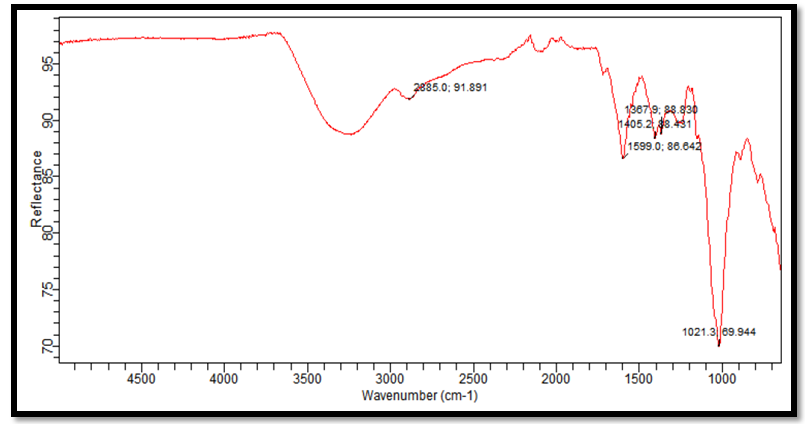
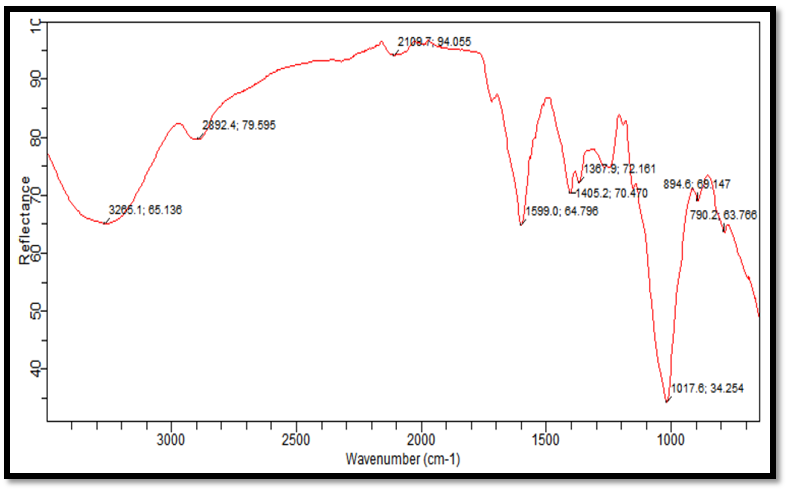
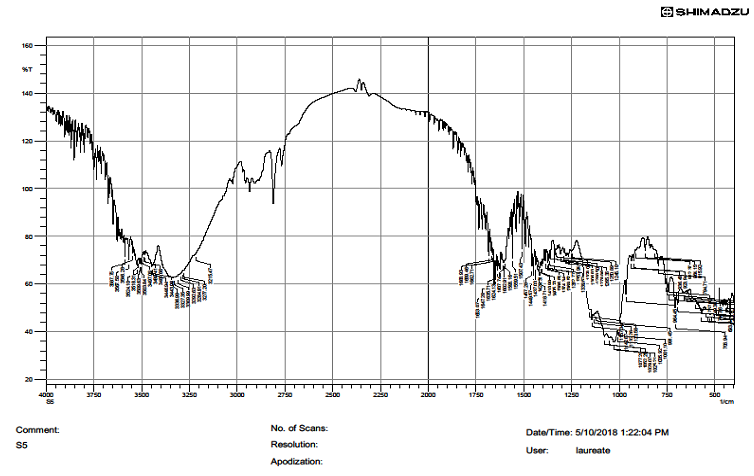
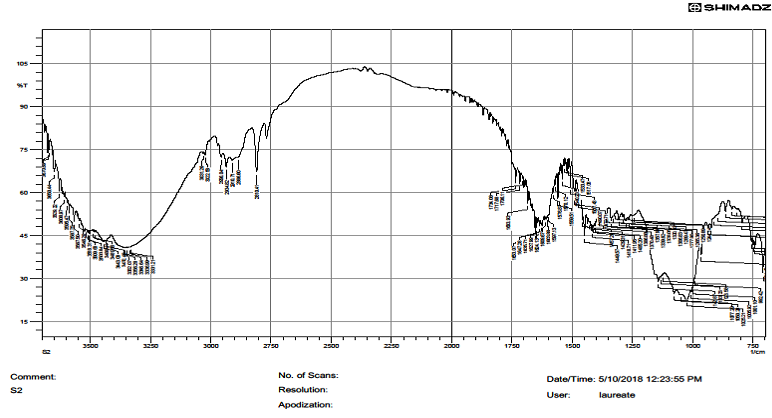
CNZ-Excipient Compatibility Study Using FT-IR
The existence of the same peaks demonstrates that no significant shifting of bands or peaks was seen in CNZ when combined with CMC sodium, XA, or SA. Neither of them exhibited any chemical interaction when used separately or in combination, suggesting that no chemical interaction occurred between them. (Figures 8-14).
CNZ- Cinnarizine Hydrochloride, CMC Sodium- carboxymethyl cellulose sodium, XG- Xanthan gum ,SA- Sodium alginate, ST- Starch, PVP-K30-polyvinyl pyrolidone, DCP-dicalcium phosphate, EC- Ethyl cellulose, SB- Sodium bicarbonate, MS- Magnesium stearate, TL- Talc (Table 4).
| CNZ | Na-CMC | XG | SA | ST | PVP-K30 | DCP | EC | SB | MS | TL | Total | |
|---|---|---|---|---|---|---|---|---|---|---|---|---|
| F1 | 50 (13.5) | 150 (40.5) | 30 (8.1) | - | 12 (3.2) | 20 (5.4) | 40 (10.8) | 20 (5.4) | 40 (10.8) | 4 (1.1) | 4 (1.1) | 370 |
| F2 | 50 (13.5) | 120 (32.4) | 60 (16.2) | - | 12 (3.2) | 20 (5.4) | 40 (10.8) | 20 (5.4) | 40 (10.8) | 4 (1.1) | 4 (1.1) | 370 |
| F3 | 50 (13.5) | 90 (24.3) | 90 (24.3) | - | 12 (3.2) | 20 (5.4) | 40 (10.8) | 20 (5.4) | 40 (10.8) | 4 (1.1) | 4 (1.1) | 370 |
| F4 | 50 (13.5) | 60 (16.2) | 120 (32.4) | - | 12 (3.2) | 20 (5.4) | 40 (10.8) | 20 (5.4) | 40 (10.8) | 4 (1.1) | 4 (1.1) | 370 |
| F5 | 50 (13.5) | 30 (8.1) | 150 (40.5) | - | 12 (3.2) | 20 (5.4) | 40 (10.8) | 20 (5.4) | 40 (10.8) | 4 (1.1) | 4 (1.1) | 370 |
| F6 | 50 (13.5) | 30 (8.1) | 150 (40.5)- | - | 12 (3.2) | 20 (5.4) | 40 (10.8) | 20 (5.4) | 40 (10.8) | 4 (1.1) | 4 (1.1) | 370 |
| F7 | 50 (13.5) | 150 (40.5) | - | 30 (8.1) | 12 (3.2) | 20 (5.4) | 40 (10.8) | 20 (5.4) | 40 (10.8) | 4 (1.1) | 4 (1.1) | 370 |
| F8 | 50 (13.5) | 90 (24.3) | - | 90 (24.3) | 12 (3.2) | 20 (5.4) | 40 (10.8) | 20 (5.4) | 40 (10.8) | 4 (1.1) | 4 (1.1) | 370 |
| F9 | 50 (13.5) | 60 (16.2) | - | 120 (32.4) | 12 (3.2) | 20 (5.4) | 40 (10.8) | 20 (5.4) | 40 (10.8) | 4 (1.1) | 4 (1.1) | 370 |
| F10 | 50 (13.5) | 30 (8.1) | - | 150 (40.5) | 12 (3.2) | 20 (5.4) | 40 (10.8) | 20 (5.4) | 40 (10.8) | 4 (1.1) | 4 (1.1) | 370 |
| F11 | 50 (13.5) | - | 30 (8.1) | 150 (40.5) | 12 (3.2) | 20 (5.4) | 40 (10.8) | 20 (5.4) | 40 (10.8) | 4 (1.1) | 4 (1.1) | 370 |
| F12 | 50 (13.5) | - | 60 (16.2) | 120 (32.4) | 12 (3.2) | 20 (5.4) | 40 (10.8) | 20 (5.4) | 40 (10.8) | 4 (1.1) | 4 (1.1) | 370 |
| F13 | 50 (13.5) | - | 90 (24.3) | 90 (24.3) | 12 (3.2) | 20 (5.4) | 40 (10.8) | 20 (5.4) | 40 (10.8) | 4 (1.1) | 4 (1.1) | 370 |
| F14 | 50 (13.5) | - | 120 (32.4) | 60 (16.2) | 12 (3.2) | 20 (5.4) | 40 (10.8) | 20 (5.4) | 40 (10.8) | 4 (1.1) | 4 (1.1) | 370 |
| F15 | 50 (13.5) | - | 150 (40.5) | 30 (8.1) | 12 (3.2) | 20 (5.4) | 40 (10.8) | 20 (5.4) | 40 (10.8) | 4 (1.1) | 4 (1.1) | 370 |
| F16 | 50 (13.5) | 180 (48.6) | - | - | 12 (3.2) | 20 (5.4) | 40 (10.8) | 20 (5.4) | 40 (10.8) | 4 (1.1) | 4 (1.1) | 370 |
| F17 | 50 (13.5) | - | 180 (48.6) | - | 12 (3.2) | 20 (5.4) | 40 (10.8) | 20 (5.4) | 40 (10.8) | 4 (1.1) | 4 (1.1) | 370 |
| F18 | 50 (13.5) | - | - | 18 | 12 (3.2) | 20 (5.4) | 40 (10.8) | 20 (5.4) | 40 (10.8) | 4 (1.1) | 4 (1.1) | 370 |
Table 3: Composition of floating tablets of CNZ (F1-F18). CNZ- Cinnarizine Hydrochloride, Na-CMC- CMC Sodium, XG- Xanthan gum ,SA
Table 4: Composition of floating tablets of CNZ (F1-F18). CNZ- Cinnarizine Hydrochloride, Na-CMC- CMC Sodium, XG- Xanthan gum ,SA-Sodium alginate, ST- Starch, PVP-K30-polyvinyl pyrolidone, DCP-dicalcium phosphate, EC- Ethyl cellulose, SB- Sodium bicarbonate, MS- Magnesium stearate, TL- Talc *All quantities are in mg. The weights given are for each tablet. **The figure given in brackets indicates the percentage composition. Weight Variation Hardness, Thickness, Diameter and Friability of Floating Tablet As per usual protocol, the produced tablets were evaluated for percent weight variation, hardness, thickness, diameter, and friability (Table 5). All 18 formulations exhibited good results in terms of weight variation (ranging from 1.04-4.34 percent), hardness (ranging from 4.6-5.5kg/ cm2), thickness (4.6-4.9mm), and friability (ranging from 0.23-0.534 %) according to pharmacopoeial standards (Table 6).
| Weight variation (%) | Hardness (Kg/cm2) | Thickness (mm) | Diameter (mm) | Friability (%) | |
|---|---|---|---|---|---|
| Mean±SD n=3 | Mean±SD n=3 | Mean±SD n=3 | Mean±SD n=3 | Mean±SD n=3 | Mean±SD n=3 |
| F1 | 3.68 ±0.34 | 4.25±0.10 | 4.6±0.653 | 11.21±0.016 | 0.23±0.02 |
| F2 | 3.99 ±0.32 | 5.12±0.42 | 4.4±0.761 | 11.21±0.011 | 0.42±0.02 |
| F3 | 4.34±0.53 | 5.2±0.32 | 4.5±0.160 | 11.21±0.01 | 0.36±0.08 |
| F4 | 3.99±0.54 | 5±0.23 | 4.6±0.817 | 11.21±0.013 | 0.32±0.03 |
| F5 | 2.91±0.34 | 5.15±0.11 | 4.6±0.653 | 11.21±0.016 | 0.18±0.01 |
| F6 | 2.72±0.36 | 5.15±0.35 | 4.5±0.525 | 11.21±0.013 | 0.4±0.06 |
| F7 | 2.93±0.45 | 5.12±0.25 | 4.5±0.571 | 11.21±0.012 | 0.34±0.04 |
| F8 | 3.21±0.36 | 4.5±0.56 | 4.5±0.091 | 11.22±0.016 | 0.41±0.03 |
| F9 | 1.75±0.69 | 4.42±0.79 | 4.6±0.525 | 11.21±0.013 | 0.38±0.08 |
| F10 | 2.99±0.57 | 4.3±0.67 | 4.6±0.066 | 11.21±0.01 | 0.39±0.05 |
| F11 | 2.51±0.42 | 5.25±0.45 | 4.5±0.525 | 11.20±0.013 | 0.47±0.13 |
| F12 | 1.04±0.23 | 5.15±0.23 | 4.5±0.571 | 11.20±0.14 | 0.45±0.20 |
| F13 | 4.08±0.18 | 5±0.21 | 4.6±0.091 | 11.21±0.013 | 0.41±0.07 |
| F14 | 2.54±0.39 | 5±0.45 | 4.6±0.056 | 11.21±0.12 | 0.53±0.02 |
| F15 | 3.29±0.34 | 4.44±0.11 | 4.5±0.574 | 11.21±0.016 | 0.32±0.01 |
| F16 | 2.78±0.20 | 5.11±0.25 | 4.6±0.653 | 11.20±0.012 | 0.42±0.07 |
| F17 | 2.6±0.54 | 5±0.20 | 4.6±0.761 | 11.20±0.013 | 0.38±0.03 |
| F18 | 1.7±0.21 | 5.11±0.10 | 4.6±0.160 | 11.21±0.012 | 0.42±0.03 |
Table 4: Weight variation, hardness, thickness, diameter and friability of floating tablet F1-F18.
| Formulation code | Bulk Density (gm/ ml) Mean±SD n=3 | Tapped Density (gm/ml) Mean±SD n=3 | Hausner’s ratio Mean±SD n=3 | Compressibility Index Mean±SD n=3 | Angle of repose ( º ) Mean±SD n=3 |
|---|---|---|---|---|---|
| FI | 0.37±0.01 | 0.44±0.04 | 1.18±0.02 | 15.90±1.14 | 28.6±0.59 |
| F2 | 0.38±0.02 | 0.45±0.04 | 1.19±0.08 | 16.90±1.12 | 27.9±0.66 |
| F3 | 0.33±0.03 | 0.42±0.04 | 1.27±0.05 | 21.42±1.13 | 27.8±0.45 |
| F4 | 0.32±0.05 | 0.41±0.05 | 1.26±0.04 | 21.95±0.75 | 28.4±0.45 |
| F5 | 0.31±0.04 | 0.40±0.03 | 1.24±1.1 | 22.05±0.80 | 28.6±0.70 |
| F6 | 0.34±0.01 | 0.40±0.09 | 1.17±0.09 | 15.00±1.10 | 28.3±0.80 |
| F7 | 0.35±0.02 | 0.43±0.07 | 1.22±0.05 | 18.6±0.34 | 28.8±0.68 |
| F8 | 0.47±0.02 | 0.57±0.05 | 1.5±0.06 | 17.54±0.58 | 27.9±0.58 |
| F9 | 0.48±0.01 | 0.59±0.04 | 1.22±0.06 | 18.6±1.11 | 27.8±0.99 |
| F10 | 0.45±0.04 | 0.52±0.04 | 1.15±0.07 | 13.46±0.87 | 28.06±1.17 |
| F11 | 0.41±0.03 | 0.50±0.03 | 1.21±0.08 | 18.00±0.30 | 26..7±1.14 |
| F12 | 0.39±0.05 | 0.49±0.02 | 1.18±0.04 | 20.4±0.42 | 26.5±0.89 |
| F13 | 0.37±0.03 | 0.42±0.03 | 1.20±0.07 | 17.91±0.02 | 25.5±0.67 |
| F14 | 0.35±0.04 | 0.45±0.03 | 1.21±0.06 | 17.77±0.39 | 28.4±0.03 |
| F15 | 0.67±0.02 | 0.80±0.01 | 1.19±0.03 | 12.16±0.78 | 26.9±0.58 |
| F16 | 0.65±0.003 | 0.74±0.01 | 1.13±0.05 | 11.11±0.45 | 27.1±0.64 |
| F17 | 0.64±0.05 | 0.72±0.01 | 1.12±0.07 | 15.38±0.67 | 27.6±1.45 |
| F18 | 0.66±0.08 | 0.70±0.04 | 1.18±0.05 | 20.1±0.66 | 26.6±0.1.23 |
Table 5: Bulk density, Tapped Density, Hausner’s ratio, Compressibility Index, Angle of repose (°) Floating behavior & floating d
The floating lag time of the tablets were measured by immersing the tablets in 500ml of 0.1N HCl, pH 1.2. The floating duration of time and tablet density by which all the formulations remain buoyant were noted. Drug content was determined by UV spectrophotometer using methanol as solvent (at 253 nm). The detail of outcome is depicted in Table 7.
| Table 8: Swelling index of formulated floating tablets of formulation F1-F18. | Table 8: Swelling index of formulated floating tablets of formulation F1-F18. | Table 8: Swelling index of formulated floating tablets of formulation F1-F18. | |
|---|---|---|---|
| Formulation Code | Table 8: Swelling index of formulated floating tablets of formulation F1-F18. | Table 8: Swelling index of formulated floating tablets of formulation F1-F18. | Table 8: Swelling index of formulated floating tablets of formulation F1-F18. |
| F1 | 0.98 ±0.01 | 98±0.02 | 10±0.05 |
| F2 | 0.97 ±0.01 | 122±0.02 | 10±0.12 |
| F3 | 0.93 ±0.02 | 68±0.04 | 12.5±0.1 |
| F4 | 0.89±0.02 | 63±0.06 | 12.50±0.08 |
| F5 | 0.87±0.03 | 45±0.02 | 12.49±0.14 |
| F6 | 0.81±0.03 | 65±0.03 | 12.20±0.09 |
| F7 | 0.97±0.04 | 53±0.02 | 12.50±0.11 |
| F8 | 0.95±0.04 | 58±0.04 | 9±0.1 |
| F9 | 0.96±0.03 | 52±0.03 | 10.12±0.12 |
| F10 | 0.90±0.2 | 57±0.05 | 10±0.09 |
| F11 | 0.78±0.03 | 106±0.04 | 9.47±0.11 |
| F12 | 0.95±0.01 | 113±0.06 | 10.55±0.09 |
| F13 | 0.78±0.01 | 88±0.03 | 11.40±0.13 |
| F14 | 0.98±0.01 | 120±0.02 | 12±0.11 |
| F15 | 0.94±0.02 | 79±0.03 | 12±0.12 |
| F16 | 0.90±0.04 | 123±0.04 | 1±0.13 |
| F17 | 0.89±0.3 | 179±0.02 | 12±0.1 |
| F18 | 0.88±0.01 | 205±0.5 | 7±0.1 |
Table 6: Tablet density, floating lag time and floating duration of the formulation F1-F18.
Swelling Index Study of CNZ: Swelling studies were performed in order to investigate the molecular properties of swollen polymers. The swelling index of tablets was calculated by immersing them in 100 ml of 0.1 N HCl pH
1.2 and removing them after 1, 2, 4, 6, and 8 hours, for each time point. The swelling index was computed using the conventional method (Table 8).
| Formulation code | Swelling index of formulated floating tablets | |||||
|---|---|---|---|---|---|---|
| 0h | 1h | 2h | 4h | 6h | 8h | |
| F1 | 0 | 76.71 | 110.41 | 134.79 | 156.98 | 191.78 |
| F2 | 0 | 64.05 | 94.05 | 121.62 | 142.16 | 160.27 |
| F3 | 0 | 73.44 | 95.2 | 118.69 | 157.15 | 162.33 |
| F4 | 0 | 66.57 | 111.23 | 132.3 | 162.35 | 167.41 |
| F5 | 0 | 60.95 | 94.1 | 117.97 | 147.75 | 169.94 |
| F6 | 0 | 64.22 | 67.47 | 80.75 | 111.38 | 173.44 |
| F7 | 0 | 100.54 | 130.89 | 150.67 | 183.19 | 201.62 |
| F8 | 0 | 95.66 | 113 | 126.01 | 142 | 149.32 |
| F9 | 0 | 87.5 | 98.36 | 113.58 | 125.54 | 132.33 |
| F10 | 0 | 73.9 | 90.05 | 91.93 | 101.61 | 101.97 |
| F11 | 0 | 57.8 | 85.86 | 114.67 | 135.86 | 158.42 |
| F12 | 0 | 66.21 | 101.35 | 119.45 | 155.4 | 187.29 |
| F13 | 0 | 67.02 | 101.08 | 132.69 | 147.13 | 160.21 |
| F14 | 0 | 79.06 | 109.09 | 122.86 | 158.67 | 172.72 |
| F15 | 0 | 65.04 | 87.6 | 93.22 | 113 | 113.89 |
| F16 | 0 | 74.3 | 108.37 | 131.84 | 186.31 | 198.32 |
| F17 | 0 | 117.74 | 136.55 | 169.62 | 198.65 | 239.72 |
| F18 | 0 | 64.28 | 67.47 | 68.02 | 80.75 | 96.47 |
Table 7: Swelling index of formulated floating tablets of formulation F1-F18.
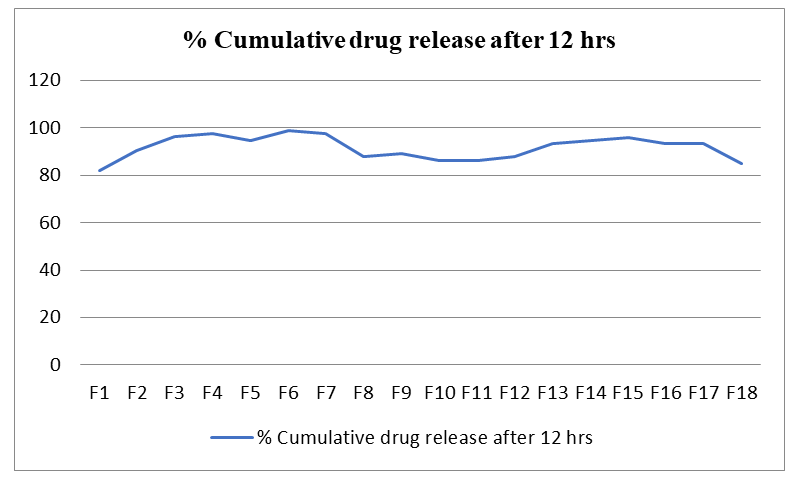
Swelling index = (Wt. of wet tablet – Wt. of dry tablet) / Wt. of dry tablet ×100 In Vitro Drug Release Study: All of the tablets were subjected to a 12-hour in vitro dissolution study utilizing the USP paddle at 50 rpm and 0.1 N HCl as the dissolution media. The overall percentage of drug release was calculated and depicted graphically (Table 9 & Figure 15).
| Formulation Code | % Cumulative Drug Release | ||||||||||||
|---|---|---|---|---|---|---|---|---|---|---|---|---|---|
| 0h | 1h | 2h | 3h | 4h | 5h | 6h | 7h | 8h | 9h | 10h | 11h | 12h | |
| F1 | 0 | 1.38 | 6.92 | 11.08 | 18.02 | 23.58 | 30.52 | 38.87 | 49.99 | 58.35 | 68.11 | 76.49 | 82.11 |
| F2 | 0 | 2.769 | 8.31 | 12.47 | 22.18 | 27.74 | 34.69 | 44.42 | 54.16 | 66.69 | 77.84 | 80.69 | 90.47 |
| F3 | 0 | 11.08 | 19.4 | 26.34 | 37.45 | 43.03 | 50 | 54.21 | 62.58 | 75.11 | 83.5 | 94.67 | 96.16 |
| F4 | 0 | 9.692 | 15.24 | 27.72 | 34.67 | 44.4 | 48.61 | 52.82 | 57.03 | 61.24 | 76.54 | 89.09 | 97.5 |
| F5 | 0 | 8.307 | 15.24 | 23.56 | 31.9 | 40.24 | 48.59 | 58.34 | 66.71 | 76.48 | 83.49 | 93.27 | 94.76 |
| F6 | 0 | 12.46 | 20.78 | 33.27 | 38.84 | 45.81 | 54.17 | 65.3 | 72.3 | 80.69 | 87.7 | 93.34 | 98.98 |
| F7 | 0 | 11.08 | 19.4 | 24.96 | 34.68 | 41.64 | 54.15 | 62.51 | 69.51 | 79.28 | 84.9 | 93.3 | 97.56 |
| F8 | 0 | 6.923 | 11.08 | 15.25 | 20.81 | 30.52 | 37.48 | 44.44 | 59.72 | 65.33 | 73.71 | 82.1 | 87.73 |
| F9 | 0 | 12.46 | 19.4 | 26.34 | 34.68 | 38.87 | 45.84 | 54.2 | 63.95 | 69.56 | 76.56 | 82.18 | 89.2 |
| F10 | 0 | 4.153 | 11.08 | 19.4 | 24.96 | 33.3 | 41.64 | 50 | 56.97 | 65.34 | 72.34 | 80.73 | 86.36 |
| F11 | 0 | 4.153 | 12.47 | 20.79 | 30.5 | 37.46 | 47.19 | 50.02 | 62.53 | 72.29 | 76.53 | 82.15 | 86.26 |
| F12 | 0 | 6.923 | 16.62 | 26.33 | 34.67 | 38.86 | 43.06 | 51.42 | 57.01 | 65.38 | 70.99 | 79.38 | 87.77 |
| F13 | 0 | 16.62 | 23.56 | 33.28 | 43 | 54.13 | 65.27 | 70.88 | 79.26 | 83.5 | 87.75 | 90.62 | 93.49 |
| F14 | 0 | 8.307 | 15.24 | 23.56 | 31.9 | 40.24 | 48.59 | 58.34 | 66.71 | 76.48 | 83.49 | 93.27 | 94.76 |
| F15 | 0 | 2.769 | 12.46 | 22.17 | 24.96 | 29.15 | 44.41 | 58.3 | 65.29 | 73.67 | 82.06 | 90.46 | 96.1 |
| F16 | 0 | 2.769 | 11.08 | 22.17 | 27.73 | 34.69 | 49.96 | 56.94 | 66.69 | 73.69 | 79.31 | 90.47 | 93.34 |
| F17 | 0 | 6.923 | 12.47 | 19.41 | 27.74 | 34.69 | 43.04 | 50.01 | 59.75 | 66.74 | 76.51 | 83.52 | 93.3 |
| F18 | 0 | 5.538 | 9.698 | 12.48 | 20.8 | 31.9 | 38.86 | 47.21 | 54.18 | 63.94 | 73.7 | 80.7 | 84.95 |
Table 8: _In vitro_ drug release profile of formulation F1- F18.
Kinetic Modeling of the Drug
In this study, we looked at a variety of various release kinetic models including zero order and first order, as well as the Higuchi model and the Korsmeyer Peppas release model.
The Higuchi model offered an acceptable fit to all dissolution profiles in all formulations examined, as shown by the regression coefficient R2 value (0.92<R2<1). Results of the drug release kinetics experiment are shown in the Table 10.
| Sl.no | Batch No | Zero order | First order | Higuchi | Korsmeyer Peppas | ||||
|---|---|---|---|---|---|---|---|---|---|
| R2 | k | R2 | K | R2 | k | n | k | ||
| 1 | F1 | 0.4981 | 0.0938 | 0.4942 | -0.0009 | 0.9782 | 1.3721 | 0.1279 | 1.1712 |
| 2 | F2 | 0.5814 | 0.0974 | 0.5838 | -0.001 | 0.974 | 1.3649 | 0.184 | 1.0947 |
| 3 | F3 | 0.524 | 0.0976 | 0.5265 | -0.001 | 0.9729 | 1.3784 | 0.1452 | 1.1495 |
| 4 | F4 | 0.0179 | -0.1532 | 0.0202 | 0.0018 | 0.9073 | 4.6723 | 0.1439 | 1.3732 |
| 5 | F5 | 0.6732 | 0.1149 | 0.676 | 0.0012 | 0.9478 | 1.4089 | 0.2451 | 1.0447 |
| 6 | F6 | 0.5047 | 0.0955 | 0.5082 | -0.001 | 0.9761 | 1.3752 | 0.1356 | 1.1639 |
| 7 | F7 | 0.4799 | 0.0939 | 0.4821 | -0.001 | 0.9786 | 1.3814 | 0.1284 | 1.1779 |
| 8 | F8 | 0.7669 | 0.127 | 0.7691 | -0.0013 | 0.9332 | 1.4371 | 0.3946 | 0.8978 |
| 9 | F9 | 0.7244 | 0.1231 | 0.7265 | -0.0012 | 0.9375 | 1.4338 | 0.3813 | 0.9125 |
| 10 | F10 | 0.711 | 0.1147 | 0.7136 | -0.0012 | 0.9419 | 1.39 | 0.286 | 0.9878 |
| 11 | F11 | 0.6465 | 0.1089 | 0.6495 | -0.0011 | 0.9548 | 1.3844 | 0.2046 | 1.0801 |
| 12 | F12 | 0.7773 | 0.138 | 0.7794 | -0.0014 | 0.9356 | 1.4866 | 0.4865 | 0.8402 |
| 13 | F13 | 0.818 | 0.1527 | 0.8198 | -0.0015 | 0.9461 | 1.5033 | 0.5882 | 0.6383 |
| 14 | F14 | 0.736 | 0.1355 | 0.7377 | -0.0014 | 0.9368 | 1.4931 | 0.4889 | 0.8411 |
| 15 | F15 | 0.7773 | 0.138 | 0.7794 | -0.0014 | 0.9356 | 1.4866 | 0.4865 | 0.8402 |
| 16 | F16 | 0.8402 | 0.1454 | 0.8421 | -0.0015 | 0.9432 | 1.4608 | 0.4674 | 0.6331 |
| 17 | F17 | 0.8396 | 0.144 | 0.8415 | -0.0015 | 0.9275 | 1.4947 | 0.5239 | 0.8013 |
| 18 | F18 | 0.7966 | 0.1261 | 0.7988 | -0.0013 | 0.9271 | 1.429 | 0.3662 | 0.9095 |
Table 9: Kinetic modeling of drug.
When the concentration of polymer is changed, it has minimal influence on the regression result R2. Because the Higuchi model best predicts the cumulative percentage drug release of a matrix drug system, it is reasonable to assume that the drug is released via diffusion and erosion rather than zero order. The drug release data were fitted to the Korsmeyer-Peppas equation using the method of investigating the mechanism of drug release. Diffusion exponent “n” was found to have values ranging from 0.1279 to 0.5882. Fickian diffusion was shown to be responsible for the release of the drug from the developed matrix tablets, according to the results (highuchi matrix).
In Vitro Buoyancy Studies
The tablets were made using an effervescent process in which sodium bicarbonate was used as a gas-generating ingredient. In the presence of a dissolving media, sodium bicarbonate stimulated carbon dioxide production (0.1 N HCl). The gas created is confined and protected inside the gel formed by the hydration of the polymer, resulting in a reduction in the density of the tablet. When the density of the tablet goes below 1g/ml, the tablet turns buoyant. The 10.8 percent (40 mg) content of sodium bicarbonate in each formulation results in a floating duration time ranging between 9±0.1 to 12.5±0.1 hrs with the exception of F18 and F16, where the values are much lower than 9 hours. In conclusion, the sodium bicarbonate concentration described above is optimal for achieving a typical floating duration time. It can be concluded that the concentration of sodium bicarbonate mentioned above is ideal in order to create a typical floating duration time (Table 11).
| F3 | Duration of Time | |||
|---|---|---|---|---|
| Formulation Parameters | Initial | 1 Month | 2 Month | 3 Month |
| Appearance | White | White | White | White |
| % Weight Variation | 1.8±0.31 | 2.0±0.23 | 1.9±0.44 | 2.5±0.04 |
| Hardness | 5.5±0.33 | 5.4±0.66 | 5.4±0.66 | 5.5±0.33 |
| % CDR | 99.6±0.013 | 99.13±0.031 | 98.83±0.018 | 99.93±0.02 |
Table 10: Stability study data.
Conclusion
An oral CNZ sustained release flotation tablet formulation was the subject of the current investigation, which focused on the development and characterization of the formulation. It was necessary to conduct pre-formulation research, and the viability of a drug sample was tested according to normal methodology. In order to develop floating tablet formulations, a range of polymers, including CMC sodium, XG, and SA, was used in the direct compression with model drug to produce floating tablet formulations. When used in this application, sodium bicarbonate, a gas-generating agent, is used. Pharmaceutical standards determined that the manufactured tablets of batches F1, F2, and F3, F6, and F7 had an acceptable range of weight variation, friability, thickness, hardness, and drug content, as well as acceptable range of weight variation.
In the context of in-vitro drug release, the floating behavior of optimized batches was explored further. It is possible to obtain a release rate of 92 percent to 99.8 percent in as little as 12 hours if selected batches are used. Furthermore, the high-quality batches of prepared matrix tablets had excellent swelling behavior after 10 hours and retained the integrity of the formulation for more than 24 hours, showing that they were of high quality. The stability research profile of the optimized formulation indicated that F3 was the most stable in terms of appearance; percent weight variation, hardness, and percent CDR, among other characteristics.
Conflict of Interest
The authors declare no Conflict of interest
References
-
Pavan M, Prasanth VV, Sharma A, Chauhan A, Mathappan R, et al. (2014) Formulation and evaluation of dicloxacillin sodium floating tablets. Journal of pharmacy and pharmaceutical sciences 3(2): 7-15.
-
Singh BN, Kim KH (2000) Floating drug delivery systems an approach to oral controlled drug delivery via gastric retention. Journal of Controlled release 63(3): 235-259.
-
Kaur N Pharmaceutical Sciences.
-
Dave BS, Amin AF, Patel MM (2004) Gastroretentive drug delivery system of ranitidine hydrochloride: Formulation and in vitro evaluation. American Association Pharmaceutical Scientist Technology 5(2): 77-82.
-
Sharma S, Prashar M, Sahu RK (2015) Floating drug delivery system incredible revolution. Pharmacology 3: 1039-1054.
-
Neal MJ (2020) Medical pharmacology at a glance. 9th (Edn.), Wiley, pp: 128.
-
Raghuvanshi S, Pathak K (2014) Recent advances in delivery systems and therapeutics of cinnarizine a poorly water soluble drug with absorption window in stomach. Journal of Drug Delivery 2014.
-
Csiernik R (2019) The Essential Guide to Psychoactive Drugs in Canada A Resource for Counselling Professionals. 2nd (Edn.), Canadian Scholars Press.
-
Opavsky J (1991) Magnesium and its combination with cinnarizine in the long-term treatment of headache. Acta Universitatis Palackianae Olomucensis Facultatis 131: 157-164.
-
Shahba AAW, Mohsin K, Alanazi FK (2012) Novel self nanoemulsifying drug delivery systems SNEDDS for oral delivery of cinnarizine design optimization and in vitro assessment. American Association of Pharmaceutical Scientists Technology 13(3): 967-977.
-
Molke M, Iqbal M, Rao K (2010) Formulation and evaluation of verapamil HCl gastroretentive floating tablet from matrices prepared using Compritol ATO 888. Research Journal of Pharmaceutical Biological and Chemical Sciences 1(3): 422-430.
-
Haress NG (2015) Cinnarizine comprehensive profile. Profiles of Drug Substances Excipients and Related Methodology 40: 1-41.
-
Betala S, Varma MM, Abbulu K (2018) Formulation and evaluation of polymeric nanoparticles of an antihypetensive drug for gastroretention. Journal of drug delivery and therapeutics 8(6): 82-86.
-
Rao KRK, Lakshmi KR (2014) Design development and evaluation of clopidogrel bisulfate floating tablets. International journal of pharmaceutical investigation 4(1): 19-26.
-
Rompicherla NC, Bera D, Sakhia D, Manavadaria K, Shetty NG, et al. (2012) Formulation and evaluation of bilayer floating tablets of Diltiazem hydrochloride for bimodal release. International Journal of Research in Pharmaceutical Sciences 3(2): 301-306.
-
Strondl A, Lyskfeldt O, Brodin H, Ackelid U (2015) Characterization and control of powder properties for additive manufacturing. Jom 67: 549-554.
-
Nagarwal RC, Ridhurkar DN, Pandit JK (2010) In vitro release kinetics and bioavailability of gastroretentive cinnarizine hydrochloride tablet. AAPS Pharm Sci Tech 11(1): 294-303.
- Potential Medicinal Herbs and Secondary Metabolites in Combating Corona Virus
- Monkeypox and its Clinical Implications in Pregnancy
- Pharmacognostical Analysis of the Leaves of Important Nervine Medicinal Plant: Strychnos Nux-Vomica L
- Assessment of Antibacterial Activity of Various Solvent Extracts of Dictyota Dichotoma Against Multidrug Resistant Bacterial Strain
- An Insights of Bioactive Elements on Malignancy: Mechanistic Avenues
- Advances and Future Directions in Pharmacognosy and Chinese Medicine