Temporal and Spatial Microalgae Diversity in Lake Bishoftu- Guda/ Babugaya, Ethiopia
Spatio-temporal variations in microalgae distribution are widely affected by water physico- chemical factors such as To, salinity, pH, nitrate, nitrite, ammonia, silicate and IP. The effect of these factors on microalgae community changes species composition and their diversity in the fresh water ecosystem. Stratified random sampling design was conducted in Lake Babogaya of Ethiopia from 2017- 2018 to assess the spatial and temporal diversity of microalgae. 120 samples were collected in dry season (February to march), flowering season (September to November), wet season and (July to August) from Lake Babogaya. Water samples were collected seasonally from selected sites using sterile glass bottles starting from site one in offshore by considering depth and representativeness of the sample for the sites. Water temperature and pH and water transparency (SD) was determined. Lake Babogaya had the average water temperature 18.75°C during wet season, 26.6°C during flowering season, 23.55°C during dry season and SD of the lake ranged from 35cm (flowering season) to 194cm (dry season. High pH values were recorded in dry season (9.1) followed by flowering season (9.0) and then wet season (8.5) in Lake Babogaya. All sites in Lake Babogaya have consistency values of pH in all three season. A total of 52 microalgae genera/ species belonging to 7 phyla were identified at the eight sites during the three seasons (wet, flowering and dry) (Table 3). Chlorophyta was the most dominant phylum in all three seasons with 28 species representing 53.84 % followed by Cyanophyta (10 species, 19.23%) and Bacillariophyta (7 species, 13.46%). In the present study microalgae species number is high in wet season (n=39) this may be due to clarity of water (low turbidity) that transmit the light and the suitable temperature. Cloth washing, bathing and grazing site was the richest in terms of species diversity with 43 microalgae genera and followed by Adulala resort with 41 microalgae genera and youth center was the least diversed site with 22 microalgae genera. In the present study the most dominant species and the relative abundance of species in each seasons were Chrococcus (wet season) (Y=75.5, RA=18.4), Oocystis lacustis (flowering season) (Y= 123.48, RA=34.78) and Chlamydomonas species (dry season) (Y=74, RA=28.57). All the eight sites had almost same types of microalgae species. The Shannon equitability values were 0.7, 0.67 and 0.7 for wet, flowering and dry seasons respectively. The Shannon diversity indices were 3.26, 2.91 and 3.04 during wet, flowering and dry seasons respectively. In all three seasons high diversity index was showed during wet season and lower diversity was showed in flowering season. Significance difference were recorded between seasons and among sampling sites and correlation between seasons are significant at p
Introduction
Rich natural resources that occur within the environment are characterized by having greater biodiversity [1, 2, 3]. Microalgae are the major primary producers in many aquatic systems and are an important food for consumers. They are photosynthesizing microscopic organisms that inhabit the upper sunlit layer of almost all oceans and bodies of freshwater. They are agents for primary production, the creation of organic compounds from carbon dioxide dissolved in the water a process that sustain the aquatic food web [4]. They are responsible for much of photosynthetic activity on the Earth and hence responsible for the oxygen presents in the Earth’s atmosphere [5, 6]. They are one of the major biological components of aquatic ecosystems, play important roles in water bodies, not only as primary producers and hence as the base of food chains, but also as one of the dependable indicators of lake fertility and environmental changes.
The diversity of a microalgae community can be used to characterize its structure (number of species present, their physiological properties and by the genetic potential of the organisms making up the community) [7]. Understanding the chemical and physical factors controlling population dynamics of phytoplankton is essential for the understanding of how human activities affect water quality of freshwater ecosystems [8, 9]. The seasonal fluctuations in phytoplankton abundance and species composition in any water body is due to differential response of different species to changing levels of light, temperature, nutrients, grazing pressure, onset of parasitic infection, extracellular metabolites of plants and animals with a change in season during a course of year [10]. According to Reynold [11], seasonal changes in a natural phytoplankton community are best interpreted as alterations between true succession and intermediate disturbances (such as floods, episodes of increased wind mixing or they are biotic, including factors like grazing). Therefore, it may be expected that structurally stable lakes follow rather gradual seasonal changes. However, such seasonal changes may be overridden in lakes subject to intermediate disturbances.
As there is some indication that temporally variable disturbances increase diversity [12, 13]. Spatial and temporal variations in microalgae distribution are widely affected by the water chemical and physical factors such as temperature, salinity, pH, nitrate, nitrite, ammonia, silicate and IP. The influence of these factors on microalgae community changes species composition and their diversity in the fresh water ecosystem [14].
Compared to many other countries in the world, Ethiopia is gifted with a large number of standing water bodies, whose sustainable use can contribute to the economy of the country. The lakes are critical to the survival of local communities as they are the actual and potential sources of food and income. Furthermore, their range of variations in morphometry, physical and chemical features offers opportunities for superb comparative limnological studies. Some studies have been done regarding the Phytoplankton composition, biomass and primary productivity of Ethiopian rift valley lakes [15, 16]. According to Zinabu Gebremariam [17], the close proximity of urbanization and human settlement to Ethiopian lakes is among the greatest potential causes of changes in water quality.
Lake Babogaya surrounded by a fast growing town, Bishoftu and its shores are used for washing clothes, watering livestock and recreation and the like. The growing population and the agricultural practices around the lake have serious impacts on the lakes. It is possible for the wastes from these sources to find their way to the lake and cause eutrophication and also could lead to changes in the physico-chemical limnological features of the lake resulting in the disruption of the lake ecosystem, with consequent changes in the species composition and photosynthetic production of phytoplankton. And also Shoreline modifications made on almost all sides of the lake for various purposes (e.g. for the construction of resort hotels and residences in the catchments) introduce enormous amounts of particulate wastes, which form suspensions in the water column thereby reducing light penetration at least in the near-shore regions of the lakes. These activities could lead to changes in the physico- chemical limnological features of the lake resulting in the disruption of the lake ecosystem, with consequent changes in the species composition and photosynthetic production of phytoplankton. It is also possible that degradation of this aquatic ecosystem may go on unnoticed for a long time and eventually result in unexpected disastrous effects. The lake is critical to the survival of local communities as they are the actual and potential sources of food and income.
Despite their importance, the limnology of the two Ethiopian lakes is unexplored/ has not received attention in spite of its potential economic importance. So, the purpose of this research study was, therefore to study the temporal and spatial microalgae dynamics in Lake Babogaya.
Materials and Methods
Description of the Study Area
Lake Babogaya is one of the crater lakes located 47 km southeast of Addis Ababa in Bishoftu town, within the main Ethiopia rift valley lake. Lake Babogaya found at an altitude of 1869. Like the other volcanic crater lakes of the area, Lake Babogaya is a closed system surrounded by very steep and rocky hills. The vertical distance from the lake's surface to the crater rim is 20 m, and this affords moderate protection from wind [18].
Study design and Sample size
Stratified random sampling design was conducted in Lake Babogaya of Ethiopia from 2017- 2018 to assess the spatial and temporal diversity of microalgae. 120 samples were collected in dry season (February to march), flowering season (September to November), wet season and (July to August= less rain during sampling) from Lake Babogaya. The sampling stations for Lake Babugaya were selected based on high human and animal intervention sites (near-shore station), Recreational sites/resorts and free intervention sites. Physical parameter data like pH (pHep pocket size pH meter, HANNA), temperature and Secchi depth were the most important steps for proper sampling. GPS (AndroiTS GPS Test Pro) was used to define the sites.
Sampling collection and laboratory analysis
Samples of water were collected seasonally from selected sites (Table 1) using sterile glass bottles starting from site one in offshore by considering depth and representativeness of the sample for the sites. Water temperature and pH readings were obtained in the field at each sampling site using a portable multi-probe (pHep pocket size pH meter, HANNA) while water transparency (SD) was determined using Secchi disk. The fresh water sample was fixed with 1ml of 4% of formaldehyde solution (purchased from a local pharmacy). Then the mixture was allowed to settle for 24h. Then, water samples were transported to the laboratory for identification of microalgal genera/ species. Preserved water samples were examined using inverted microscope (WILD M 40), at a magnification of x40. Genera/ species identification was done by placing six drops of water on a glass slide until no more new microalgae species found. The identification to genus or species level was made on the basis of various descriptors of microalgae [19, 20].
| S | ites for lake Babugay | a | Sample Collection sites | ||
|---|---|---|---|---|---|
| Site 1 | Bahir hayl | ||||
| Site 2 | Lisak resort | ||||
| Site 3 | Adulala resort | ||||
| Site 4 | Babugaya resort | ||||
| Site 5 | Youth center | ||||
| Site 6 | ILRI (free intervention) | ||||
| Site 7 | Center (free intervention) | ||||
| Site 8 | Cloth washing, bathing and grazing |
Table 1: sample collection sites of Lake Babugaya, Bishoftu. Data Analysis
Spatial and temporal variation in the composition of microalgae species was assessed by analysis of variance (ANOVA) using SPSS 20. Differences were considered significant at p< 0.05 (95%) confidence level. The abundance of the species were got by counting microalgae species observed using microscope (frequency of each species). Microalgal dominance species and relative abundance were analyzed by calculating diversity indices (DI) Shannon Diversity Index (H) The Shannon diversity index was calculated by following Odum [21].
Diversity Index (H) = – Σ Pi ln Pi, Where Pi = S / N S = Number of individuals of one species N = Total number of all individuals in the sample In = Logarithm to base e Similarly the Evenness Index (EH) was calculated by following Pielou [22]. EH= H/Hmax, Where H max is the maximum value of diversity: Hmax= (lnS) Dominant species were determined using Equation (Lampitt, et al. [23])
Y = (ni/N) fi Where ni= denotes the number of algae of species i N= the total number of algae in the sample fi= denotes the frequency of the species i appearing in the sample Y > 0.02 indicates dominant species. Relative abundance RA= total no of individual of species/total no of individual of all species recorded*100
Results and Discussion
Seasonal and temporal variation of pH, temperature and transparency (SD)
The seasonal and temporal values of pH, temperature and transparency (SD) recorded among the sampling sites within the study period are presented in Tables 2 and 3. Lake Babogaya had the average water temperature 18.75°C during wet season, 26.6°C during flowering season, 23.55°C during dry season and SD of the lake ranged from 35cm (flowering season) to 194cm (dry Sampling site season temperature pH SD( transparency) 1 1 18.00 8.7 71 1 2 23.20 9.0 67 1 3 20.00 9.1 42 2 1 19.50 8.7 71 2 2 23.20 9.0 76 2 3 21.10 9.1 40 3 1 18.50 8.6 67 3 2 24.30 9.0 65 3 3 24.70 9.1 40 4 1 18.50 8.6 57 4 2 24.00 9.0 42 4 3 24.70 9.1 194 5 1 18.50 8.6 68 5 2 23.70 9.0 183 5 3 25.30 9.1 43 6 1 18.50 8.5 65 6 2 23.40 9.0 35 6 3 26.00 9.1 150 7 1 18.50 8.5 67 7 2 26.70 9.0 153 7 3 23.80 9.1 42 8 1 19.00 8.5 65 8 2 30.00 9.0 147 8 3 25.50 9.1 45 season. This finding was consistent with the finding of Brook Lemma (2009) the SD transparency was (140–160 cm) in L. Bishoftu-Guda and L. Hora-Arsedi (47–68 cm). High pH values were recorded in dry season (9.1) followed by flowering season (9.0) and then wet season (8.5) in Lake Babogaya. All sites in Lake Babogaya have consistency values of pH in all three season. The pH values of Lake Babogaya are comparable to those of Lake Bishoftu (9.20; Zinabu [17]) and the Rift Valley Lake Chamo (8.53 to 9.44; Eyasu [24]). The pH values of Lake Babogaya was different from Lake Arenguade in Ethiopia (Talling, et al. [25]), which has pH values between 9.5- 10.50 that tend to remain at high levels owing to the high buffering capacity of the lake waters [25]. A PH range of 6.5 to 8.5 is acceptable for aquatic biota according to the APHA [26]. Although the present Secchi depth readings of the lake are much lower than those reported for the same lake, for Lake Babogaya (1.48 to 4.46 m; Yeshiemebet Major [27]). The maximum water temperatures of Lake Babogaya are closer to Lake Hawassa (23.8 to 28.4°C) [15]) and Lake Chamo (26-30°C) [28].
Note: sampling sites (from 1-8), season (1=wet, 2=flowering, 3=dry). Table 2: Water pH, water temperature and water transparency (SD) in the temporal (wet, flowering and dry) and spatial dimension (from site 1-8) from the selected sampling sites inside lake Babugaya.
Spatial and temporal distribution of Microalgae
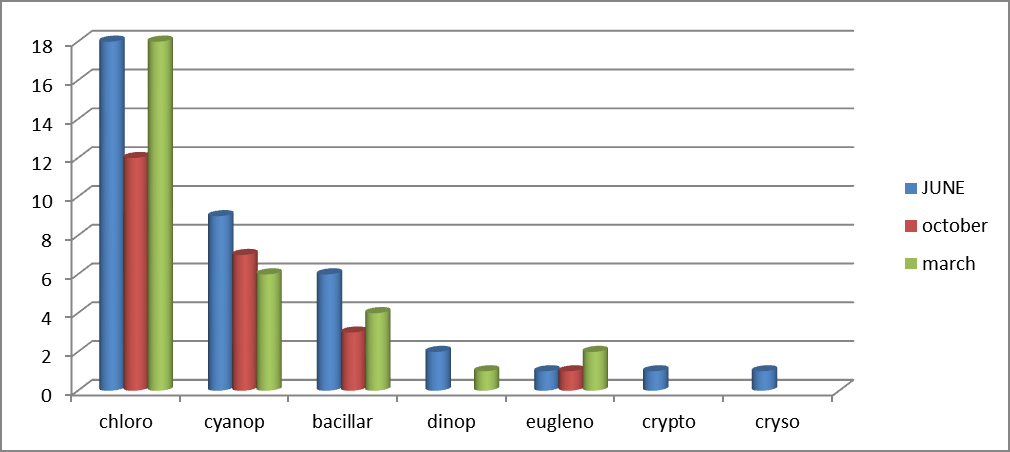
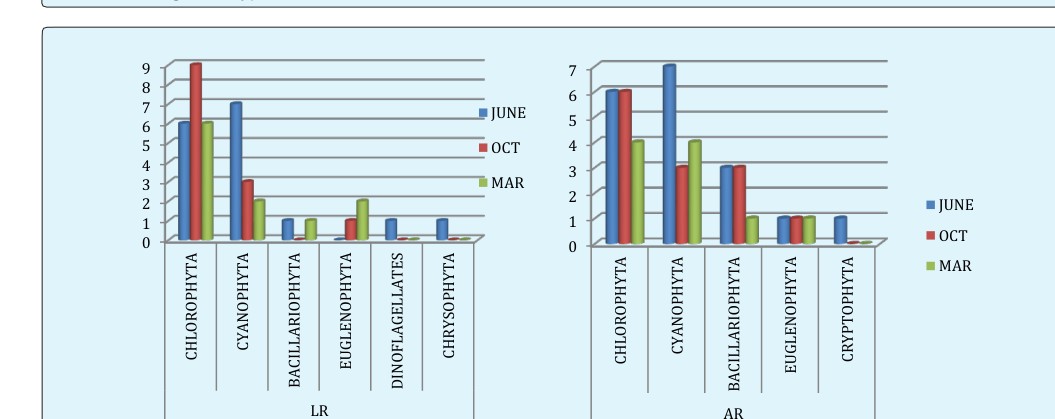
A total of 52 microalgae genera/ species belonging to 7 phyla were identified at the eight sites during the three seasons (wet, flowering and dry) (Table 3). Chlorophyta was the most dominant phylum in all three seasons with 28 species representing 53.84 % followed by Cyanophyta (10 species, 19.23%) and Bacillariophyta (7 species, 13.46%). This is inconsistent with the findings of Yeshiemebet [27] indicated the dominance of Dinoflagellates and Bacillariophyta (diatoms) and Wood and Tailing [29] finding showed that the dominance of blue-green algae, particularly of Microcystis aeruginosa in Lake Bishoftu-Guda. According to Shariff [30] Chlorophyta have the ability to live in wide range of nutrients and physical environments. They are considered opportunistic for their small size and rapid growth, favoring its presence in any season of the year [31].
In the present study microalgae species number is high in wet season (n=39) this may be due to clarity of water (low turbidity) that transmit the light and the suitable temperature. A study by Hofmann [32] in lake showed that phytoplanktons were greatly reduced in numbers and abundance following heavy precipitation. Cloth washing, bathing and grazing site was the richest in terms of species diversity with 43 microalgae genera and followed by Adulala resort with 41 microalgae genera and youth center was the least diversed site with 22 microalgae genera. These two sites had flood inflows and a lot of anthropogenic activities like washing clothes, bathing and grazing of animals. Due to these detergents, animal and human wastes wash in to the water. This may increase availability of nutrients from human and animal wastes, cloth washing (using detergents) and fertilizer that wash into water. That would be the reason these sites were dominated by cyanophytes taxa mostly in wet seasons when there was rain and flood. According to Congressional Report HR, [33] the principal source of effluent phosphorus was from phosphates used in laundry detergents. Overloading of phosphorus is usually considered as the primary causation, which leads to significant shifts in phytoplankton species composition towards bloom-forming cyanobacterial domination [34].
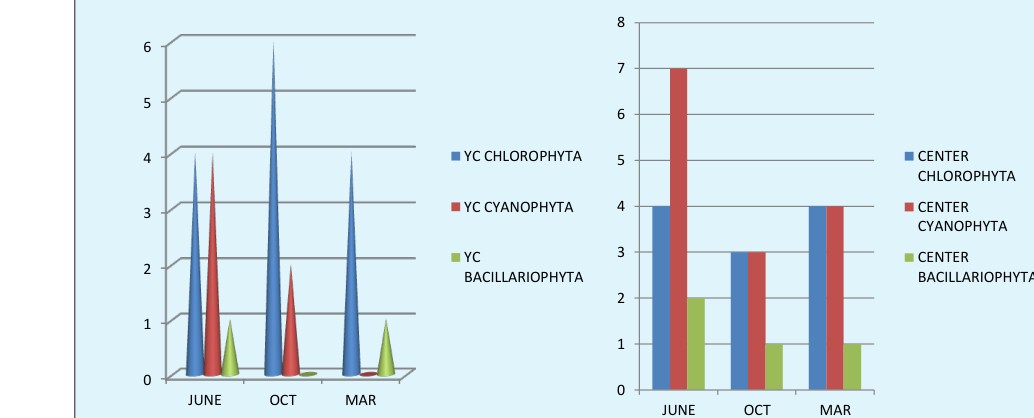
Youth center, Bahir hayl and Cloth washing, bathing and grazing (intervention) sites were dominated by Chlorophyta in flowering and dry seasons. Sites like Center (free intervention), ILRI, Lisak resort, Babogaya resort and Adulala resort were dominated by Cyanophyta in wet season but Cyanophyta and Chlorophyta were variably dominant in flowering and dry season (Figures 1- 5). In the present study the most dominant species and the relative abundance of species in each seasons were Chrococcus (wet season) (Y=75.5, RA=18.4), Oocystis lacustis (flowering season) (Y= 123.48, RA=34.78) and Chlamydomonas species (dry season) (Y=74, RA=28.57) (Table 4).
All the eight sites had almost same types of microalgae species. The Shannon equitability values were 0.7, 0.67 and 0.7 for wet, flowering and dry seasons respectively. The highest numbers of species (19 and 14) were recorded during wet and flowering season respectively at the site of human and animal intervention and in dry season the highest numbers of species were recorded at the site of ILRI (16). The least microalgae species number were recorded at the sites of youth center during dry season. Furthermore, regardless of the study site, the dominant phyla were Chlorophyta, which had more number of species that occurred throughout the year. The Shannon diversity indices were 3.26, 2.91 and 3.04 during wet, flowering and dry seasons respectively. In all three seasons high diversity index was showed during wet season and lower diversity was showed in flowering season. In accordance with Cavalcanti and Larrazábal [35], the Shannon diversity can be assessed as very low values lower than 1.0, low (between 2.0 and 1.0), medium (between 3.0 and 2.0) and high (above 3.0). According to these criteria, the diversity of the microalgae community recorded during wet and dry season can be classified as high and flowering season was classified as medium. Several studies have shown that a high diversity index indicates that the ecosystem is in a healthy and stable state, while a low value suggests a less healthy or degraded ecosystem [36]. Significance difference were recorded between seasons and among sampling sites and correlation between seasons are significant at p <0.05.
| phylum | Identified species/genera | Study periods | ||||
|---|---|---|---|---|---|---|
| June-July | October-November | March- April | ||||
| Chlorophyta | Oocystis spp. | x | - | - | ||
| Chlamydomonas | x | x | x | |||
| Cosmarium depressum | x | - | - | |||
| Tetraedron minimum | x | x | x | |||
| Peridinium cinctum | x | - | - | |||
| Selenastrum bibraianum | x | x | x |
Table 2: Microscopically identified microalgae genera/ species from eight sites during three seasons, Lake Babugaya.
| Oocystis nodulasa | x | - | - | |
|---|---|---|---|---|
| Cosmarium spp. | x | - | x | |
| Scenedesmus spp. | x | x | - | |
| Acanthosphaera spp. | x | - | x | |
| Gotenkina paucispina | x | - | x | |
| Franceia droescheri | x | - | - | |
| Chlorella spp. | x | - | - | |
| Pediastrum spp. | x | - | - | |
| Heamatococcus spp. | x | - | - | |
| Cosmarium obsoluta | x | - | - | |
| Scenedesmus arcutas | x | - | - | |
| Oocystis solitaria | x | x | x | |
| Oocystis lacustis | - | x | - | |
| Chlorocccocum spp. | - | x | x | |
| Monoraphidiun spp. | - | x | - | |
| Scenedesmus acuminates | - | x | - | |
| Tetraspora spp. | - | x | - | |
| Eudorina spp. | - | x | x | |
| Asterionella spp. | - | - | x | |
| Scenedesmus quadricauda | - | - | x | |
| Scenedesmus dimorphus | - | - | x | |
| Scenedesmus obtusus | - | - | x | |
| Cyanophyta | Aphanozomenon spp. | - | x | - |
| Merismopedia spp. | x | - | - | |
| Gloeocapsa spp. | x | x | x | |
| Pseudanabena spp. | x | x | x | |
| Microcystis spp. | x | x | x | |
| Aphanocapsa spp. | x | - | - | |
| Merismopedia glauca | x | - | - | |
| Chrococcus spp. | x | x | x | |
| Cylindrospermopsis spp. | x | x | - | |
| Microcystis aeruginosa | x | x | x | |
| Bacillariophyta | Chodatella longiseta | x | x | x |
| Cyclotella spp. | x | - | x | |
| Fragilaria spp. | x | x | - | |
| Nitzschia spp. | x | x | x | |
| Navicula spp. | x | x | x | |
| Chodatella subsalsa | x | - | - | |
| Synedra spp. | - | - | x | |
| Euglinophyta | Phacus longicauda | x | - | x |
| Euglena spp. | - | x | x | |
| Dinoflagellates | Peridinium bipes | x | - | - |
| Glenodinium spp. | x | - | x | |
| Peridinium spp. | - | - | x | |
| Chrysophyta | Chrysoamoeba spp. | x | - | - |
| Cryptophyta | Cryptomonad spp. | x | - | - |
Table 3: Microscopically identified microalgae genera/ species from eight sites during three seasons, Lake Babugaya.
Note:-x= microalgae presents in three season, -= absence of microalgae in three seasons. Table 3: Microscopically identified microalgae genera/ species from eight sites during three seasons, Lake Babugaya.
Wet season microalgae species phyla fi/frequency Y(dominant) RA(relative abundance) Oocystis spp Chlorophyta 53 5.579 10.526 Chlamydomonas Chlorophyta 263 55.37 21.053 Cosmarium depressum Chlorophyta 66 3.474 5.2632 Tetradron minimum Chlorophyta 314 66.11 21.053 Merismopedia Cyanophyta 63 11.61 18.421 Peridinium cinctum Chlorophyta 36 0.947 2.6316 Gloeocapsa Cyanophyta 169 31.13 18.421 Pseudanabena Cyanophyta 27 4.974 18.421 Chodatella longiseta Bacillariophyta 22 1.158 5.2632 Microcystis Spp Cyanophyta 40 6.316 15.789 Selenastrum bibraianum Chlorophyta 148 3.895 2.6316 Aphanocapsa Cyanophyta 5 0.263 5.2632 Oocystis nodulasa Chlorophyta 29 0.763 2.6316 Cosmarium Chlorophyta 157 33.05 21.053 Merismopedia glauca Cyanophyta 12 0.632 5.2632 Scenedesmus Chlorophyta 13 0.342 2.6316 Acanthosphaera Chlorophyta 1 0.026 2.6316 Gotenkina paucispina Chlorophyta 3 0.079 2.6316 Peridinium bipes Dinoflagellate 4 0.105 2.6316 Chrococcus Cyanophyta 410 75.53 18.421 Glenodinium Dinoflagellate 5 0.132 2.6316 Chrysoamoeba Chrysophyta 2 0.053 2.6316 Cylindrospermopsis Cyanophyta 16 2.105 13.158 Franceia droescheri Chlorophyta 1 0.026 2.6316 Microcystis aeruginosa Cyanophyta 7 0.553 7.8947 Cyclotella Bacillariophyta 8 1.263 15.789 Fragilaria Bacillariophyta 5 0.132 2.6316 Nitzschia Bacillariophyta 1 0.026 2.6316 Chlorella Chlorophyta 1 0.026 2.6316 Pediastrum Chlorophyta 1 0.026 2.6316 Heamatococcus Chlorophyta 1 0.026 2.6316 Cryptomonad Cryptophyta 1 0.026 2.6316 Navicula Bacillariophyta 1 0.026 2.6316
| Phacus longicauda | Euglinophyta | 4 | 0.105 | 2.6316 |
|---|---|---|---|---|
| Cosmarium obsoluta | Chlorophyta | 10 | 0.263 | 2.6316 |
| Chodatella subsalsa | Bacillariophyta | 1 | 0.026 | 2.6316 |
| Scenedesmus arcutas | Chlorophyta | 3 | 0.079 | 2.6316 |
| Oocystis solitaria | Chlorophyta | 13 | 0.342 | 2.6316 |
Flowering season microalgae species phyla fi/frequency Y(dominant) RA(Relative abundance) Tetraedron minimum Chlorophyta 57 17.348 30.43478 Oocystis solitaria Chlorophyta 168 58.435 34.78261 Oocystis lacustis Chlorophyta 355 123.48 34.78261 Chodatella Chlorophyta 16 2.7826 17.3913 Chloroccocum Chlorophyta 5 0.4348 8.695652 Selenastrum Chlorophyta 1 0.0435 4.347826 Monoraphidiun Chlorophyta 6 0.5217 8.695652 Scenedesmus Chlorophyta 6 0.5217 8.695652 Scenedesmus acuminatus Chlorophyta 5 0.4348 8.695652 Tetraspora Chlorophyta 3 0.2609 8.695652 Chlamydomonas Chlorophyta 5 0.4348 8.695652 Eudorina Chlorophyta 3 0.2609 8.695652 Gloeocapsa Cyanophyta 39 8.4783 21.73913 Microcystis Spp. Cyanophyta 166 50.522 30.43478 Microcystis aeruginosa Cyanophyta 14 3.0435 21.73913 Chrococcus minutus Cyanophyta 1 0.0435 4.347826 Aphanozomenon Cyanophyta 14 3.0435 21.73913 Cylindrospermopsis Cyanophyta 2 0.087 4.347826 Pseudanabena Cyanophyta 1 0.0435 4.347826 Nitzschia Bacillariophyta 1 0.0435 4.347826 Fragilaria Bacillariophyta 3 0.2609 8.695652 Navicula Bacillariophyta 7 0.913 13.04348 Euglena Euglinophyta 12 2.087 17.3913 Dry season microalgae species Phyla fi Y(dominance) RA Selenastrum Chlorophyta 199 56.9 28.57 Chlamydomonas Chlorophyta 259 74 28.57 Eudorina Chlorophyta 9 0.32 3.571 Tetradron minimum Chlorophyta 26 1.86 7.143 Chloroccocum Chlorophyta 15 2.14 14.29 Gotenkina paucispina Chlorophyta 7 0.5 7.143 Oocystis Chlorophyta 2 0.14 7.143 Scenedesmus dimorphus Chlorophyta 11 0.79 7.143 Scenedesmus quadricauda Chlorophyta 3 0.11 3.571 Chodatella Chlorophyta 29 6.21 21.43 Cosmarium Chlorophyta 1 0.04 3.571 Acanthosphaera Chlorophyta 1 0.04 3.571 Scenedesmus obtusus Chlorophyta 1 0.04 3.571 Oocystis solitaria Chlorophyta 14 0.5 3.571 Asterionella Chlorophyta 2 0.14 7.143 Navicula Bacillariophyta 5 0.36 7.143 Cyclotella spp. Bacillariophyta 10 1.43 14.29 Synedra Bacillariophyta 15 1.07 7.143
| Nitzschia | Bacillariophyta | 11 | 0.79 | 7.143 |
|---|---|---|---|---|
| Microcystis aeruginosa | Cyanophyta | 34 | 7.29 | 21.43 |
| Pseudanabena | Cyanophyta | 12 | 0.86 | 7.143 |
| Gloeocapsa | Cyanophyta | 142 | 10.1 | 7.143 |
| Chrococcus | Cyanophyta | 9 | 0.32 | 3.571 |
| Microcystis spp | Cyanophyta | 2 | 0.07 | 3.571 |
| Euglena | Euglinophyta | 31 | 5.54 | 17.86 |
| Phacus | Euglinophyta | 11 | 1.18 | 10.71 |
| Peridinium | Dinoflagellates | 11 | 0.39 | 3.571 |
Table 5: Dominant species and relative abundance of microalgae during three seasons in Lake Babugaya.
Conclusion
In this study, Spatial and Temporal variation of microalgae, dominant species and relative abundance of the lake were observed. The dominant phyla were Chlorophyta, which had more number of species that occurred throughout the year. Chlorophyta have the ability to live in wide range of nutrients and physical environments. They are considered opportunistic for their small size and rapid growth, favoring its presence in any season of the year. Microalgae species number is high in wet season, due to clarity of water (low turbidity) that transmit the light and the suitable temperature. Cloth washing, bathing and grazing site was the richest in terms of species diversity followed by Adulala resort. Youth center was the least diversed site. The highest numbers of species were recorded during wet and flowering season respectively at the site of human and animal intervention and in dry season the highest numbers of species were recorded at the site of ILRI. In all three seasons high diversity index was showed during wet season and lower diversity was showed in flowering season [37, 38, 39]. The Shannon diversity of the microalgae community recorded during wet and dry season can be classified as high and flowering season was classified as medium. Significance difference were recorded between seasons and among sampling sites and correlation between seasons are significant at p <0.05.
Recommendation
Further studies are still needed on the species composition, quantity characteristics and distribution characteristics of the microalgae species in Bishoftu-Guda Lake for the upkeep of biodiversity. Water chemistry of the lake and phytoplankton community structure studies are still needed in order to find factors responsible for biodiversity loss. Freshwater ecosystems have been experiencing declines in biodiversity far greater than terrestrial ecosystems. If trends in human demands for water remain unaltered, species losses will surely continue at current rates. Microalgae can help in removing pollutants from the surroundings, restoring contaminated sites and preventing further pollution. Therefore, conservation and management of lakes ecosystems is critical to the interests of the entire mankind, as long as biodiversity constitutes a valuable natural resource in economic, cultural, aesthetic, scientific and educational terms.
References
-
Henderson HF, Ryder RA, Kudhogina AW (1973) Assessing fishery potentials of lakes and reservoirs. J Fish Board Cand 30(12): 2000-2009.
-
Oglesby RT (1977) Relationship of fish yield to Lake Phytoplankton standing crop, production and morphoedaphic factors. J Fish Res Board Cand 34(12): 2271-2279.
-
Melack JM (1976) Limnology and dynamics of phytoplankton in equatorial African lakes [Dissertation], Duke University, Durham, pp: 453.
-
Ghosal R, Wray SM (2011) The effects of turbulence on phytoplankton. Aerospace Technological Enterprise.
-
NASA (2009) Satellite detects red glow to map global ocean plant health.
-
NASA (2005) Satellite sees ocean plants increase, coasts greening.
-
Elber F, Schanz F (1989) The cause of change in the diversity and stability of phytoplankton community in small lakes. Freshwater boil 21(2): 137-251.
-
Reynolds CS (2006) The ecology of phytoplankton. Cambridge University Press, Cambridge, pp: 1-300.
-
Levinton JS (2013) Marine biology: function, biodiversity, ecology. Oxford University press, New York, pp: 173-193.
-
Adon M, Ouattara A, Gourene G (2011) Seasonal variation in the diversity and abundance of phytoplankton in a small African tropical reservoir. Afr J Microbiol Res 5(18): 2616-2626.
-
Reynolds CS (1988) The concept of ecological succession applied to seasonal periodicity of freshwater phytoplankton. Verh Int Ver Limnol 23(2): 683-691.
-
Gaedeke A, Sommer U (1986) The influence of the frequency of periodic disturbances. Oecologia 71(1): 98-102.
-
Padisák J, Tóth LG, Rajczy M (1988) The role of storms in the summer succession of the phytoplankton community in a shallow lake (Lake Balaton, Hungary). J Plankton Res 10(2): 249-265.
-
Madhu NV, Jyothibabu R, Balachandran KK, Honey UK, Martin GD, et al. (2007) Monsoonal impact on planktonic standing stock and abundance in a tropical estuary (Cochin Backwaters-India) Estuar. Coast Shelf Sci 73(1-2): 54-64.
-
Demeke Kifle (1985) Variation in phytoplankton primary production in relation to light and nutrients in Lake Awassa, MSc. Thesis, Addis Ababa University, pp: 108.
-
Girma Tilahun (1988) A Seasonal study on phytoplankton primary production in relation to light and nutrients in Lake Ziway. MSc. Thesis, Addis Ababa University pp: 62.
-
Zinabu GM (1994) Long-term changes in indices of chemical and productivity status of a group of tropical Ethiopian lakes, with differing exposure to human influence. Arch Hydrobiologia 132(1): 115-125.
-
Baxter RM (2002) Lake Morphometry and chemistry. Ethiopian Rift Valley lakes. In: Tudorancea C & Taylor WD (eds.), Backh Publishers, Leiden, The Netherlands, pp: 45-60.
-
John D, Robert G (2002) Freshwater Algae of North America Ecology and Classification. A volume in Aquatic Ecology. ISBN: 978-0-12-741550-5.
-
Bellinger EG, Sigee DC (2010) ‘Freshwater Algae: Identification and Use as Bioindicators.’ (Wiley: Chichester, UK).
-
Odum E (1969) The strategy of ecosystem development. Science 164(3877): 262-270.
-
Pielou E (1967) The use of information theory in the study of the diversity of biological pollutions. Symp Math Stat Prob 4: 163-177.
-
Lampitt RS, Wishner KF, Turley CM, Angel MV (1993) Marine snow studies in the Northeast Atlantic Ocean: Distribution, composition and role as a food source for migrating plankton. Mar Biol 116: 689-702.
-
Eyasu S (2004) The temporal and spatial variations in the biomass and photosynthetic production of phytoplankton in relation to some physico- chemical variables in Lake Chamo Ethiopia. M.Sc. Thesis, Addis Ababa University, Addis Ababa pp: 72.
-
Talling J, Lemoalle J (1998). Ecological dynamics of tropical inland waters. Cambridge University Press: pp: 441.
-
[APHA] American Public Health Association (1999) Standard methods for the examination of water and waste water, APHA-AWWA-WEF, New York, pp: 1325.
-
Yeshiemebet Major (2006) Temporal changes in the community structure and photosynthetic production of phytoplankton in Lake Babogaya, Ethiopia. MSc Thesis, School of Graduate Studies, Addis Ababa University, Addis Ababa, pp: 94.
-
Shumbulo E (2004) The temporal and spatial variations in the biomass and photosynthetic production of phytoplankton in relation to some physico-chemical variables in Lake Chamo Ethiopia. MSc. Thesis, Addis Ababa University, Addis Ababa, pp: 72.
-
Wood RB, Tailing JF (1988) Chemical and algal relationships in a salinity series of Ethiopian inland waters. Hydrobiologia 158: 29-67.
-
Shariff M (2014) Littoral and Limnetic Phytoplankton Distribution and Biodiversity in a Tropical Man-Made Lake, Malaysia. Advanced Studies in Biology 6(4): 149-168.
-
Happey-Wood C (1988) Ecology freshwater planktonic green algae. In C.D. SANDGREN, ed. Growth and reproductive strategies of freshwater phytoplankton. Cambridge: University Press, pp: 452.
-
Hoffman CE (1952) Limnological studies in Arkansas. II. The effect of intense rainfall on the abundance and vertical distribution of plankton in lake Fort Smith, Arkansas. Arkansas Acad Sci 5: 83-90.
-
Congressional Report HR (1970) Phosphates in Detergents and the Eutrophication of America’s Waters. Committee on Government Operations 3: 91- 1004.
-
Steinberg EW, Hartmann HM (1988) Planktonic bloom-forming cyanobacteria and the eutrophication in lakes. Environ Technol Lett 20(2): 279-287.
-
Cavalcanti Eah, Larrazábal Mel (2004) macrozooplâncton da zona econômica exclusiva do nordeste do brasil (segunda expedição oceanográfica- revizee/ne ii) com ênfase em copepoda (crustacea). Revista Brasileira Zoologia 21(3): 467-475.
-
Yang B, Jiang YJ, He W, Liu WX, Kong XZ, et al. (2016) The tempo-spatial variations of phytoplankton diversities and their correlation with trophic state levels in a large eutrophic Chinese lake. Ecol Indic 66: 153-162.
-
Fayissa ZD, Kifle D (2014) The Study of Temporal Dynamics of Phytoplankton Biomass and Species Composition in Relation to Some Physical and Chemical Factors, Lake Kuriftu, Oromia Region, Ethiopia. (Burchell, 1822). Fish Aquac J 4(1): 084.
-
Gebre-Mariam Z (2002) The Ethiopian Rift Valley lakes: major threats and strategies for conservation. In: Tudorancea C & Taylor WD (Eds.), Ethiopian Rift Valley Lakes. Biology of Inland Waters Series, Backhuys Publishers, Leiden, The Netherlands, pp. 259-271.
-
Durate P, Macedo MF, Da Fonseca LC (2006) The relationship between phytoplankton diversity and community function in a coastal lagoon. Hydrobiologia 183: 3 -18.
- Lessons to Learn: Trees are More than the Lungs of the World
- Community Forestry Enterprises as a Model for Sustainable Forest Development: The Case Of The "Baja Tarahumara" in Chihuahua, Mexico
- Ecological and Socio-Economic Impacts of Chromolaena odorata and Mesosphaerum suaveolens, Two Invasive Alien Species in Central and Southern Benin, West Africa
- Epigenetic Sustainability: Modeling the Human Factor as a Natural Resource through Science 4.0 and the NR3C1 Biological Pilot
- Growth-at-Risk: A Framework for Assessing Economic Vulnerability
- The Rural Territory as a Socioecological System for the Management of Public Policy for Sustainable Rural Development