Review Study on Current Bread Wheat (Triticum aestivum L.) Production Status and Key Challenges for Potential Efficiency of Wheat Markets in Ethiopia
The main aim of this review study is to provide an overview of current wheat production status and the key challenges of future bread wheat marketing competence in Ethiopia. Bread wheat (Triticum aestivum L.) is a prevailing crop in temperate countries and is being used as one of a human sustenance. It is also an important basic food crop in Ethiopia. The success of wheat production depends somewhat on its adaptability and high yield potential, and also based on the gluten protein fraction, which confers the visco-elastic properties that allows its dough to be processed into bread, pasta, noodles and other food products. Improving bread wheat production and productivity as well as facilitating its marketing access is therefore one of a key part of the economic growth strategies in the Ethiopian government’s food self-sufficiency policy programs. The government’s policy interventions that aimed at improving bread wheat production or agricultural production for that matter, however, require involvements beyond the farm lands at the entire bread wheat value chains. Both local production and import are the two key sources of wheat grain supply to the Ethiopian bread wheat value chain have shown a substantial increase since the mid-1990s. So far, a steady increase in domestic wheat consumption has resulted in rising bread wheat and product prices over the forgoing two decades. For instance, bread wheat grain, wheat flour as well as wheat bread prices have all being more than doubled between 2000 and 2020. Using a qualitative survey of selected bread wheat value chain actors and a review of existing literature, this study provides an overview of the bread wheat value chain, institutional and marketing arrangements, and trader behavior of bread wheat value chain actors in Ethiopia. The bread wheat value chain consists of multiple actors that include several small holder farmers and the Ethiopian grain trade enterprise at the upstream and urban and rural consumers at the other end. The study stresses the need for formulation of bread wheat market-enhancing policies, such as quality control and dispute settlement mechanisms as well as better access to market information, to improve bread wheat productivity as well as marketing efficiency.
Introduction
Bread wheat (Triticum Aestivum L.) is one of the various cereal crops largely grown in the highlands of Ethiopia. It is produced largely in the southeast, central and northwest parts of the country. Small amount is produced in the rest of the south and north regions. Bread wheat is an important primary food crop in Ethiopia, particularly in urban areas. It is an indispensable food in the diets of several Ethiopian, providing about 15% of the caloric intake for the country’s over 90 million populations [1], placing it second after maize and slightly ahead of teff, sorghum, and enset, which contribute 10-12% each [2]. Wheat is also the fourth largest cereal crop produced by close to 5 million smallholder farmers, which makes about 35% of all small farmers in the country. It accounts close to 17% of acreage of arable land and a fifth of all cereal food crops produced in the country in 2013/14 [3]. After South Africa, Ethiopia is the second largest wheat producer in sub-Saharan Africa [4].
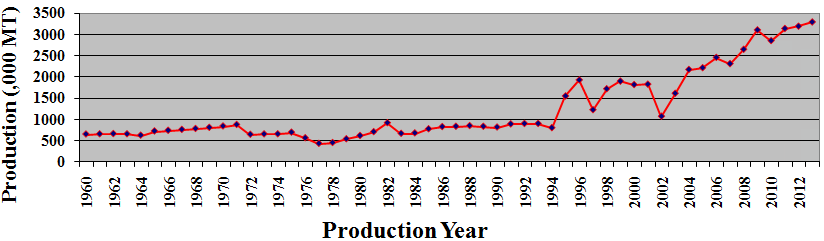
So far, many varieties of bread and durum wheat have been developed to satisfy the growing production demands and as a result, about 76 bread wheat and 34 durum wheat varieties have been released. Wheat production has grown significantly over the past two decades following several government programs and initiatives implemented to drive agricultural growth and food security in the country1. Production increased from around 1.1 million tons in 1995/96 to 3.9 million tons in 2013/14, which is an average annual growth of 7.5%. Although wheat production has grown steadily, consumption of wheat has also expanded significantly. Wheat consumption increased from 2.1 million tons to 4.2 million tons, representing an annual increase of about 4.2 percent between 1995/96 and 2013/14. Wheat import has also grown significantly over the past decaden [5].
Bread wheat is in fact a single most important primary food crop imported from abroad. Bread wheat import increased by an average of 6.6% over the past decade. In 2008 Ethiopia, for instance, imported more than a million tons of bread wheat, which was equivalent to about 40 percent of the total domestic production and almost 250% of the marketed volume [6]. In 2013/14 the country imported 1.39 million metric tons, which is about 34 percent of the domestic production and above 160% of the marketed wheat in the country [2]. In parallel with the surge in wheat import, the country was forced to spend a substantial amount of foreign currency that largely comes from export of other primarily agricultural commodities. An enormous increase in domestic production and import of wheat, however, has not helped to reverse the increasing trend in wheat price. Official statistics on consumer prices indicate that prices of wheat and wheat products rather increased substantially.
Over the eight-year period between 2005 and 2020, the price of wheat has increased almost 400%. The wholesale price of a tone bread wheat at Addis Ababa market has increased from 1975 to 7045 (257%) and the farm gate price from 1713 to 6709 Ethiopian Birr (292%) [7]. On the other hand, between 2000/01 and 2012/13 real prices of bread wheat, flour and bread in Addis Ababa, increased by 176, 131 and 116%, respectively. The current trend seems to continue in the future too. Samuel Gebreselassie [8], pointed out a growing wheat supply deficit in the coming decades. According to this study, supply is expected to grow by 73% from 2.6 million in 2020 to 4.5 million tons in 2030, whereas demand is expected to increase by 90% from 3 million to close to 5.7 million tons during the same period.
A range of factors that include population growth, expansion of agro processors, urbanization, and increasing household income contribute for wheat demand growth in the future. In general, the upward price trend seems to continue in the near future. The growing structural deficit in wheat supply and the government’s active role, both in terms of making large investments in extension programs and adopting protectionist policies to ensure government control of all commercial wheat imports, necessitates studies on the structure and performance of wheat production. The present study aims to contribute to this by providing an overview of the current status and key challenges of the Ethiopian wheat production. A better understanding of the current status of the wheat sector, its value chain, the institutional marketing arrangements, and microeconomic trader behaviors of wheat market participants contributes to formulation of policies that are market-enhancing as well as that could enhance domestic wheat production [8].
Bread wheat constitute the predominant basis of human nutrition worldwide and require a major research effort to increase their productivity and sustainability in the face of high food prices, climatic changes and natural resource depletion. Countries have an urgent need to increase bread wheat production to meet the growing demands under the constraints of depleting natural resources and environmental instabilities. Year after year problems are becoming more intense thereby highlighting the need to focus research on areas like drought tolerance, disease resistance and quality production. Blend of innovative approaches and breeding strategies can improve the drowning conditions in the future [9].
It is evident that bread wheat is one of the most important crucial food crops grown over 200 million hectares in varied range of environments throughout the world. Green revolution made a remarkable progress in increasing bread wheat production and the credit goes to Dr N E Borlaug who developed some high yielding dwarf varieties. In order to meet the intimidating task of improving yield potential in a sustainable way, Ethiopia needs to improve the overall breeding efficiency [10]. The present review is focused on the ongoing research areas in Ethiopia, challenges ahead and a possible way out to deal with the crucial issues strategically so as to proportionate the demand and supply ratios.
The arrangement of this review article is organized as follows: The first section presents an overview of current bread wheat production status and key challenges for future marketing efficiency in general and specifically in Ethiopia. The next section begins with body of discussion and a brief description of the existing institutional arrangements of the bread wheat production status and proceeds by extensive discussions on the structure of the bread wheat farms, production and productivity as well as properties of key challenges for future marketing narration in Ethiopia. This information is used to highlight key facts on bread wheat research performance and production constraints in the country as well as the behavior and challenges of traders in the bread wheat markets. The thired part provides the economic evaluation of bread wheat grain yields and its benefit cost ratio prices.
Body of Discusion
The Methodology Used for this Review Study
The required research outputs on the current bread wheat (Triticum aestivum L.) production status and key challenges for potential competence of wheat markets in ethiopia were gathered from all accessible sources such as internet, scientific papers, books, periodical publications and collected also through formal and informal interviews from potential informers in order to summarize and compile in the right reviewing methodologies and research procedures. All the research findings on the “current bread wheat production status and key challenges for potential competence of wheat markets in ethiopia are thoroughly reviewed and discussed by comparing with the relevant literatures.
Bread Wheat Production Status in Ethiopia
Ethiopia is one of the principal producers of wheat in East, Central and Southern Africa. It is produced mainly in the southeast, northwest and central parts of Ethiopia. Minor amount is also produced in the rest of the south and northern regions Wheat is one of the major cereal crops in the Ethiopian highlands, which range between 6 and 16°N, 35 and 42°E, and from 1500 to 2800 m. At present, wheat is produced solely under rain fed conditions [5].
The two economically important wheat species grown in Ethiopia are tetraploid durum (Triticum Durum) and hexaploid bread wheat (Triticum Aestivum L.). At the national level presently, 1,664,564.62 million ha of land is covered by bread & durum wheat and over 42,192.57 metric tons’ coverage produced from this land annually and recently- released bread wheat cultivars are highly responsive to improved management systems relative to older wheat lines [5, 11].
Its production is increasing rapidly due to both a high local demand, and the availability of high-yielding, input-responsive cultivars adapted to heterogeneous environmental conditions [12]. Area coverage of bread wheat has substantially expanded mainly by replacing unimproved, input non-responsive traditional cereal crops such as teff (Eragrostis Teff), durum wheat (T. Durum) and barley (Hordeumvulgare).
Importance of Bread Wheat Crop
Bread wheat is not only the most important cereal crop in the world but also the major source of staple food for the peoples [13, 14]. Despite of being grown on larger area, average yield at farmers’ fields is still far below than the potential [15]. Traditional method of seedbed preparation for preceding crop late planting, high weeds infestation, water shortage at critical growth stages and non-judicious use of fertilizers reduce the wheat productivity. The major role of mineral fertilizers is to improve crop yields but the main constraint in achieving proven crop potential is low use of fertilizers particularly that of P and S as compared to N [16]. Bread wheat is widely consumed, in the countries to meet the consumers demand for bread and other food products. This indicated that globally there is number of people who rely on wheat for a substantial part of their diet amounts to several billions. Statistics for the total volume of wheat which is consumed directly by humans as opposed to feeding livestock, for the United Kingdom indicates about one-third of the total production, approximately 5.7 m tones per annum are milled with home production.
Globally there is no doubt that the number of people who rely on wheat for a substantial part of their diet amounts to several billions. The high content of starch, about 60–70% of the whole grain and 65–75% of white flour, means that wheat is often considered to be little more than a source of calories, and this is certainly true for animal feed production, with high-yielding, low protein feed varieties being supplemented by other protein-rich crops, notably soybeans and oilseed residues [17, 18].
However, despite its relatively low protein content, usually 8–15% wheat still provides as much protein for human. Therefore, the nutritional importance of wheat proteins should not be underestimated, particularly in less developed countries where bread and other products (e.g. burger, cookies, baby biscuit etc.) may provide a substantial proportion of the diet [17]. In general, wheat is the most widely used cereal for bread and bakery production process throughout the whole world [19, 20].
It is grown in nearly every region of the world and represents a main source of food and income for millions of smallholder farmers. Pena Bautista RJ [21] reported that, wheat-based foods are critical for food security and nutritional security worldwide. The global bread wheat researchers draw attention to the predicted upcoming food crisis, as populations in developing countries expand rapidly, especially in Africa and South Asia. They note that population growth is likely to outpace yield gains in wheat and call for larger investments in wheat and other cereal crops to keep pace with future demand.
Brad Wheat Producers and Production Efficiency in Ethiopia
Ethiopian agriculture is occupied by smallholders. As of 2014, close to 5 million farmers engage in bread wheat production in Ethiopia. This is about a third of all smallholder farmers in the country [3]. Although their vast number, Ethiopian farmers in general cultivate small lands/ acreage. Above half of the smallholders cultivate farms less than a hectare [22]. The average farm size has also declined over time. Official statistics, for instance, indicate that over the past five years alone (2009/10–2013/14) the proportion of smallholders who cultivate farms less than a hectare has increased by 5.2% while those who cultivate farmland that vary between 1 and 2 hectares and over 2 hectares declined by 5.4 and 7.1%, respectively.
The average wheat farmland in 2014 was only 0.34 hectares, and varies between 0.28 and 0.39 hectares. Despite such miniature plot sizes, there is high degree of inequality in access to farmlands. As shown in (Figure 1) below, 57 percent of smallholder farmers cultivate only 20 percent of cultivated farmlands, whereas 46 percent of cultivated farmlands are operated only by 17 percent of farming households. Although small-scale farmers dominate wheat production in Ethiopia, there are some large-scale commercial farms that grow wheat. However, large commercial bread wheat producers account only 3 to 5 percent of all wheat cultivated land [2]. Wheat is the fourth largest cereal crop produced in Ethiopia [1].
Production of wheat has significantly increased over the past 20 years. It has increased from 890000 metric tons (MT) in the 1991/92 marketing year to 3.11 million MT in 2009/10 [23] and to 4.04 million MT in 2014/15 Growth in wheat production has, however, been characterized by significant annual fluctuations, primarily due to variations in rainfall. The coefficient of variation of bread wheat production during the 1996-2013 periods was 44 percent, whereas the Cuddy-Della Valle index is 12 percent. The latter index implies that bread wheat production deviates from the trend wheat growth by an average of 12 percent. On the other hand, the proportion of cereal area cultivated with wheat has fluctuated between 15 and 18 percent over the past ten years with no discernible trend [2].
This implies that other cereals have expanded their cultivated areas at similar rates over the past 20 years. Bread wheat yield has increased over the past decade. Recent estimates show that wheat farmers in Ethiopia produce on average 2.5t/ha. There is significant variation in average bread wheat yields through regions and zones. For instance, the average bread wheat yields in some zones of Oromia and SNPP, where farm sizes are relatively large, were between 2.5 and 2.8t/ha, whereas, average yields are reportedly lower than the national average in most of parts of Amhara and Tigray, ranging between 1.7 and 1.9 t/ha [24], which is well below the experimental yield of above 5 t/ha. There is, however, consistent progress in terms of narrowing this yield gap between field and experimental levels.
As indicated by official statistics, wheat yield has doubled over the past two decades. In comparison to the global trend the recent growth in wheat yield in Ethiopia is also encouraging. Considering wheat, Ethiopia has managed to more than double its land productivity over the past one and half decades. The second best performer in the category is Malawi, a country that hugely subsidizes its fertilizer market. Ethiopia is among the top bread wheat producer countries in Africa, following South Africa and Egypt.
However, bread wheat yield in Ethiopia is only 70 percent of the level in South Africa, and only 39 percent of the highly irrigated wheat production system of Egypt. Compared to China, wheat yield in Ethiopia (in 2014) is about half of that of China. Typically bread wheat yield in Ethiopia needs to improve further to level-up with Africa’s and world average wheat yields, which were 13 and 32 percent higher than the average wheat yield in Ethiopia, respectively [1, 5]. A study by FAO, however, shows that Ethiopia (in 2012) ranks 80th in wheat yield globally.
As shown in (Figure 5) wheat yield in Ethiopia in 2012 was only 25 percent of that of New Zealand, which leads the global performance with 8.92 tonnes per hectare. Compared to the best performing African countries such as Namibia and Zambia, wheat yield in Ethiopia was only about one-third of these countries. Beyond agro-climatic and political factors contributing to lower yields, technology could play a more dominant role in productivity, enabling Ethiopia to enhance its yields and achieve at least a sufficient yield to feed and change the living standard of its growing population [7]. Value Chain Perceptions to the Ethiopian Bread Wheat Commodity Markets This section provides an impression of the bread wheat value chain, institutional and marketing arrangements, and trader behavior of bread wheat value chain actors in Ethiopia. Ever since Ethiopia’s market liberalization in the early 1990s many studies [8, 25, 26] have been conducted on commodity market performance and value chain analysis for key agricultural commodities, such as for wheat, in Ethiopia.
The development of stable and reliable marketing system has been an important element to enhance productivity and commercialization of smallholder cereal producers.
With nearly half of the Ethiopian population depending on the food grain market [8], the performance of the domestic market is vital for food security and economic growth in the country. Marketing of agricultural products consists primarily of moving products from production sites to points of final consumption. The term value chain is used to characterize the set of interconnected and coordinated links and linkages during this product movement [27].
Value chains are a key framework for understanding how a product moves from the producer to the customer. The value chain perspective provides an important means to understand the business-business relationships, mechanisms to increase efficiency, and ways to enable business to increase productivity and add value [25]. It addresses the nature and determinants of competitiveness, and makes a particular contribution in raising the sights from the individual firm to the group of interconnected firms. By focusing on all links in the chain (not just on production) and on all activities in each link, it helps to identify which activities are subject to increasing returns, and which are subject to declining returns.
The major objectives of value chain analysis of basic food crops like wheat in Ethiopia should be how to maximize the participation and benefits of producers along the whole value chain. This could be achieved either by enhancing their degree and level of participation and make the operation of the whole value chain more transparent and competitive to them. The main actors in the value chain are smallholder farmers who tend to sell large quantities of their production during and soon after the main (meher) harvest, but further sales may occur as they off - load grain stocks to avoid damage and loss caused by storage pests [28]. Bread wheat farmers can either sell the grain to wholesalers or trade small quantities to rural assemblers.
Use of Modern Farm Inputs among Wheat Producers
Low agricultural productivity can be attributed to smallholders’ limited access to agricultural inputs, financial services, improved production technologies, irrigation and agricultural markets and, importantly, to poor land management practices that have led to severe land degradation. The use of fertilizer and other yield augmenting practices and inputs like improved seeds has also increased over time as availability or access to suitable farmland has increasingly become scarce due to population pressure and also other factors like land degradation and unsustainable land management practices. Between 2002 and 2011, fertilizers sale and consumption in Ethiopia, for instance, grew by more than 100%, implying an average growth rate of 6 per year [29].
| Inputs | Extent and intensity use in the croping years of 2011 - 2014 |
|---|---|
| Fertilizer | 73.4% of wheat acreage 67.6% of wheat growers 137.8 Kg/ha 48.1 Kg/farmer |
| Improved seeds | 5.6% of cultivated land 7.4% of wheat growers |
| Irrigation Pesticide use | 0.39% of cultivated land 0.88% of wheat growers 47.2% of cultivated land 35% of wheat growers |
Table 1: Extent and intensity of modern inputs use stasus in the previously wheat production years of Ethiopia. _Source: CSA (201
Following Teff, wheat is the most common crop on which fertilizers like DAP and Urea were applied. In 2015, about 68 percent of wheat growers applied fertilizers on 1.68 million hectares or 73.4 percent of wheat acreage but often with suboptimal amount (Table 1). Despite this relatively high use of fertilizers, only a small portion of wheat growers had sown their farm with improved seeds in 2014/15 crop year. CSA report indicates that only 5.6 percent area planted with wheat in 2014 crop year used improved seeds varieties [30].
If one assumes that this 5.6 percent of wheat area planted with improved seeds also fertilized, the area cultivated using improved seed-fertilizers packages is still less than 6 percent of total cultivated land. Gashaw [31], however, indicate that only about 1% of the wheat area was cultivated using improved seed-fertilizers packages. These organizations collaborate closely with farmer cooperatives and regional credit and savings institutions in both supplying inputs and disbursing credit. The pricing and marketing policy in the Ethiopian seed system is highly centralized, which is unfortunate given the high production response for combined use of improved seeds and fertilizers in Ethiopia [32, 33].
Earlier Wheat Research Status and Grain Yield Statistics in Ethiopia
Ethiopia is the largest wheat producer in sub-Saharan Africa with about 0.75 million ha of durum and bread wheat. Wheat is one of the major cereal crops in the Ethiopian
highlands, which range between 6 and 16°N, 35 and 42°E, and from 1500 to 2800 m. At present, wheat is produced solely under rain fed conditions. About 60% of the wheat area is covered by durum and 40% by bread wheat. Of the current total wheat production area, 75.5% is located in Arsi, Bale and Shewa regions. Forty-six percent of the 13 million ha classified as highly suitable for wheat production is located in Arsi and Shewa [34].
Research and Extension as Institutional Players
Besides to bread wheat farmers, addressing the complex issue that delayed the country from becoming self-sufficient in bread wheat requires an active and complete participation of other important value chain actors at the pre-production stage of the bread wheat value chain.
Amongst them are public and private institutions that have been engaged in the development and supply of agricultural inputs and technologies. These include formal agricultural research and extension systems that have long been engaged in the generation, promotion and adoption of improved seeds and other farm technologies and management practices that potentially enhance wheat production and productivity.
Agricultural research and technology generation has been an important aspect of government efforts for the development of Ethiopian agriculture for the last several decades. It is now over five decades since agricultural research activities were institutionalized. Currently, there are many agricultural research institutions at various levels that engage in agricultural research and technology generation and dissemination activities. But the Ethiopian Institute of Agricultural Research (EIAR) remains the primary agricultural research agency.
The EIAR is a federal institution mandated to design research policy and strategies, assist in capacity building, coordinates national research activities and undertakes researches with its own research centers and in collaboration with other regional research institutes. The institutional structure of Ethiopia’s agricultural R&D system has undergone numerous rounds of restructuring over recent periods. While the Ethiopian research system has supported wheat producers across the country, it is difficult to say that the wheat value-chain at the pre-production stage in general and the research and extension systems in particular provide demand-driven support to wheat producers. National capacity in terms of facilitating identification, sourcing, import, and multiplication and dissemination of new and proven agricultural technologies should be strengthened. Limited participation and integration of the private sector in wheat value added activities undermined the whole value chain system.
The sustainability and efficiency of the wheat value chain at the upstream stage needs strong but well regulated participation of the private sector. Previous studies, for instance [32, 35], argued that increased private sector participation would strengthen the Ethiopian seed system.
Present Bread Wheat Production Status in Ethiopia
Wheat is one of Ethiopia’s main essential crops in terms of both production and consumption. Based on its role in the population’s caloric intake, wheat is the second most important food in the country, behind maize [36]. Wheat
is grown primarily in the highlands of Ethiopia, and the two main wheat producing regions (Oromia and Amhara) account for approximately 85 percent of national wheat [24].
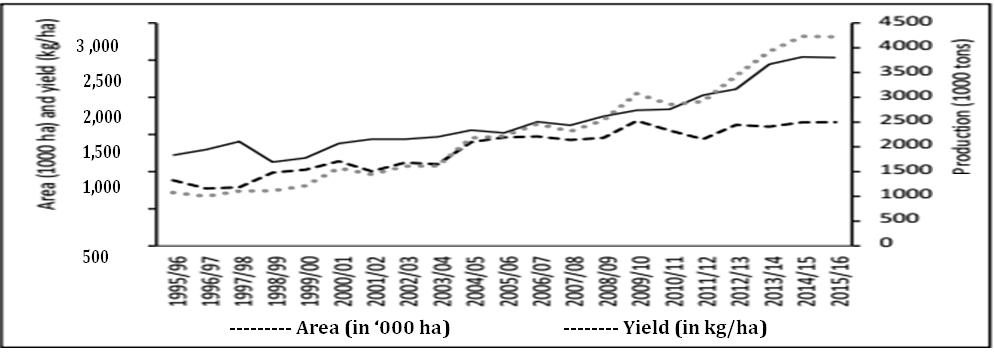
Even though wheat is typically grown by smallholder farmers in Ethiopia, the country is the largest wheat producer in Africa south of the Sahara by a sizable margin. Wheat production during the 2015/2016 Meher 3 season was 4.1 million metric tons and has been growing significantly over time (rising by an average annual growth of 7.1 percent over the last two decades) due to both area expansion and yield improvements (Figure 2).
Wheat production, Area Cultivated, and Grain Yields Status in Ethiopia
In terms of area, wheat is the fourth most widely grown crop in Ethiopia, after teff, maize, and sorghum. Today, approximately 1.7 million hectares of land are devoted to wheat crops and its a significant increase from the less than 1 million hectares planted in wheat in 1996, representing an annual growth rate of 3.2 percent (Figure 2).
In addition, the country has increased its wheat yield by approximately 3.7 percent per year over the last two decades: Current wheat yields are roughly double the average wheat yields 20 years ago, implying that more than half of the growth in production since 1996 can be attributed to yield growth. The rate of growth has been especially high in recent years: Since 2005, yield has increased more than 5.2% per year.
Nevertheless, compared to the yields attained by other major producers in Africa (for example, Egypt, South Africa, and Kenya), Ethiopian wheat yields are low, indicating considerable potential for improvement. Various constraints combine to explain the wheat yield gaps in Ethiopia. Use of modern production-enhancing inputs, such as fertilizers and improved seeds, among wheat farmers in Ethiopia is reportedly low.
Bread Wheat Producers and the Ethiopian Seed System
Despite the on-going small program of direct marketing of certified seed by seed producers to farmers across 31 woredas (districts), currently improved certified seed is supplied to Ethiopian smallholders primarily through regional, state-run extension, and input supply systems that operate with a degree of guidance from the federal Ministry of Agriculture and Forestry. This regional system is made up of regional bureaus of agriculture, their woreda (district) offices, and extension agents. Gashaw [31], however, indicate that only about 1 percent of the wheat area was cultivated using improved seed-fertilizers packages termed as “development agents” working at the kebele or peasant association level. These organizations collaborate closely with farmer cooperatives and regional credit and savings institutions in both supplying inputs and disbursing credit. The pricing and marketing policy in the Ethiopian seed system is highly centralized.
For farmers in Ethiopia, buying improved seeds through the formal system has not always been reliable. Sometimes seeds are delivered too late for the planting season or the wrong type of seed is delivered; often there are seed shortages, and the seed quality can be low. “Farmers have limited options to access improved seed beyond their primary cooperative in their villages, especially when seed is unavailable or not at the appropriate level of quality [37]. The other major problem in the Ethiopian seed marketing system is related to demand for and supply of improved seeds. Estimates of market demand for improved seed in Ethiopia are based entirely on official projections. The responsibility of responding to these demand estimates lies primarily with the state-owned Ethiopian Seed Enterprise [38].
Seed distribution is usually managed by farmer cooperative unions which usually pick the seed up in the regional/Zonal warehouses and bring it to the woredas and kebeles. Unions charge for transport, loading and unloading but they make only small profits for seed distribution, as these profit margins are determined by the regional governments [39]. An important implication of this seed system is the lack of agro- dealers as the seed distribution is organized via government-controlled large distribution channel. Seed demand has consistently exceeded supply.
In addition, shortcomings in seed quality and timeliness of delivery have been longstanding issues in Ethiopia [38]. The process of government policy to estimate demand and supply of seed aggregates from “demand estimates” produced by woreda and regional bureaus likely masks the growing demand for improved or certified seed and for quality maize seed throughout Ethiopia. So supply of certified/improved seed may be consistently falling short of demand. Lack of “unbiased estimates” of quantities demanded and supplied is the core reason for shortcomings in seed quality and timeliness of delivery in the country [38].
Private sector involvement in wheat seed markets in general is very low, and growth in the private seed sector is inhibited by several factors. One is the provision of large government subsidies to the public ESE. Another cited reason is the expansion of the ESE into hybrid seed production despite an existing private seed company with experience in the hybrid maize seed sector. Additionally, most farmers use retained seed for planting, making it difficult to accurately predict demand for seeds [23].
Though the public provision of inputs, credit, and information is still necessary, many of Ethiopia’s state‐ led policies put in place to promote cereal intensification and smallholder commercialization have outlived their usefulness. A rethinking of approaches is needed, one that reallocates the roles of the public and private sectors in the country’s agricultural input, extension, and education systems. This rethinking requires a nuanced understanding of the complex issues involved, evidence‐based analysis and policy recommendations, and continuous debate on the pros and cons of alternatives and options [40].
The development of a more dynamic and competitive agricultural sector in Ethiopia requires the introduction of rural institutions and organizations that respond effectively to rapidly changing market and technological conditions. This suggests the need for policies and programs designed to create more space for both public and private input and service providers in the rural economy. Byerlee and Yu [32, 35] argue that increased private sector participation would strengthen the Ethiopian seed system, which is currently failing to meet the needs of many farmers. The ESE is not able to provide a sufficient seed supply. In 2005, for instance, the quantity of wheat seed supplied by the ESE was only 20 percent of the quantity demanded according to regional bureau predictions.
Farmers have also reported problems with ESE-supplied seed quality, including poor cleaning, low germination rates, seed mixtures, and delayed supply. The recent addition of the Agricultural Transformation Agency (ATA) into the Ethiopian agricultural system is expected to reshape the imbalance in the role of the private and public sectors in the country’s agricultural input and service provision system and in making it more effective and demand-driven for small wheat producers. The ATA is expected to work with implementation partners mainly the ministry of agriculture and forest development to identify solutions to address systemic bottlenecks in the agricultural technology, input and finance systems around a prioritized set of commodities, such as wheat, throughout the country.
The ATA launched the Ethiopian wheat productivity initiative in 2013 which aims to increase the productivity of one million smallholder wheat farmers by 50 percent by 2015 [41]. In doing so, it also aims to replace all current wheat imports to save the annual foreign exchange spending on wheat imports and to protect local producers. ATA, in collaboration with MoA and other stakeholders, has been working to develop a comprehensive rural financial services (RFS) strategy, which has a potential to at least partly solve smallholders’ limited access to credit. This initiative is also expected to enhance the existing low capacity in rural finance institutions and nonexistence of risk mitigation mechanisms, hampers productivity of wheat farmers at the pre-production and production stages.
Bread Wheat Marketing Status in Ethiopia
Agriculture is the heart of Ethiopia’s economy, as most of the population earns its livelihood from agriculture. According to official estimates, about 42% of the country’s gross domestic product comes from agriculture, providing a livelihood for more than 80% of the population. Moreover, transport, processing & trade activities depend upon the production of agricultural commodities, & incomes earned in agriculture provide markets for domestically produced goods & services. Agricultural development issues are very important to the national progress.
However, in recent years’ agricultural exports have diminished, and Ethiopia’s share in world trade of food crops has declined. Food production per capita has also declined, and imports of food grains are increasing over time. Grain production has not matched the population growth rate which is estimated at about 2.9 percent annually. The value of food donated by the industrialized countries has increased substantially until March 1990, the Agricultural Marketing Corporation (AMC) depended upon grain purchases from the peasant sector under a quota system with fixed prices. Now, the procurement quota system has been abolished along with fixed market prices and all controls on grain flow.
After this, the procurement objectives of AMC are not clearly understood. The policy change is expected to have a positive impact on agricultural production, trade and general economic activity in the country. Ethiopia has suffered severe drought repeatedly. Hence, AMC imports grain & uses various means such as grain exchange with different organizations & searches and food aid. The imported grain is primarily wheat required to maintain the supply of wheat to flour mills. The government provides the necessary foreign currency to AMC for wheat commercial imports only at times of domestic grain shortage, because buying grain from abroad is expensive compared to local markets.
Bread Wheat Marketing and Distribution of in Ethiopia
The Ethiopian urban population dependent on grain marketing is small compared to the farming population. Out of a total population of about 50.2 million, 5.0 million (10%) comprise the urban section, about 2 million (4%) are rural cash crop producers and about 3 million (6%) are nomads. Consequently, the grain market dependent population comprises about 20% of the total. When seen from the market supply side, the peasants produce grain mainly for subsistence. Only about 18.5 percent of the amount they produce is marketed, while the rest is retained on farms either for food or seed. About 93% of the national grain production is from the private sector under small-scale farming.
The remaining 7% is shared between producers’ cooperatives and the state farms at 4% and 3%, respectively. Due to poor grain handling methods, primitive measurement techniques and poorly developed transport systems, a significant amount of farm output is consumed in the home. This results in only 18.5% of all grain and 19.4% of wheat production entering the market. The grain marketing system is not advanced, and a large portion of the produce of the small holder sector is marketed locally in the form of direct transactions between producers and consumers as well as middle-men. Therefore, in most of the traditional primary grain markets, farmers’ marketed produce is brought to market after overcoming many problems. Up to 1980, grain markets were dominated by private merchants with negligible government participation.
Private trade, composed of both licensed and unlicensed dealers, handled almost 90% of the grain that entered the market. The first public organization to participate in grain market regulation, established in 1950, was the Ethiopian Grain Board. It had the following objectives:
- Encourage the maximum export of grain, flour, pulses and oilseeds; and
- Ensure high quality standards for exportable grains, flour, pulses and oilseeds.
The board was not responsible for stimulating grain production in the country. A decade after the formation of the Ethiopian Grain Board, the Ethiopian Grain Corporation (EGC) was established in 1960 with the following objectives:
- Engage in the purchase of cereals, pulses and oilseeds
- Export the same, and, whenever necessary, sell on the domestic market.
Although, the EGC existed since 1960 with the objective of stabilizing grain markets, its share of the market and marketing activities were very limited as it had only 18 rural grain buying and storage centers. According to the current declared economic policy, governmental institutions and cooperatives have emerged to play a major role in grain marketing. Currently, three major market participants exist, namely, public, private and cooperative.
The extent to which the participants interact is dependent upon their location in the marketing chain. Concerning public grain marketing agencies, there exist 3 major ones, namely, the Agricultural Marketing Corporation (AMC), the Ethiopian Oilseeds and Pulses Export Corporation (EOPEC), and the Ethiopian Import Export Corporation (ETIMEX); AMC is the largest. When AMC was established in 1977, it was given the following objectives:
- To assure thw market price levels which provide adequate incentive to the producer and at the same time safeguard consumers’ interests;
- To assure an adequate food supply in all parts of the country;
- To improve the efficiency of the grain marketing system at all levels; and
- To distribute agricultural inputs such as fertilizers and biocides.
After almost one decade, the government redefined the role of AMC by transferring the task of distributing agricultural inputs to the Ministry of Agriculture, so that AMC could specialize in grain collection, distribution and handling.
Bread Wheat Buying and Saleing Mechanisms
AMC’s bread wheat purchase activities, as for other grains, are now carried out through a free and competitive market system. Unlike in previous years, AMC enters the open market and buys its commodities without purchase quota and fixed price system. When AMC’s bread wheat purchases from the peasant sector are analyzed over the period 1982/83-86/87 the average amount of 77430 t of bread wheat was procured from service cooperatives and merchants annually. There were 210 wheat source woredas, out of which 177 or 84% contributed 350 t or less each, 29 woredas or 14% contributed between 360 and 2510 t each, and only 5 woredas or 2% contributed between 2880 and 4300 each.
On the basis of this analysis, the surplus wheat producing areas were identified. There were 33 major wheats surplus woredas, 11 or 33% in Shewa, 4 or 12% in Gojam, 16 or 48% in Arsi and 2 or 6% in Bale Regions. Arsi, which has the highest share, contributed 1440-4310 t of wheat annually to AMC’s purchases from the peasant sector. When cereal price index analysis is done, the lowest free-market prices occurred at Asella since it is one of the cities with the highest bread wheat availability.
Bread Wheat Production and Marketing Status in Ethiopia
Wheat production grew by 3.7 percent between 2010/11 and 2013/14, and reached at 3.93 million metric tons in 2013/14 [42]. Wheat production, however, concentrates in two regions. This contributes to the geographical dispersion of bread wheat-surplus and deficit areas in the country. The major surplus areas of wheat are zones (provinces) in Oromia and SNNPR, namely Bale, East Arsi, West Arsi, Western and Eastern Shoa, Central SNNPR (Hadiya and Kembata) and Central & Southern Amhara (East Gojam, North Shoa) [7].
Two-thirds of the zone-level surpluses come from just four zones: Bale, Arsi, West Arsi, and East Gojam [2]. Trade flows from these surplus areas in all directions to Addis Ababa. Other major flows are from North Western areas to Dessie and then to Mekele, and from Addis Ababa to other deficit areas, including Dire Dawa, Harar, Jijiga and peripheral regions of Oromia, Somalia and Benshangul. As shown in Figure 7 the major route of wheat trade is from Addis Ababa to East Ethiopia, and from Dessie to northern part of the country, whereas the minor routes are to western and southern peripheries [7].
Marketing and Distribution Network
The agricultural marketing corperation (AMC) operates a nationwide marketing network with 8 regional offices, 20 branch offices, 129 purchase and sales centers and about 2000 collection points distributed throughout all administrative regions. As regards manpower, AMC has 4059 employees out of which 30% are at the head office and the remaining 70% are at the regional offices, branch offices and purchase centers. Concerning storage capacity, at present, AMC has silos and stores with a total capacity of about 0.8 million tonne.
Store construction is densest where grain production potential is highest. AMC has a fleet of 245 trucks which fulfills 44% of AMC’s transport requirement. Annual grain purchase and sales planning is prepared as a draft proposal by AMC and is approved for implementation by the Ministry of Domestic Trade and the Office of the National Committee for Central Planning.
| Production Years | Wheat Production (million tons) | Wheat Import (million tons) | Estimated marketable surplus* | Share of imported wheat | |
|---|---|---|---|---|---|
| As total domestic production (%) | Domestic marketable production (%) | ||||
| 2010/11 | 2.86 | 1.70 | 0.572 | 59.4 | 237.8 |
| 2011/12 | 2.92 | 1.65 | 0.584 | 56.5 | 226.0 |
| 2012/13 | 3.43 | 1.64 | 0.686 | 47.8 | 191.3 |
| 2013/14 | 3.93 | 1.62 | 0.786 | 41.2 | 164.9 |
Table 2: Bread Wheat import and self-sufficiency enhancement in the previously wheat production years of Ethiopia Source: Compute
Based on the CSA’s 2014/15 crop utilization survey, the share of marketable surplus is considered as 20 percent of the production. The ATA was created in 2010 to help Ethiopia to replicate the agricultural transformation seen in many Asian countries during their first phase of development. In particular, the agency is reported to strive to introduce new technologies and approaches that can address systemic bottlenecks & catalyze transformation of the sector, and play a catalytic role to support partners to effectively execute agreed upon solutions (many of which may not be new) in a coordinated manner.
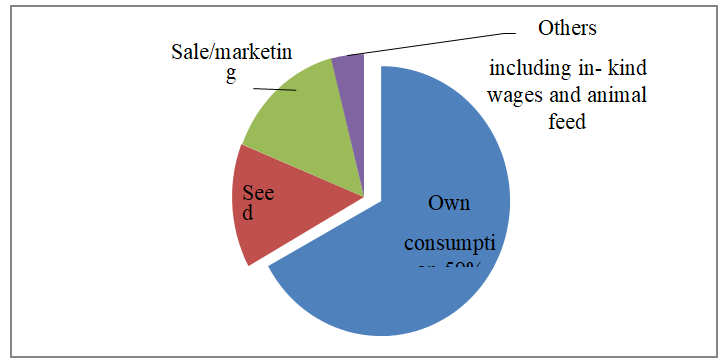
Despite the high growth in wheat production, the market surplus of wheat farmers, however, remains very low, indicating the subsistence nature of wheat production in the country. Most wheat in Ethiopia is not marketed; instead it is retained by the farmer and used for their own consumption, seed, and possibly other uses. According to the 2013/14 Agricultural Sample Survey, just 19 percent of wheat output was sold. The proportion was somewhat higher (25 percent) in the 2012 IFPRI-ATA Baseline Survey [2].
Official statistics also indicate that in 2014/15 production year, the average wheat producer produce 751 kg of wheat and sell 189 kg [43], so that the average marketable surplus was 25 percent. The share of wheat production that is sold, however, varies widely across households (Figure 3).
![Figure 3: Ethiopia’s first Season Bread Wheat Production and Market Flow Maps, Source: FEWSNET (in FAO, 2014) [7].](/fulltextimages/7048/fig_3.png)
Despite the high growth in wheat production, the market surplus of wheat farmers, however, remains very low, indicating the subsistence nature of wheat production in the country. Most wheat in Ethiopia is not marketed; instead it is retained by the farmer and used for their own consumption, seed, and possibly other uses. According to the 2013/14 Agricultural Sample Survey, just 19% of wheat output was sold.
The proportion was somewhat higher ab out25 percent in the 2012 IFPRI-ATA Baseline Survey [2]. Official statistics also indicate that in 2014/15 production year, the average wheat producer produce 751 kg of wheat and sell 189 kg [43], so that the average marketable surplus was about 25 percent. The share of bread wheat production that is sold, however, varies widely across households. Over half of the estimated 4.7 million wheat growers, for example, produced only for own domestic consumption. Based on a national representative data, a study by Minot [2] indicates that about 54 percent of wheat producers do not sell any of their wheat output, which implies that few producers supply the bulk of wheat marketed in the country.
In other words, the domestic wheat market is dominated by a few and relatively large producers. The top 20 percent of wheat sellers account for 60 percent of wheat sales. Just 10 percent of them sell more than 40 percent of the wheat supplied to the domestic market (Figure 4).
![Figure 5: Market share of best wheat among farmers operate different _Source:_ Minot, et al. [2]](/fulltextimages/7048/fig_5.png)
![Figure 6: Patterns of marketed surplus of Sellers percent of all wheat marketed. _Source:_ Minot, et al. [2]](/fulltextimages/7048/fig_6.png)
On the other hand, farmers with 2-5 hectares of land sell a smaller share about 28% but account for more than half about 55 percent of wheat marketed in Ethiopia because they are more numerous accounted about 34% of the wheat producing farms [2]. On the other hand, wheat production per farm is also found to be smallest among the poorest households and rises steadily across expenditure quintiles. Not surprisingly, the quantity of wheat sold per farm also rises with expenditure category. The marketed share is just 9 percent for the poorest quintile of farmers, but it rises to 37 percent among the richest farmers.
As a result, 40 percent of the marketed surplus of wheat is produced by the richest 20 percent of farmers. Though they didn’t study the underlying cause of the findings, Minot [2] also indicate that male- headed households produce more wheat on average but sell a somewhat smaller share of the total compared to female-headed households. This may be a result of the fact that female headed households have fewer members, so their consumption needs are smaller, or they might be poorer and forced to sell wheat to buy less expensive food crops.
Efficiency and Instability of Bread Wheat Markets
Market participation among wheat producers is very low, though growing overtime following recent expansion of roads and urban centers in the country. Along with increase in production, good and efficient markets that are expected to transfer a fair proportion of consumers’ price to producers are important to enhance and sustain market participation of wheat producers, thereby create conducive environment for the process agricultural intensification to deepen further with a positive impact on poverty reduction. Market efficiency could be measured in terms of a range of indicators.
In this review study, however, two measures are selected: the degree of spread between consumers and producers price measured as the share of farmers and producers from consumers’ price and volatility of producers’ price measured as temporal differences in seasonality of output prices. Developments in real farm prices which measure the relative growth in farm/output prices to non-farm prices (i.e. price of commodities and services consumed by farmers) could be more important in terms of indicating resource transfers between the two sectors; but this was not computed for lack of time series data on these variables The above graphs on wheat price trend reveal two points. First, the spread between wheat producers’ price (in Bale region) and consumers’ market price in Addis remains high. Second, the gap in producers’ and consumers market price went in par as market prices paid by consumers increased over time. The average share of wheat producers in consumers’ market price paid over the past fifteen years, between 2000 and 2015 is 63 percent, and varies between 60 percent in 2012 and 73 percent in 2008. It is important to note that this figure will shrink further if one considers markets like in Dire Dawa or Mekele which are located very far from Addis market which could also serve as distribution centers for these markets. This indicates that over 38 percent of the price paid by wheat consumers in Addis (which is located on average about 400 Km from producing areas) accounted for transport costs, loading and unloading costs, and profit margin and processing expense, if any.
Reducing these costs improves market efficiency. On the other hand, the gap between producers’ and consumers’ prices remains similar even if consumer prices increased significantly over time. The low competitiveness level in wheat market could play the role in preventing wheat producers to increase their share from the growing consumers’ price. All these indicate the need to enhance the competitiveness of smallholder producers in their engagement in agricultural output markets. The temporal difference in wheat seasonal prices is high. Over the past 14 years, price at post-harvest period decline on average by 70 percent when compared to the price at pre-harvest season when prices reach at their peak. This difference in price gap declines to 24 percent if we consider the mean annual price instead of the lowest seasonal price.
This seasonal fluctuation in grain price reflects difference in seasonal grain supply. The grain market is generally flooded with crops just after the meher harvest when demand is relatively the lowest. In fact, it is estimated that during the post-meher harvest period between January and March, 79 percent of annual crop sales of farmers and 51 percent of annual purchases of traders take place [44]. As smallholders have no financial capacity or/and improved storage condition to delay their post- harvest sale, output prices both producers’ and consumers’ prices drop substantially just after harvest season.
Market Institutions, Transaction Costs, and Social Capital in the Ethiopian Grain Market
By means of using a New Institutional Economics framework, this review study addresses a fundamental aspect of markets: how do buyers and sellers find each other and coordinate the transfer of goods? It enumerates the transaction costs related to search faced by traders in Ethiopia and analyzes the role of brokers in minimizing these transaction costs. The transaction costs of market search are significant in the Ethiopian grain market.
Estimated as the opportunity cost of labor time spent searching for a trading partner and the opportunity cost of holding capital fixed during that search, these costs represent one-fifth of all marketing costs. The finding results of this review study shows that traders minimize their transaction costs of search by using brokers, who enable them to exchange with unknown partners. The report also shows that at the level of the grain economy as a whole, brokers significantly increase the total economic welfare by enabling a more efficient allocation of search effort by traders.
Thus, traders with relatively higher search efficiency and lower search costs choose to search on their own, while traders with lower search efficiency and higher search costs choose to use a broker.
Economic Evaluation of the Bread Wheat Grain Yields
The Economic evaluation results of the varieties and plants density have been shown a consistent profitable response on grain yield of bread wheat market.
- Bread Wheat Varieties and Four Levels m-2 of Plant Population
- Shorima
- Dendea
- Hidassie
- 250
- 300
- 350
- 400
- 250
- 300
- 350
- 400
- 250
- 300
- 350
- 400
- Seed Cost.
- 1373
- 1647
- 1992
- 2199
- 1586
- 1922
- 2227
- 2563
- 1880
- 2166
- 2532
- 2898
- Fertilizer Cost-NPS
- 609
- 609
- 609
- 609
- 609
- 609
- 609
- 609
- 609
- 609
- 609
- 609
- Fertilizer Cost-Urea
- 333
- 333
- 333
- 333
- 333
- 333
- 333
- 333
- 333
- 333
- 333
- 333
- Chemical Cost
- 473
- 473
- 473
- 473
- 473
- 473
- 473
- 473
- 473
- 473
- 473
- 473
- Wage for Planting
- 568
- 568
- 568
- 568
- 568
- 568
- 568
- 568
- 568
- 568
- 568
- 568
- Wage for 1st Weeding
- 530
- 530
- 530
- 530
- 530
- 530
- 530
- 530
- 530
- 530
- 530
- 530
- Wage for 2nd Weeding
- 416
- 416
- 416
- 416
- 416
- 416
- 416
- 416
- 416
- 416
- 416
- 416
- Wage for Harvesting
- 1080
- 1080
- 1080
- 1080
- 1080
- 1080
- 1080
- 1080
- 1080
- 1080
- 1080
- 1080
- Total Costs that Varied
- 5382
- 5656
- 6001
- 6208
- 5595
- 5931
- 6236
- 6572
- 5889
- 6175
- 6541
- 6907
- Cost of Items and
- Services (ETB/ha)
Table 3: Total Costs of Different Items and Inputs Used in Partial Budget Analysis.
The results of the partial budget analysis and the economic data used in the development of the partial budget analysis are illustrated in (Table 4).
Market Costs that Vary and the Inputs Price Data Collected
Data necessary for economic analysis was collected from the experiment field and from the nearest wheat producing farmers. All variable costs including land preparation, planting, weed control, & harvesting costs are estimated based on the actual field prices at the time of planting, & at vegetative growth stages as well as immediately after harvest; & assigned over the varieties and plant density levels.
The variables buying costs and selling prices used for economic analysis is the 2018 and 2019 marketing costs & local market prices respectively, due to the better management conditions. The costs of NPS & N fertilizer were estimated based on the cost of NPS & Urea, respectively. Ascendancy analysis, as recommended by CIMMYT [45], was applied to treatments with higher variable costs, but lower net benefits; & dominated treatments removed from further considerations in Marginal analysis.
The minimum acceptable rate of return was taken as 100%; and treatments with lower minimum rates of return were also removed from further analysis [46]. The above assigned seed prices are calculated with normal seed price of ETB 2288.00 per 150 kg (400 plants m-2) for one hectare, but it may become vary from this according to the varieties seed size. The total cost that vary (TVC) for lesser plant density levels was lower than the greater plant density levels.
On the other hand, lowest net benefit (NBV) was scored from Hidassie variety due to the highest seed rate of 400 plants m-2 which benefited ETB 32288.00 ha-1. Relevant data to conduct preliminary assessment of economic analysis, yield levels were collected using data collecting formats that were developed to this effect [11]. These were mainly the costs of inputs, wages, fertilizers, chemicals and the prices of outputs.
Partial Budget Analysis of Bread Wheat GrainYelds
In order to organize the experimental data and information about the costs and benefits of various alternative treatments, a partial budget analysis was done to determine the economic impact of various alternative treatments as compared to the farmers’ practice for bread wheat production at the study area. Local market (LM) price was used to calculate the product value. The cost of labour for weeding was taken at 35.00 ETB per day. Considering the costs that varied cost of seed, fertilizers, chemicals and labour wage for planting, weeding and harvesting, the farmers’ practice had a lower cost than the experimental method. In the partial budgeting analysis result of the present study, the costs for the different plant density levels varied according to their rates requirements being other costs were constant for each treatment [46].
In order to recommend the present results for the study area, it is necessary to estimate the minimum rate of return acceptable to farmers or producers in the recommendation domain. Based on partial budget analysis, the highest net benefit (49842 ETB ha-1) was obtained from treatment combination of variety Hidassie/large seed size/ with a seed rate of 300 plants m-1, followed by net benefit (47411.00 ETB ha-1) was obtained from the treatment combination of variety Hidassie/large seed size/ with a seed rate of 250 plants m-2, while the lowest net benefit (32288.00 ETB/ ha-1) was also obtained from the combination of variety Hidassie/ large seed size/ with a seed rate of 400 plants m-2 only in one growing season as shown on (Table 4).
Benefit to Cost Ratio Analysis (BCR)
The benefit-cost ratio analysis was used in the cost-benefit analysis in order to summarize the overall relationship between the relative costs and benefits of the proposed research project in which the BCR was expressed in monetary terms. The alternatives are not simply ranked but can be quantitatively assessed one against the other.
The highest benefit cost ratio of (8.07) with low marginal cost and more profitable MRR (8.50) was obtained from the variety Hidassie/large seed size/ at the use of 300 seeds m-2 seeding rate followed by (8.05) benefit cost ratio with the advantageous MRR (9.55) was recorded from the variety Hidassie/large seed size/ at seeding rate of 250 plants m-2 respectively (Table 6 and 4 ). Therefore, the most economical seed rates for small scale farmers of the study area with low cost of production and higher benefits in this case were 300 and 250 plants m-2 seeding rates of variety Hidassie/large seed size/ respectively.
| Treat. | Variety | Plant Density ha-1 | Average Grain Yield | Adjusted Grain Yield | Total Cost | Gross Farm Benefit | Net Benefit Value | Benefit to Cost Ratio (ETB) |
|---|---|---|---|---|---|---|---|---|
| 1 | Shorima | 2500000 Plants | 3.93 | 3.537 | 5382 | 45,981.00 | 40599 | 7.54 |
| 2 | Shorima | 3000000 Plants | 4.346 | 3.911 | 5656 | 50,843.00 | 45187 | 7.99 |
| 3 | Shorima | 3500000 Plants | 4.322 | 3.89 | 6001 | 51,740.00 | 45739 | 7.62 |
| 4 | Shorima | 4000000 Plants | 4.059 | 3.653 | 6178 | 47,489.00 | 41311 | 6.69 |
| 5 | Dendea | 2500000 Plants | 4.134 | 3.721 | 5595 | 48,373.00 | 42778 | 7.65 |
| 6 | Dendea | 3000000 Plants | 4.045 | 3.641 | 5931 | 47,333.00 | 41402 | 6.98 |
| 7 | Dendea | 3500000 Plants | 4.485 | 4.036 | 6236 | 52,468.00 | 46232 | 7.41 |
| 8 | Dendea | 4000000 Plants | 4.865 | 4.379 | 6572 | 56,927.00 | 50355 | 7.66 |
| 9 | Hidassie | 2500000 Plants | 4.556 | 4.1 | 5889 | 53,300.00 | 47411 | 8.05 |
| 10 | Hidassie | 3000000 Plants | 4.788 | 4.309 | 6175 | 56,017.00 | 49842 | 8.07 |
| 11 | Hidassie | 3500000 Plants | 3.643 | 3.279 | 6541 | 42,627.00 | 36086 | 5.52 |
| 12 | Hidassie | 4000000 Plants | 3.35 | 3.015 | 6907 | 39,195.00 | 32288 | 4.67 |
Table 4: Partial Budgeting Analysis of Bread Wheat Grain Yields.
Note: Cost of seed 15.25 ETB/kg; Labor Cost ETB 35/day; Field Sales Market Price ETB 13.00/kg Table 4: Partial Budgeting Analysis of Bread Wheat Grain Yields.
Adjusted Grain Yield Analysis of Bread Wheat
The adjusted yield is the average yield adjusted downward by a certain percentage of downward by 10% diminution to reflect the difference between the experimental yield and the yield farmers could expect from the treatment. Experimental yields, even from on-farm experiments under representative conditions, are often higher than the grain yields that farmers could expect using the same treatments (CIMMYT, 1988).
| Plant Density Levels | ||||||||
|---|---|---|---|---|---|---|---|---|
| 250 Plants m-2 | 300 Plants m-2 | 350 Plants m-2 | 400 Plants m-2 | |||||
| Variety | UAGY | Agy | UAGY | Agy | UAGY | Agy | UAGY | Agy |
| Tons ha-1 | Tons ha1 | Tons ha-1 | Tons ha-1 | Tons ha-1 | Tons ha-1 | Tons ha-1 | Tons ha-1 | |
| Shorima | 3.93 | 3.537 | 4.346 | 3.911 | 4.322 | 3.89 | 4.059 | 3.653 |
| Dendea | 4.134 | 3.721 | 4.045 | 3.641 | 4.485 | 4.036 | 4.865 | 4.379 |
| Hidassie | 4.556 | 4.1 | 4.788 | 4.309 | 3.643 | 3.279 | 3.35 | 3.015 |
Table 5: Adjusted Grain Yield of Bread Wheat Varieties and Plants Density Experiment.
Note: - UAGY = unadjusted grain yield; AGY = adjusted grain yield. Table 5: Adjusted Grain Yield of Bread Wheat Varieties and Plants Density Experiment.
There are several reasons for yield adjustment insistences and just to emphasize some key points:
- Field Management Researchers can often be more precise and sometimes more timely than farmers in operations such as plant spacing, fertilizer application, or weed control.
- Plot Size Yields estimated from small plots often overstate the yield of an entire field because of errors in the measurement of the harvested area and because the small plots tend to be more uniform than the farmers large fields.
- Harvest Date Researchers often harvest a crop at physiological maturity, whereas farmers may not harvest at the optimum time. Thus even when the yields of both researchers and farmers are adjusted to constant moisture content, the researchers’ yield may be higher, because of fewer losses to insects, birds, rodents, ear rots, or shattering.
- Form of Harvest Insome cases farmers’ harvest methods may lead to heavier losses than result from researchers’ harvest methods. This might occur, for example, if farmers harvest their fields by machine and researchers carry out a more careful manual harvest. Unless some adjustment is made for these factors, the experimental yields will overestimate the returns that farmers are likely to get from a particular treatment.
One way to estimate the adjustment required is to compare yields obtained in the experimental treatment which represents farmers’ practice with yields from carefully sampled check plots in the farmers’ fields. Where this is not possible, it is necessary to review each of the four factors discussed earlier and assign a percentage adjustment [46].
Ascendancy Analysis of Bread Wheat Grain Yield
Ascendancy analysis procedure was carried to select potentially profitable treatments from the range that was tested. It was done first by listing the treatments in order of increasing costs that vary as shown on (Table 12). Any treatment that had net benefits that are less than or equal to those of a treatment with lower costs that vary is dominated [47, 48, 49].
Then the subjugated treatments were rejected from further economic analysis. It led to the selection of treatments, Hidassie/large seed size/ at seed rate of 250 and 300 seeds m-2, which ranked in equal order of the BCR respectively. The marginal rate of return for non-dominated treatments is stated in (Table 6). MRR among treatments of the variety Hidassie at seed rate of 300 seeds m-2 were lower than that of the treatments in the variety Hidassie at seed rate of 250 seeds m-2. It was finally to in that order would give positive MRR of 8.50 and 9.55 respectively [50, 51].
| Treat. No. | Variety/Seed Size | PDL | TVC (ETB ha-1) | NBV(ETB-1ha) | Ascendancy |
|---|---|---|---|---|---|
| 1 | Shorima/Small Sized Seeds | 250 plants m-2 | 5,382.00 | 40,599.00 | |
| 5 | Dendea/Medium Sized Seeds | 250 plants m-2 | 5,595.00 | 42,778.00 | |
| 2 | Shorima/Small Sized Seeds | 300 plants m-2 | 5,656.00 | 45,187.00 | |
| 9 | Hidassie/Large Sized Seeds | 250 plants m-2 | 5,889.00 | 47,411.00 | |
| 6 | Dendea/Medium Sized Seeds | 300 plants m-2 | 5,931.00 | 41,402.00 | Subjugated |
| 3 | Shorima/Small Sized Seeds | 350 plants m-2 | 6,001.00 | 45,739.00 | Subjugated |
| 10 | Hidassie/Large Sized Seeds | 300 plants m-2 | 6,175.00 | 49,842.00 | |
| 4 | Shorima/Small Sized Seeds | 400 plants m-2 | 6,178.00 | 41,311.00 | Subjugated |
| 7 | Dendea/Medium Sized Seeds | 350 plants m-2 | 6,236.00 | 46,232.00 | Subjugated |
| 11 | Hidassie/Large Sized Seeds | 350 plants m-2 | 6,541.00 | 36.086.00 | Subjugated |
| 8 | Dendea/Medium Sized Seeds | 400 plants m-2 | 6,572.00 | 50,355.00 | |
| 12 | Hidassie/Large Sized Seeds | 400 plants m-2 | 6,907.00 | 32,288.00 | Subjugated |
Table 6: Ascendancy Analysis of Bread Wheat Grain Yields.
Note: PDL = plant density level; TVC= total variable cost; NBV = net benefit value. Table 6: Ascendancy Analysis of Bread Wheat Grain Yields.
| Treat. No | Varieties by Plant Populations | TVC | MC | NBV | NB | MRR |
|---|---|---|---|---|---|---|
| (ETB ha-1) | (ETB ha-1) | (ETB ha-1) | (ETB ha-1) | |||
| 1 | Shorima/Small x 250 Plants m-2 | 5382 | 40599*R | |||
| 5 | Dendea/Medium x 250 Plants m-2 | 5595 | 213 | 42778*R | 2179 | 10.23 |
| 2 | Shorima/Small x 300 Plants m-2 | 5656 | 61 | 45187*R | 2409 | 39.49 |
| 9 | Hidassie/Large x 250 Plants m-2 | 5889 | 233 | 47411 | 2224 | 9.55 |
| 10 | Hidassie/Large x 300 Plants m-2 | 6175 | 286 | 49842 | 2431 | 8.5 |
| 8 | Dendea/Medium x 400 Plants m-2 | 6572 | 397 | 50355*R | 513 | 1.29 |
Table 7: Ascendancy Analysis of Bread Wheat Grain Yields.
The changes to the variety Shorima at plant density levels of 250 seed m-2 is rejected for this reason to remain with changes to the variety Hidassie /large seed size/ at plant density levels of 250 and 300 plants m-2 which gave more than 100% MRR as promising new practices for farmers under the prevailing price structure (Table 7). According CIMMYT [45], the minimum acceptable marginal rate of return (MRR) should be 100%.
As stated by CIMMYT [45], recommendation is not necessarily based on the highest yield and even not based on the highest MRR. Recommendation for the economically profitable variety is just based on the highest net benefit cost ratio and thus, the most economically superior variety as well as seed rate for farmers of the study area with low cost of production and the highest net benefits were identified to be the variety Hidassie /large seed size/ at seeding rate of 300 plants m-2 (142.00 kg ha-2). The seeding rate of 250 plants m-2 (118 kg ha-2) of this variety was also profitable with the highest net benefit and recommended as 2nd option. Consistent with the partial budgeting analysis results, it can be determined that the most profitable treatment was the variety Hidassie /large seed size/ which gave the highest benefit cost ratio of (8.07) and MRR (8.50) at seed rate of 300 plants m-2 whereas, alternatively the MRR of (9.55) and benefit cost ratio (8.05) were attained also from the variety Hidassie /large seed size/ at seeding rate of 250 plants m-2 as shown on (Tables 4).
Therefore, the changes to the variety Shorima /small seed size/ at a seed rate of 250 seeds m-2; Dendea at a seed rate of 250 seeds m-2, Shorima /small seed size/ at a seed rate of 300 plants m-2 and Dendea at a seed rate of 400 plants m-2 are removed for their low benefit cost ratio and to remain with the changes to variety Hidassie/large seed size/ at seed rate of 300 and 250 plants m-2. The yield of treatment 8 is higher than that of treatment 10 as shown on, but the dominance analysis shows that the value of the increase in yield is not enough to compensate the increase in costs. Farmers would be better off using the lower seed rate with lower costs [46, 52, 53, 54].
Summary of Conclusion and Recomendation
Over the forgoing two decades, both bread wheat production and consumption have shown increasing trends in Ethiopia. Bread wheat import has also grown significantly over the past decades. So far, this significant growth in national production and import of bread wheat has not inverted the increasing trend in bread wheat and product prices, implying an even sooner growth of bread wheat demand. Even with a huge investment by the Ethiopian government in agricultural extension programs, studies indicate growing bread wheat supply shortage in the pending decades. This recommends that the need for increased but competent investment not only in bread wheat production but also in processing and marketing.
Even if Ethiopian bread wheat producers are in general small, a review of relevant literature shows that to some extent of larger farmers and large-scale producers supply most of the marketed local bread wheat in the country. For instance, only 10 percent of wheat producers sell more than 40 percent of their wheat harvest while only 5 percent sell more than half of their wheat production.
The top 20 percent of the wheat sellers account for 60 percent of the domestic wheat sale. On the other hand, above half of the wheat farmers do not sell any of their wheat production. These facts are important in terms of informing policies and institutions on the need to expand wheat production in general and marketable wheat in particular.
In this way, institutional and policy reforms to improve the supply value chain, development of irrigation systems and mechanized farming methods along with supplementary investment in research and development can be feasible policy interventions to increase bread wheat supply in the country. Bread wheat is widely imported by the government. However, the effect of international market on the local bread wheat market is expected to be limited as the government carefully shaped the supply and market value chain for such imported bread wheat product. Until now, imported brad wheat is expected to influence bread wheat demand on the bread local market of those who receive subsidized bread wheat, which are millers and few institutional consumers. Therefore, flour prices should show the prevalent reaction to international bread wheat market instabilities, followed by wholesale bread wheat prices.
Producer and consumer prices as well as the bread market are expected to respond only little to international bread wheat prices. This observation, however, need to be tested using further empirical research. Lack of incentive encouragement were greater at the wholesale level than at farm gate. The limited export of bread wheat and high level of cheap imports, which are sold at subsidized prices, do likely depress the domestic bread wheat market. This paper has reviewed wheat production practices and constraints in Ethiopia and hence, these constraints were broadly grouped into two categories: technical and socio-economic.
The two major bread wheat growing environments were covered:
- Lighland cool wet areas and
- Low-altitude warm dry areas.
Even though there has been a reasonable extent of research to measure the influence of technical constraints on bread wheat production, research on socioeconomic constraints has mainly been qualitative. Therefore, there is a need to shift the emphasis of socio-economic research to quantitatively determine the impact of socio-economic constraints on wheat production. Some studies have evaluated the government’s decision to focus on wheat import for its price stabilization policy, by assessing the rationales and cost-effectiveness of public wheat imports vis-à-vis local procurement. For instance, some researchers reported that except in 2008 and 2009, local procurement of bread wheat would have been justified and provided better incentives for farmers to grow bread wheat at a higher price, which is still below import equivalence. This could encourage bread wheat producers to accept new technologies and increase bread wheat production.
The existing findings of this review study shows that there is a need of important institutional and operational reforms for improving efficiency in the wheat-bread value chain. Important among them are the need for easily verifiable standards and norms for assessing bread wheat quality, better regulation of brokers specially to control their excessive interference, better dispute settlement mechanisms, and increased financial access to enhance operational constraints such as storage capacity. Some also reported for enhanced access to public market information, in particular on imported wheat market, and transparency on the operation of government wheat stocks.
In general, the assimilated evidences obtained from the present review study would intensely highlighte the importance of the functioning of local markets in activating technology adoption by farmers. In particular, it shows that uncertainty about quality assessments at the time of sales transactions, there is may be a strong discouragement or disincentive for farmers to invest in quality-enhancing technologies.
This review study interfered on only one side of the exchange that is, farmers’ increased knowledge of the value of their product rather than interfered on the other side, which would have involved training local traders or cooperatives, for instance on quality recognition. Accordingly, this review study did not fully address all issues related to bargaining based on quality assessments.
More generally, however grades and standards exist in food markets in Africa south of the Sahara, they tend to be applied only at higher levels of combination upon reaching a major consumption or export market. Findings from existing review study suggests that implementation of micro- level authorization could facilitate the type of food crop combination that is often promoted for the region.
A more general intervention that are looking for trial in the short run is local, micro-level third-party authorization or certification schemes. As a whole, the evidences attained from the current review study shows that farmers would likely be willing to pay for such services, owing to their low level of trust in the current marketing systems. After this, the policy change is expected to have a progressive impact on profitable bread wheat production, trade and general economic activity in the country.
Conclusion
One of the great challenges encountering Ethiopia at present is the production of sufficient food to feed the quickly increasing population growth. Getting more agricultural land-dwelling into farming is not possible in the closely inhabited regions. Improved agricultural productivity requires higher yields per unit land area, which increases the market demand of improving the production and productivity of bread wheat to increase the also the market supply with reasonable market price. Concerning varietal variations, previously studies revealed that selecting varieties which are related to the specified population and use by farmers may be a feasible option for improving bread wheat markets.
Based on the result of the economic analysis, among four plant density levels the use of 300 and 250 seeds m-2 for the variety Hidassie /large seed size/ is superior in most of bread wheat agronomic traits. The bread wheat varieties seed size and plant population levels interaction showed that most economical and profitable grain yield of 4100 and 4339 kg ha-1 was produced at seed rate of 250 and 300 plants m-2 for the variety Hidassie /large seed size/ respectively. According to the partial budgeting analysis, a visible advantageous and more profitable dominance with low market cost of the variety Hidassie /large seed size/ at plant density of 300 plants m-2 (142 kg ha-1) and 250 plants m-2 (118 kg ha-1) was found to be over the other varieties.
This shows that the variety Hidassie is genetically better in grain yield and proffite able market price both in grain and seed than varieties Dendea and Shorima. As a whole, significant variations in grain yield and most of agronomic parameters of bread wheat varieties were observed to verify their cost benefit advantage due to their variety seed size and plant population levels. The current study suggested that sowing bread wheat with large sized seeds such as the variety Hidassie was peculiarly beneficial with most encouraging agronomic performance. The economic analysis of the experiment was brought to select the best combination of the variety Hidassie/large seed size/ at a plant density rate of 300 plants m-2 (142.00 kg ha-1) gave the greatest grain yield (4339 kg ha-1) with very benefical profitable market price with low cost of production and higher net benefits and can be recommended tentatively as a 1st option for the study area.
Alternatively, the variety Hidassie/large seed size/ at a plant density level of 250 plants m-2 (118 kg ha-1) gave better yield (4100 kg ha-1) with a slightly additional cost rather than the primarily recommended seed rate and can be recommended as a 2nd option for the small scale farmers of the study area. However, since this review study was done only on the limited parts of the country it is advisable to conduct on the national level and it is better to repeat the study over the national macro-economy level to overcome the key challenges of the national bread wheat potential markets in Ethiopia as well as to make a reliable and acceptable recommendations for bread wheat market-enhancing policy makers.
Recommendation
All the recommendations which have suggested here in this paper are primarily addressed to the bread wheat producers and marketing processers of the country as well as for all of other agro-industry firms and wheat mroduction traders in the country which are officially known under their marketing value chains, are the focus this review paper in particular. Policy involvements that planned at improving bread wheat production markets for that matter, yet needs interventions more than the farm lands at the whole bread wheat value chain. Both local production and import are the two key sources of bread wheat grain supply to the Ethiopian crop wheat value chain have shown a considerable increase since the mid-1990s.
Policy involvements that intended at improving bread wheat production markets for that matter, however, require interferences further than the farm lands at the whole bread wheat value chain.So far, a stable increase in national wheat feeding has led to in rising bread wheat and the product market prices over the forgoing two decades. For instance, bread wheat grain, wheat flour as well as wheat bread prices have all being more than doubled up among the years 2000 and 2019. Using a qualitative survey of certain bread wheat value chain actors and a pilot review study of existing literature. This review study provides an overview of the bread wheat value chain, institutional and marketing arrangements, as well as the buyer and seller comportment of bread wheat value chain actors in Ethiopia.
The bread wheat value chain be made up of multiple actors that comprises numerous smallholder farmers and the Ethiopian grain trade enterprise at the upstream, urban and rural customers at the other termination.
Therefore, to advance the wheat production marketing area at the crucial level, the following recommendations will have significant contribution: Routine awareness creation to the wheat producing farmers through training on value- adding activities like grading and standardization which can increase the quality of wheat, how the farmers select improved wheat seed, what type of improved production technologies they used and how they can increase the productivity of wheat on their limited land size are very important issues which enable the farmers to gain a high return.
Ethiopia has numerous irrigable rivers which are appropriate for large-scale production. Therefore, designing appropriate policy which motivates large-scale farming industries for wheat production and expanding irrigable land are the benchmark to bring satisfactory productivity of wheat which make Ethiopia a competitor to other African wheat-producing countries. Lack of infrastructures like road and telecommunication leads to lack of important market information delivery between input suppliers, producers, distributers and consumers. So, built-up of infrastructure is the pre-requirements which can harness production and marketing of wheat constraints in Ethiopia. Cooperative associations are service render establishments that are not motivated for profit. They can minimize the problem of market price cheating of the producers by wheat traders. Therefore, encouraging cooperative associations is an important concern from accountable organization.
To guarantee small-scale wheat producers to participate entirely in meeting urban wheat demand, proper policy actions are required which facilitate farming modernization with mechanized operations and diminish obstacles restraining the acceptance of environmentally sustainable approaching methods and soe what improved technologies. Involvements on consolidation access to education, credit service, extension service, market information and forward and backward linkage of farmers with the other stockholders are very important points which should get attention from responsible bodies.
To sum up, the certain judgments of this study stresses the need for creation of bread wheat market-enhancing policies, such as quality control and dispute settlement appliances as well as better access to market information, to improve the bread wheat productivity as well as marketing efficiency.
Acknowledgment
This study was self-sponsored project and does not financially suported by any internal or external funding organizations. The author would like to acknowledge colleagues who work at Natural Resource Management Research Process for their unlimited cooperation and technical supports while piloting this study. My sincere gratitude is also due to the wonderful cooperation of the researchers at Kulumsa Agricultural Research Center for their precise information and analytical advices while conducting this study.
References
-
FAO (Food and Agriculture Organization) (2015a) Food Balance Sheets. FAOSTAT Rome.
-
Minot N, Warner J, Lemma S, Kassa L, Gashaw A, et al. (2015) The Wheat Supply Chain in Ethiopia: Patterns, Trends, and Policy Options. International Food Policy Research Institute (IFPRI) Washington, DC, pp: 66.
-
CSA (Central Statistical Agency) (2014a) Agricultural Sample Survey 2013/14. Volume I: Report on Area and Production of Major Crops.
-
FAO (Food and Agriculture Organization) (2015b) Agricultural Production Statistics. FAOSTAT. Rome.
-
MoANR (2016) Crop Variety Register, Issue No. 19, Plant Variety Release, Protection and Seed Quality Control Directorate, Addis Ababa, Ethiopia.
-
Rashid S, Lemma S (2014) Public Wheat Imports since 2008: The Rationales and Cost- Effectiveness. Research for Ethiopia’s Agriculture Policy (REAP), International Food Policy Research Institute, Washington, DC.
-
FAO (2014) Analysis of price incentives for wheat in Ethiopia for the time period 2005-2012. FAO/ the Monitoring and Analysing Food and Agricultural Policies (MAFAP) programme. Food and Agriculture Organization, Rome, Italy.
-
Gebreselassie S, Mekbib GH, Matthias K (2017) The Wheat Sector in Ethiopia: Current Status and Key Challenges for Future Value Chain Development.
-
Sapna G, Sonia G, Meenal R, Neha J, Binay K, et al. (2015) Agricultural Research, Effect of Allelic Variation in Triticin on Bread- and Chapati-Making Qualities of Wheat (Triticum aestivum), 4(2): 139-151.
-
Bhalla PL, Smith N (2006) Agrobacterium tumefaciens- mediated transformation of cauliflower, Brassica oleracea var. botrytis. Mol Breed 4: 531-541.
-
Anbessie Debebe A, Abebe M, Dechassa H (2020) Effect of Plant Population on Growth, Yields and Quality of Bread Wheat (_Triticum Aestivum_ L.) Varieties at Kulumsa in Arsi Zone, South-Eastern Ethiopia. International Journal of Research Studies in Agricultural Sciences (IJRSAS) 6(2): 32-53.
-
CSA (2017) Agricultural sample survey: Report on area and production of major crops. (Private peasant holdings, Meher Season) Statistical Bulletin 584 Volume 1, Central Statistical Authority (CSA), Addis Ababa.
-
Tuino, SD, MNKorejo, AD Jarwar and MR Waggan (2006) Studies on indigenous and exotic weed competition in wheat. Pak J Agric Engg Vet Sci 22(1): 1-8.
-
Malik MA, Irfan M, Ahmed ZI, Zahoor F (2008) Residual effect of summer grain legumes on yield and yield components of wheat (Triticum aestivum L.). Pak J Agri, Agril Engg, Vet Sci 22(1): 9-11.
-
Mann RA, Jehangir WA, Masih I (2004) Improving crop and water productivity of rice-wheat system in Punjab, Pakistan. In: Proceedings of the 4th International Crop Science Congress, Brisbane.
-
Anonymous (2002) Nutrient Deficiency Symptoms in Rice. Better Crops Intl. The Journal of Agricultural Sciences 11: 3198.
-
Almaz A (2014) Response of Sulphur Fertilizer Application to Growth, Yield and Quality of Bread Wheat (_Triticum Aestivum_) in Kulumsa, Arsi, Ethiopia.
-
Anbessie DA (2020) Pilot Review on Management Stratagies of Constraints in Bread Wheat (_Triticum_ _Aestivum_ L.) production. Journal of Ecology and National Resource 4(5): 000210.
-
Shewry PR, D’Ovidio R, Lafiandra D, Jenkins JA, Mills ENC, et al. (2009) Wheat Grain Proteins. In: Khan K, Shewry PR (eds), Wheat, St. Paul, AACC International, Inc.: 53.
-
Slukova M, Levkova J, Michalcova A, Horackova S, Skrivan P (2017) Effect of the Dough Mixing Process on the Quality of Wheat Buckwheat Proteins. Czech J Food Sci 6: 522-531.
-
Pena-Bautista RJ, Hernandez-Espinosa N, Jones JM, Guzman C, Braun HJ (2017) CIMMYT Series on Carbohydrates, Wheat, Grains, and Health: Wheat-Based Foods: Their Global and Regional Importance in the Food Supply, Nutrition, and Health.
-
EEA (2015) Report on the Ethiopian Economy. Ethiopian Economics Association, Addis Ababa, Ethiopia.
-
Bergh, K, Chew, A, Gugerty, M K, Anderson L (2012) Wheat Value Chain: Ethiopia: Study conducted for the Agricultural Policy Team of the Bill & Melinda Gates Foundation, pp: 1-21.
-
CSA (Central Statistical Agency) (2013) Annual Average Wheat Flour Producers’ Price Source, Large and Medium scale Manufacturing Industry Survey Reports.
-
Mohammed H (2009) Value Chain Concept and Its Application to Wheat in ethiopia. Paper presented at Value Chain Seminar for Developing Rural Agri-Business in Ethiopia. UNECA Conference Centre, Addis Ababa, Ethiopia.
-
Demeke M, Di Marcantonio F (2013) Analysis of Incentives and Disincentives for Wheat in Ethiopia. Technical notes series, MAFAP, FAO, Rome, pp: 2-36.
-
Kirimi L, Sitko N, Jayne TS, Karin F, Muyanga M, et al. (2011) Farm Gate-to-Consumer Value Chain Analysis of Kenya’s Maize Marketing System. Tegemeo Institute of Agricultural Policy and Development, Nairobi, Kenya.
-
Walker DJ, Wandschneider T (2005) Local Food Aid Procurement in Ethiopia. A Case Study Report for EC- PREP (UK Department for International Development), pp: 1-72.
-
IFDC (2012) Ethiopia Fertilizer Assessment. The African Fertilizer and Agribusiness Partnership, pp: 1-45.
-
CSA (Central Statistical Agency) (2014d) Agricultural Sample Survey 2013/14. Volume I: Report on Farm Management Practices.
-
Gashaw TA, de Brauw A, Minot N, Bernard T (2014) The Impact of the Use of New Technologies on Farmers Wheat Yield in Ethiopia: Evidence from a Randomized Controlled Trial. International Food Policy Research Institute Washington, D.C, pp: 31.
-
Byerlee D, Spielman DJ, Alemu D, Gautam M (2007) Policies to Promote Cereal Intensification in Ethiopia: A Review of Evidence and Experience. IFPRI discussion paper no. 707. Washington, DC: IFPRI, pp: 33.
-
Stefan D (2009) Rural poverty: old challenges in new contexts (English). The World Bank research observer 24(1): 1-28.
-
Hailu Gebre-Mariam (1991) Wheat production and research in Ethiopia. In: Hailu Gebre Mariam, Tanner DG, Huluka M (Eds.), Wheat research in Ethiopia: IAR/ CIMMYT, Addis Ababa, Ethiopia, pp: 1-136.
-
Yu B, Nin-Pratt A, Funes J, Gemessa SA (2011) Cereal Production and Technology Adoption in Ethiopia. International Food Policy Research Institute (IFPRI) – Ethiopia Strategy Support Program II (ESSP II), ESSP Working Paper, pp: 35.
-
FAO (2016) FAOSTAT, Food Balance Sheets, (Food and Agriculture Organization of the United Nations).
-
McMullan S (2014) Changing Hands: A new model for selling seeds to farmers in Ethiopia. Research for Ethiopia’s Agriculture Policy (REAP), International Food Policy Research Institute, Washington, DC, 20006-1006, USA.
-
Alliance for a Green Revolution in Africa (AGRA) (2014) An assessment of agricultural policy and regulatory conl straints to agribusiness investment in Burkina Faso, Ethiopia, Ghana, Nigeria and Tanzania. AGRA: Nairobi, Kenya.
-
Christine H, Joachim VB, Ousmane B, Yemi A, Abiodun FO, et al. (2015) Tapping Potentials of Innovation for Food Security and Sustainable Agricultural Growth: An Africa-Wide Perspective.
-
Spielman DJ (2008) Encouraging economic growth in Ethiopia: Perspectives on agricultural input markets, agricultural extension and advisory services, and agricultural education and training Briefing note prepared for the DFID funded study, Understanding the constraints to continued rapid growth in Ethiopia: the role of agriculture.
-
Biruk D (2014) Wheat Productivity Increase Initiative. Ethiopian Agricultural Transformation Agency, Addis Ababa, Ethiopia.
-
CSA (2015c) Report on Area and Production of Major Crops: Time Series Data for National and Regional Level, Central Statistical Agency.
-
CSA (2014c) Agricultural Sample Survey 2013/14. Volume VII: Report on Crop and Livestock Product Utilization, (Central Statistical Agency).
-
Gabre Madhin ZE (2001) Market Institutions, Transaction Costs, and Social Capital in the Ethiopian.
-
CIMMYT (1988) From agronomic Data to Farmer Recommendations: An Economics Training Manual. Completely Revised edition, Mexico.
-
Anbessie Debebe A (2020) Response of Seed Size and Plant Density on Growth, Yield and Grain Quality of Bread Wheat (Triticum aestivum L.) Varieties under Vertic Luvisols of Kulumsa in Arsi Zone. Ethiopian Institute of Agricultural Research, Kulumsa Agricultural Research Center, Inorganic Soil Fertility Management Research Program, P. O. Box 489, Asella, Ethiopia. Journal of Natural Sciences Research 11(15): 2020.
-
CSA (1995-2016) Agricultural sample survey: Report on area and production of major crops. (Private peasant holdings, Meher Season) Statistical Bulletins, Central Statistical Authority (CSA), Addis Ababa.
-
CSA (2014b) Agricultural Sample Survey 2013/14. Volume I: Report on Land Utilisation, Central Statistical Agency.
-
CSA (2015) Report on Monthly and Annual Average Retail Prices of Agricultural Products by Urban Center and Selected Market Places, Central Statistical Agency.
-
CSA (2015b) Report on Monthly Average Retail Price of Goods and Services by Urban Centers and selected market places: Monthly Bread Price of Bakeries in Addis Ababa per 350gm since 2000, Central Statistical Agency.
-
Gabre-Madhin ZE (2004) Market Institutions, Transaction Costs, and Social Capital in the Ethiopian Grain Market, International Food Policy Research Institute Washington D.C Research Report 124.
-
Kherallah M, Minot N, Kachule R, Soule BG, Berry P, et al. (2001) Impact of agricultural market reforms on smallholder farmers in Benin and Malawi. IFPRI Final Report, Washington, D.C.: International Food Policy Research Institute, pp: 116.
-
Gabre-Madhin ZE (2001) Market Institutions, Transaction Costs, and Social Capital in the Ethiopian Grain Market, International Food Policy Research Institute Washington, D.C Research Report, pp: 108.
-
Husmann C (2014) Transaction Costs on the Ethiopian Formal Seed Market and Implications for the Private Sector. Unpublished Research Report presented at the 11th International Conference on the Ethiopian Economy. Addis Ababa, Ethiopia.
- Lessons to Learn: Trees are More than the Lungs of the World
- Community Forestry Enterprises as a Model for Sustainable Forest Development: The Case Of The "Baja Tarahumara" in Chihuahua, Mexico
- Ecological and Socio-Economic Impacts of Chromolaena odorata and Mesosphaerum suaveolens, Two Invasive Alien Species in Central and Southern Benin, West Africa
- Epigenetic Sustainability: Modeling the Human Factor as a Natural Resource through Science 4.0 and the NR3C1 Biological Pilot
- Growth-at-Risk: A Framework for Assessing Economic Vulnerability
- The Rural Territory as a Socioecological System for the Management of Public Policy for Sustainable Rural Development